Water Quality Training Pt2
•
0 gostou•267 visualizações

1. The document discusses concepts and methods for measuring stream discharge or flow, including current meters, portable flumes, buckets, and float methods. It provides guidance on selecting the appropriate measurement technique based on factors like depth and velocity. 2. Details are given on taking discharge measurements with current meters and portable flumes, including positioning in the stream and recording field notes. 3. Applications of discharge measurements discussed include calculating pollutant loading, interpreting water quality data, understanding stream hydraulics, and assessing the results of acid reduction projects in streams.

Recomendados
Mais conteúdo relacionado
Mais procurados
Mais procurados (19)
Destaque
Destaque (20)
Semelhante a Water Quality Training Pt2
Semelhante a Water Quality Training Pt2 (20)
Mais de Ohio Environmental Council
Mais de Ohio Environmental Council (20)
Water Quality Training Pt2
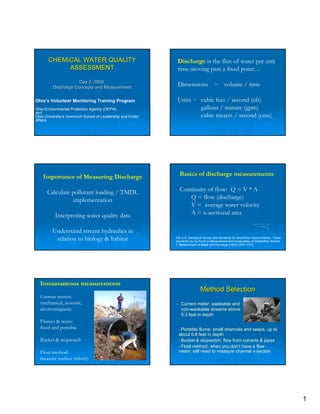
- 1. 1 CHEMICAL WATER QUALITYCHEMICAL WATER QUALITY ASSESSMENTASSESSMENT Day 2,Day 2, 2009:2009: Discharge Concepts and MeasurementDischarge Concepts and Measurement Ohio’s Volunteer Monitoring Training Program Ohio Environmental Protection Agency (OEPA), and Ohio University’s Voinovich School of Leadership and Public Affairs Discharge is the flux of water per unit time moving past a fixed point… Dimensions ~ volume / time Units ~ cubic feet / second (cfs) gallons / minute (gpm) cubic meters / second (cms) Importance of Measuring Discharge Calculate pollutant loading / TMDL implementation Interpreting water quality data Understand stream hydraulics in relation to biology & habitat Basics of discharge measurements Continuity of flow: Q = V * A Q = flow (discharge) V = average water velocity A = x-sectional area The U.S. Geological Survey sets standards for streamflow measurements. These standards can be found in Measurement and Computation of Streamflow Volume 1, Measurement of Stage and Discharge (USGS WSP 2175). Instantaneous measurements Current meters: mechanical, acoustic, electromagnetic Flumes & weirs: fixed and portable Bucket & stopwatch Float method: measure surface velocity Method SelectionMethod Selection • Current meter: wadeable and non-wadeable streams above 0.3 feet in depth • Portable flume: small channels and seeps, up to about 0.8 feet in depth • Bucket & stopwatch: flow from culverts & pipes • Float method: when you don’t have a flow meter; still need to measure channel x-section
- 2. 2 Current Meters Price AA meter: wading rod and bridge crane applications Current Meter Method Selection Measure using theMeasure using the pygmy meterpygmy meter ……measuring flow inmeasuring flow in water flowing slower thanwater flowing slower than 2.5 feet per second2.5 feet per second Measure using a bridgeMeasure using a bridge crane/board and/or thecrane/board and/or the type AA meter.type AA meter. ……measuring flow inmeasuring flow in water flowing faster thanwater flowing faster than 2.5 feet per second2.5 feet per second ThenThenIfIf Velocity Current Meter Method Selection Depth Use a flume or a bucketUse a flume or a bucket and stopwatchand stopwatch ...measuring a flow at a...measuring a flow at a depth of less than aboutdepth of less than about 0.3 feet0.3 feet The AA meter (down to 1.0The AA meter (down to 1.0 ft depth) or pygmy meterft depth) or pygmy meter may be used dependingmay be used depending on the rate of flow, use aon the rate of flow, use a single point measuring atsingle point measuring at 60% of the depth from the60% of the depth from the top of the water surface.top of the water surface. ……measuring a flow at ameasuring a flow at a depth between 0.3 to 2.5depth between 0.3 to 2.5 feetfeet The AA meter should beThe AA meter should be used in a twoused in a two--pointpoint measure at 20% and 80%measure at 20% and 80% of the total depth. Recordof the total depth. Record the average of thesethe average of these recordings as the meanrecordings as the mean velocity of the verticalvelocity of the vertical ……measuring a flow at ameasuring a flow at a depth of greater thandepth of greater than about 2.5 feetabout 2.5 feet ThenThenIfIf Current meter set-up showing positions of the tape and depth/velocity stations Gordon et al., 2004 Field Notes Distance from (width) Depth Velocity (revolutions / time) Portable flume • 2.5 to 1000 gpm • 0.05 to 2.25 cfs • 1” to 8” throat • Pack • Level • Record depth in throat
- 3. 3 Weirs Gordon et al., 2004 Left: stream profile Right: stream x-section Continuous measurements •Rely on stage-discharge relations to relate stream depth to flow •Gage records instantaneous stage •Discharge is reported in real time or statistically summarized and published Daily versus peak flow records Flow regime: seasonality, nature of peaks Clear Creek near Rockbridge, Ohio 0 200 400 600 800 1000 1200 1400 1/1 1/31 3/2 4/1 5/1 5/31 6/30 7/30 8/29 9/28 Meandailyflow(cfs) 1939- 2006 mean WY 2006 WY 1988 Flow estimation in streamsFlow estimation in streams without measurementswithout measurements • USGS regression equations for mean annual Q • Drainage-area only equation* QA = 1.01 A 1.00 • Best-fit equation QA = 0.17(A)1.01 (Latc – 37)0.26 (Pc –27 )0.62 * Applies to Southeast Ohio, published values by USGS are available for other regions of the state Manning’s Equation V = 1.49 R2/3 S1/2 / n Where: V = velocity (length/time) R = hydraulic radius (length) = area / wetted perimeter S = slope (dimensionless) n = channel roughness coefficient
- 4. 4 0.0500.040 - 0.070Steep mountain channels w/ cobble-boulder beds 0.0400.030 - 0.050Steep mountain channels w/ gravel-cobble beds 0.0500.045 - 0.060 Meandering channels w/ high sinuosity and well developed pools and riffles 0.0400.033 - 0.045 Meandering channels w/ some pool-riffle development 0.0300.020 - 0.033Straight, clean channels, no meanders 0.015NAClay 0.012NAConcrete standardrange Manning's nConditions at the Channel Boundary Manning’s roughness coefficient, n Applications of Discharge Measurements Little Raccoon Creek Acid Reduction 0 200 400 600 800 1000 1200 1400 1600 1800 2000 Buffer Run Unnamed Trib - SR124 Mulga Run Middleton Run Flint Run AMD Project Tributary lbs/day-AcidLoadReduction 0 10 20 30 40 50 60 70 80 90 100 %ofTotalAcidLoadFromTributary Acid Load Reduction lbs/day % Acid Load Reduction Comparing Loads and/or Load Reductions LRC Net-Alkalinity Mar 2005 - Jan 2008 0 20 40 60 80 100 120 140 24.55 24.3 22.3 22.15 19.5 18.5 12.71 1.17 Little Raccoon Creek River Mile Net-Alkalinity(mg/l) 189 cfs 3/7/2005 65 cfs 5/9/2005 8.4 cfs 10/3/2005 300 cfs 2/6/2006 27 cfs 7/17/2006 73 cfs 4/24/2007 9.2 cfs 7/9/2007 31 cfs 1/28/2008 OEPA Net-Alk Target 20 mg/l Mulga Run -1321.45 / Middleton Run 1301.41 lb/day Goose Run 197.16 lb/day Buffer Run 305.74 lb/day Flint Run 995.65 lb/day St Rt 124 Seep 50.07 lb/day Average acid loads at trib mouths Concentration vs Flow Flow Duration Curves Leading Creek TMDL Simon, Kuhne, & Dickerson, 2002 Establishing Water Quality Targets