Politician uddhav thackeray biography- Full Details
Ocean City Intermediate School report card 2013-14
1. GRADE SPAN
1
1
2013-14
OCEAN CITY INTERMEDIATE SCHOOL
09-3780-060
CAPE MAY
OCEAN CITY 04-08
19TH STREET & BAY AVE
OCEAN CITY, NJ 08226
OVERVIEW
State of New Jersey
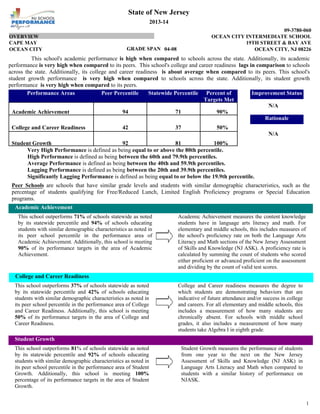
This school's academic performance is high when compared to schools across the state. Additionally, its academic
performance is very high when compared to its peers. This school's college and career readiness lags in comparison to schools
across the state. Additionally, its college and career readiness is about average when compared to its peers. This school's
student growth performance is very high when compared to schools across the state. Additionally, its student growth
performance is very high when compared to its peers.
Improvement Status
N/A
Rationale
N/A
Very High Performance is defined as being equal to or above the 80th percentile.
High Performance is defined as being between the 60th and 79.9th percentiles.
Average Performance is defined as being between the 40th and 59.9th percentiles.
Lagging Performance is defined as being between the 20th and 39.9th percentiles.
Significantly Lagging Performance is defined as being equal to or below the 19.9th percentile.
Peer Schools are schools that have similar grade levels and students with similar demographic characteristics, such as the
percentage of students qualifying for Free/Reduced Lunch, Limited English Proficiency programs or Special Education
programs.
This school outperforms 71% of schools statewide as noted
by its statewide percentile and 94% of schools educating
students with similar demographic characteristics as noted in
its peer school percentile in the performance area of
Academic Achievement. Additionally, this school is meeting
90% of its performance targets in the area of Academic
Achievement.
Academic Achievement
Academic Achievement measures the content knowledge
students have in language arts literacy and math. For
elementary and middle schools, this includes measures of
the school's proficiency rate on both the Language Arts
Literacy and Math sections of the New Jersey Assessment
of Skills and Knowledge (NJ ASK). A proficiency rate is
calculated by summing the count of students who scored
either proficient or advanced proficient on the assessment
and dividing by the count of valid test scores.
College and Career readiness measures the degree to
which students are demonstrating behaviors that are
indicative of future attendance and/or success in college
and careers. For all elementary and middle schools, this
includes a measurement of how many students are
chronically absent. For schools with middle school
grades, it also includes a measurement of how many
students take Algebra I in eighth grade.
This school outperforms 37% of schools statewide as noted
by its statewide percentile and 42% of schools educating
students with similar demographic characteristics as noted in
its peer school percentile in the performance area of College
and Career Readiness. Additionally, this school is meeting
50% of its performance targets in the area of College and
Career Readiness.
College and Career Readiness
This school outperforms 81% of schools statewide as noted
by its statewide percentile and 92% of schools educating
students with similar demographic characteristics as noted in
its peer school percentile in the performance area of Student
Growth. Additionally, this school is meeting 100%
percentage of its performance targets in the area of Student
Growth.
Student Growth
Student Growth measures the performance of students
from one year to the next on the New Jersey
Assessment of Skills and Knowledge (NJ ASK) in
Language Arts Literacy and Math when compared to
students with a similar history of performance on
NJASK.
Academic Achievement
College and Career Readiness
Student Growth
90%
50%
100%
42
92
37
81
Performance Areas Peer Percentile
94 71
Statewide Percentile Percent of
Targets Met
2. GRADE SPAN
2
2
2013-14
OCEAN CITY INTERMEDIATE SCHOOL
09-3780-060
CAPE MAY
OCEAN CITY 04-08
19TH STREET & BAY AVE
OCEAN CITY, NJ 08226
DEMOGRAPHIC INFORMATION
State of New Jersey
DISABILITY ECONDIS LEP
PercentofEnrollment
0
5
10
15
20
25
30
35
31
19
32
15
0
15
0
23
0
2011-12
2012-13
2013-14
Enrollment Trends by Program Participation
Current Year Enrollment by Program Participation
Count of
Students
% of
Enrollment
2013-2014
Economically Disadvantaged
Students
0
156
0.0%
31.3%
Students with Disability 15%75
Limited English Proficient
Students
2013-14 Percent
Spanish 5.2%
Chinese 0.4%
German 0.2%
Language Diversity
This table presents the percentage of students who
primarily speak each language in their home.
English 94.2%
2011-12 2012-13 2013-14
Total School Enrollment Trends
EnrollmentCount
0
100
200
300
400
500
106
104
84
101
87
94
84
79
102
98
8
106
104
100
80
15
104
UG
08
07
06
05
04
Enrollment by Grade
This graph presents the count of students who were 'on roll' by
grade in October of each school year.
Total School Enrollment
4702011-12
4872012-13
4992013-14
Note: "UG" represents the count of students who are 'on
roll' in this school but who are educated in ungraded
classrooms, meaning that the classrooms may contain
students from multiple grade levels.
Pacific
1.0%
Indian
0.2%
2.2%
11.0%
5.4%
White
80.2%
White
Black
Hispanic
Asian
American Indian
Pacific Islander
Two or More Races
Enrollment by Ethnic/Racial Subgroup
This graph presents the percentages of enrollment for each
subgroup defined by the No Child Left Behind Act of 2001
2011-12 2012-13 2013-14
0
40
80
120
160
200
240
280
Male
Female
Enrollment by Gender
This graph presents the count of students by gender who were 'on roll' in
October of each school year.
2352011-12
2472012-13
2582013-14
235
240
241
Male Female
3. GRADE SPAN
3
2013-14
OCEAN CITY INTERMEDIATE SCHOOL
09-3780-060
CAPE MAY
OCEAN CITY 04-08
19TH STREET & BAY AVE
OCEAN CITY, NJ 08226
ACADEMIC ACHIEVEMENT
State of New Jersey
Academic Achievement measures the content knowledge students have in language arts literacy and math. In elementary and
middle school, this includes the outcomes of the New Jersey Assessment of Skills and Knowledge (NJASK). The first column -
Schoolwide Performance - in the table below includes measures of the total schoolwide proficiency rate in both language arts literacy
and math. The second column - Peer School Percentile - indicates where the school’s proficiency rate compares to its group of peer
schools. For example, a school that has a peer school percentile rank of 65 has a proficiency rate that is higher than 65% of its peer
schools. The third column - Statewide Percentile - indicates where the school’s proficiency rate compares to schools across the state.
For example, a school that has a statewide percentile of 30 has a proficiency rate that is higher than 30% of all schools with NJASK
scores statewide. The last column - Percent of Targets Met - presents the percentage of progress targets met as defined by the
NJDOE’s NCLB waiver.
The Summary row presents the averages of the peer school percentiles, the average of statewide percentiles and the percentage
of statewide targets met.
85%
77%
94 71
80%
100%
90%
91 64
7797
Academic Achievement Indicators
Schoolwide
Performance
State
Percentile
Percent of Targets
Met
NJASK Math Proficiency and above
SUMMARY - Academic Achievement
Peer
Percentile
NJASK Language Arts Proficiency and above
YES*438
YES*352
---
YES*52
---
---
---
NO60
---
YES*117
NCLB Progress Targets - Language Arts Literacy
This table presents the Progress Targets as uniquely calculated for each
subgroup in each school under NJDOE’s NCLB waiver. The methodology
- as defined by the United States Department of Education - is calculated so
that each subgroup will halve the gap between their 2011 proficiency rate
and 100% proficiency by 2017.
Schoolwide
White
Black
Hispanic
American Indian
Asian
Two or More Races
Students with Disability
Limited English Proficient
Students
Economically
Disadvantaged Students
YES* = Met Progress Target(Confidence Interval Applied)
78.876.5
82.180.4
-
65.663.4
-
-
-
5933.3
-
63.559
Met
Target?
TargetPass
Rate
Total Valid
Scores
Subgroups
Data is presented for subgroups when the count is high enough under
NCLB suppression rules.
2010-11 2011-12 2012-13 2013-14
0
20
40
60
80
100100
1111
61
24
59
30
711
2828
65
64
Advanced Proficient Proficient
Partially Proficient
Proficiency Trends - Language Arts Literacy
This graph presents the percentage of students who scored in
the Advanced Proficient, Proficient and Partially Proficient
categories of the statewide Language Arts Literacy assessment
over the prior four years.
4. GRADE SPAN
4
2013-14
OCEAN CITY INTERMEDIATE SCHOOL
09-3780-060
CAPE MAY
OCEAN CITY 04-08
19TH STREET & BAY AVE
OCEAN CITY, NJ 08226
ACADEMIC ACHIEVEMENT
State of New Jersey
2010-11 2011-12 2012-13 2013-14
0
20
40
60
80
100100
4441
46
15
40
19
4035
1719
4043
Advanced Proficient Proficient
Partially Proficient
Proficiency Trends - Math
This graph presents the percentage of students who scored in
the Advanced Proficient, Proficient and Partially Proficient
categories of the statewide Math assessment over the prior four
years.
NCLB Progress Targets - Math
This table presents the Progress Targets as uniquely calculated for each
subgroup in each school under NJDOE’s NCLB waiver. The methodology
- as defined by the United States Department of Education - is calculated so
that each subgroup will halve the gap between their 2011 proficiency rate
and 100% proficiency by 2017.
YES* = Met Progress Target(Confidence Interval Applied)
Data is presented for subgroups when the count is high enough under
NCLB suppression rules.
YES*438 84.7
YES*352 88.1
--- -
YES52 75
--- -
--- -
--- -
YES*60 55
--- -
YES117 75.2
Met
Target?
TargetPass
Rate
Total Valid
Scores
Subgroups
86
89.3
75
66.3
72.6
Schoolwide
White
Black
Hispanic
American Indian
Asian
Two or More Races
Students with Disability
Limited English Proficient
Students
Economically
Disadvantaged Students
5. GRADE SPAN
5
2013-14
OCEAN CITY INTERMEDIATE SCHOOL
09-3780-060
CAPE MAY
OCEAN CITY 04-08
19TH STREET & BAY AVE
OCEAN CITY, NJ 08226
ACADEMIC ACHIEVEMENT
State of New Jersey
NJASK Results - Language Arts Literacy Grade Level - 04
This table presents the grade level proficiency results, as measured by
NJASK, in Advanced Proficient, Proficient, and Partially Proficient
categories for all appropriate subgroups.
Data is presented for subgroups when the count is high enough under
NCLB suppression rules.
NJASK Results - Language Arts Literacy Grade Level - 05
This table presents the grade level proficiency results, as measured by
NJASK, in Advanced Proficient, Proficient, and Partially Proficient
categories for all appropriate subgroups.
Data is presented for subgroups when the count is high enough under
NCLB suppression rules.
Proficient
Proficient
37%61%1%
33%65%1%
---
---
---
---
---
---
---
57%39%4%
31%64%6%
21%73%6%
---
53%47%0%
---
---
---
77%23%0%
---
56%44%0%
Partially
Proficient
Subgroups
Partially
Proficient
Subgroups
Advanced
Proficient
Schoolwide
White
Black
Hispanic
American Indian
Asian
Two or More Races
Students with Disability
Limited English Proficient Students
Economically Disadvantaged
Students
Advanced
Proficient
Schoolwide
White
Black
Hispanic
American Indian
Asian
Two or More Races
Students with Disability
Limited English Proficient Students
Economically Disadvantaged
Students
2010-11 2012-13 2013-14
0
20
40
60
80
100100
9
62 51
40
15
3733
61
Advanced Proficient Proficient
Partially Proficient
2010-11 2011-12 2012-13 2013-14
0
20
40
60
80
100100 63
48
31
62
34
31
39
51
64
59
Advanced Proficient Proficient
Partially Proficient
NJASK Proficiency Trends - Language Arts Literacy -
Grade Level - 04
This graph presents the grade level outcomes in the categories
of Advanced Proficient, Proficient, and Partially Proficient
over the last four years.
NJASK Proficiency Trends - Language Arts Literacy -
Grade Level - 05
This graph presents the grade level outcomes in the categories
of Advanced Proficient, Proficient, and Partially Proficient
over the last four years.
6. GRADE SPAN
6
2013-14
OCEAN CITY INTERMEDIATE SCHOOL
09-3780-060
CAPE MAY
OCEAN CITY 04-08
19TH STREET & BAY AVE
OCEAN CITY, NJ 08226
ACADEMIC ACHIEVEMENT
State of New Jersey
NJASK Results - Language Arts Literacy Grade Level - 06
This table presents the grade level proficiency results, as measured by
NJASK, in Advanced Proficient, Proficient, and Partially Proficient
categories for all appropriate subgroups.
Data is presented for subgroups when the count is high enough under
NCLB suppression rules.
NJASK Results - Language Arts Literacy Grade Level - 07
This table presents the grade level proficiency results, as measured by
NJASK, in Advanced Proficient, Proficient, and Partially Proficient
categories for all appropriate subgroups.
Data is presented for subgroups when the count is high enough under
NCLB suppression rules.
Proficient
Proficient
16%72%12%
14%71%14%
---
---
---
---
---
---
---
21%75%4%
22%55%23%
16%57%27%
---
38%54%8%
---
---
---
56%44%0%
---
43%50%7%
Partially
Proficient
Subgroups
Partially
Proficient
Subgroups
Advanced
Proficient
Schoolwide
White
Black
Hispanic
American Indian
Asian
Two or More Races
Students with Disability
Limited English Proficient Students
Economically Disadvantaged
Students
Advanced
Proficient
Schoolwide
White
Black
Hispanic
American Indian
Asian
Two or More Races
Students with Disability
Limited English Proficient Students
Economically Disadvantaged
Students
2010-11 2011-12 2012-13 2013-14
0
20
40
60
80
100100
12
4
67
16
50
46
54
2429
72
71
Advanced Proficient Proficient
Partially Proficient
2010-11 2011-12 2012-13 2013-14
0
20
40
60
80
100100
23
16
60
22
55
28
1312
2828
55
59
Advanced Proficient Proficient
Partially Proficient
NJASK Proficiency Trends - Language Arts Literacy -
Grade Level - 06
This graph presents the grade level outcomes in the categories
of Advanced Proficient, Proficient, and Partially Proficient
over the last four years.
NJASK Proficiency Trends - Language Arts Literacy -
Grade Level - 07
This graph presents the grade level outcomes in the categories
of Advanced Proficient, Proficient, and Partially Proficient
over the last four years.
7. GRADE SPAN
7
2013-14
OCEAN CITY INTERMEDIATE SCHOOL
09-3780-060
CAPE MAY
OCEAN CITY 04-08
19TH STREET & BAY AVE
OCEAN CITY, NJ 08226
ACADEMIC ACHIEVEMENT
State of New Jersey
NJASK Results - Language Arts Literacy Grade Level - 08
This table presents the grade level proficiency results, as measured by
NJASK, in Advanced Proficient, Proficient, and Partially Proficient
categories for all appropriate subgroups.
Data is presented for subgroups when the count is high enough under
NCLB suppression rules.
Proficient
13%75%13%
14%73%13%
---
8%83%8%
---
---
---
57%43%0%
---
24%71%6%
Partially
Proficient
Subgroups
Advanced
Proficient
Schoolwide
White
Black
Hispanic
American Indian
Asian
Two or More Races
Students with Disability
Limited English Proficient Students
Economically Disadvantaged
Students
2010-11 2011-12 2012-13 2013-14
0
20
40
60
80
100100
13
21
65
13
66
14
8
26
98
7583
Advanced Proficient Proficient
Partially Proficient
NJASK Proficiency Trends - Language Arts Literacy -
Grade Level - 08
This graph presents the grade level outcomes in the categories
of Advanced Proficient, Proficient, and Partially Proficient
over the last four years.
The National Assessment of Educational Progress (NAEP) is the largest national assessment of what our nation’s students know and
can do. NAEP assesses fourth-, eighth-, and twelfth-grade students in subjects such as reading, mathematics, science, and writing. The
reporting of NAEP scores on state report cards is a federal mandate. The results of NAEP are also published as the Nation’s Report
Card, and are available for the nation, states, and, in some cases, urban districts. The NAEP scores on the report card include grades
four and eight 2013 reading and math scores for New Jersey which are the last scores published. For subgroup outcomes, visit :
For more information, visit <http://nces.ed.gov/nationsreportcard/>http://www.nj.gov/education/pr/1314/naep/naep8read.html
2013 National Assessment Educational Progress (NAEP)
Below Basic Basic AdvancedGrade 8 Reading Proficient
Nation 22 42 32 4
State/Nation
All Students
State (NJ) 15 39 40 7All Students
The National Assessment of Educational Progress (NAEP) is the largest national assessment of what our nation’s students know and
can do. NAEP assesses fourth-, eighth-, and twelfth-grade students in subjects such as reading, mathematics, science, and writing. The
reporting of NAEP scores on state report cards is a federal mandate. The results of NAEP are also published as the Nation’s Report
Card, and are available for the nation, states, and, in some cases, urban districts. The NAEP scores on the report card include grades
four and eight 2013 reading and math scores for New Jersey which are the last scores published. For subgroup outcomes, visit :
25 33 12
32 33 8
2013 National Assessment Educational Progress (NAEP)
For more information, visit <http://nces.ed.gov/nationsreportcard/>
Below Basic Basic Proficient AdvancedGrade 4 Reading
All Students State (NJ) 30
All Students Nation 27
http://www.nj.gov/education/pr/1314/naep/naep4read.html
State/Nation
8. GRADE SPAN
8
2013-14
OCEAN CITY INTERMEDIATE SCHOOL
09-3780-060
CAPE MAY
OCEAN CITY 04-08
19TH STREET & BAY AVE
OCEAN CITY, NJ 08226
ACADEMIC ACHIEVEMENT
State of New Jersey
NJASK Results - MATH Grade Level - 04
This table presents the grade level proficiency results, as measured by
NJASK, in Advanced Proficient, Proficient, and Partially Proficient
categories for all appropriate subgroups.
Data is presented for subgroups when the count is high enough under
NCLB suppression rules.
This table presents the grade level proficiency results, as measured by
NJASK, in Advanced Proficient, Proficient, and Partially Proficient
categories for all appropriate subgroups.
Data is presented for subgroups when the count is high enough under
NCLB suppression rules.
55%
62%
-
-
-
-
-
-
-
30%
40%
48%
-
13%
-
-
-
23%
-
8%
Partially
ProficientSubgroups
NJASK Results - MATH Grade Level - 05
Partially
ProficientSubgroups
12%33%
9%29%
--
--
--
--
--
--
--
22%48%
15%45%
12%39%
--
13%73%
--
--
--
23%54%
--
24%68%
Proficient
Advanced
Proficient
Schoolwide
White
Black
Hispanic
American Indian
Asian
Two or More Races
Students with Disability
Limited English Proficient Students
Economically Disadvantaged Students
Proficient
Advanced
Proficient
Schoolwide
White
Black
Hispanic
American Indian
Asian
Two or More Races
Students with Disability
Limited English Proficient Students
Economically Disadvantaged Students
2010-11 2012-13 2013-14
0
20
40
60
80
100100
45
46
38
17
55
37
1217
33
Advanced Proficient Proficient
Partially Proficient
2010-11 2011-12 2012-13 2013-14
0
20
40
60
80
100100
4046
46
15
40
14
48
38
1216
45
40
Advanced Proficient Proficient
Partially Proficient
NJASK Proficiency Trends - Math - Grade Level - 04
This graph presents the grade level outcomes in the categories
of Advanced Proficient, Proficient, and Partially Proficient
over the last four years.
NJASK Proficiency Trends - Math - Grade Level - 05
This graph presents the grade level outcomes in the categories
of Advanced Proficient, Proficient, and Partially Proficient
over the last four years.
9. GRADE SPAN
9
2013-14
OCEAN CITY INTERMEDIATE SCHOOL
09-3780-060
CAPE MAY
OCEAN CITY 04-08
19TH STREET & BAY AVE
OCEAN CITY, NJ 08226
ACADEMIC ACHIEVEMENT
State of New Jersey
NJASK Results - MATH Grade Level - 06
This table presents the grade level proficiency results, as measured by
NJASK, in Advanced Proficient, Proficient, and Partially Proficient
categories for all appropriate subgroups.
Data is presented for subgroups when the count is high enough under
NCLB suppression rules.
This table presents the grade level proficiency results, as measured by
NJASK, in Advanced Proficient, Proficient, and Partially Proficient
categories for all appropriate subgroups.
Data is presented for subgroups when the count is high enough under
NCLB suppression rules.
48%
52%
-
-
-
-
-
-
-
38%
35%
44%
-
8%
-
-
-
11%
-
18%
Partially
ProficientSubgroups
NJASK Results - MATH Grade Level - 07
Partially
ProficientSubgroups
8%44%
6%41%
--
--
--
--
--
--
--
8%54%
26%39%
17%39%
--
54%38%
--
--
--
67%22%
--
43%39%
Proficient
Advanced
Proficient
Schoolwide
White
Black
Hispanic
American Indian
Asian
Two or More Races
Students with Disability
Limited English Proficient Students
Economically Disadvantaged Students
Proficient
Advanced
Proficient
Schoolwide
White
Black
Hispanic
American Indian
Asian
Two or More Races
Students with Disability
Limited English Proficient Students
Economically Disadvantaged Students
2010-11 2011-12 2012-13 2013-14
0
20
40
60
80
100100
48
34
57
8
46
20
37
27
1316
44
51
Advanced Proficient Proficient
Partially Proficient
2010-11 2011-12 2012-13 2013-14
0
20
40
60
80
100100
35
27
47
26
46
27
3328
2724
3941
Advanced Proficient Proficient
Partially Proficient
NJASK Proficiency Trends - Math - Grade Level - 06
This graph presents the grade level outcomes in the categories
of Advanced Proficient, Proficient, and Partially Proficient
over the last four years.
NJASK Proficiency Trends - Math - Grade Level - 07
This graph presents the grade level outcomes in the categories
of Advanced Proficient, Proficient, and Partially Proficient
over the last four years.
10. GRADE SPAN
10
2013-14
OCEAN CITY INTERMEDIATE SCHOOL
09-3780-060
CAPE MAY
OCEAN CITY 04-08
19TH STREET & BAY AVE
OCEAN CITY, NJ 08226
ACADEMIC ACHIEVEMENT
State of New Jersey
NJASK Results - MATH Grade Level - 08
This table presents the grade level proficiency results, as measured by
NJASK, in Advanced Proficient, Proficient, and Partially Proficient
categories for all appropriate subgroups.
Data is presented for subgroups when the count is high enough under
NCLB suppression rules.
45%
47%
-
25%
-
-
-
7%
-
29%
Partially
ProficientSubgroups
14%42%
14%39%
--
8%67%
--
--
--
57%36%
--
24%47%
Proficient
Advanced
Proficient
Schoolwide
White
Black
Hispanic
American Indian
Asian
Two or More Races
Students with Disability
Limited English Proficient Students
Economically Disadvantaged Students
2010-11 2011-12 2012-13 2013-14
0
20
40
60
80
100100
45
53
38
14
29
18
3943
1619
42
45
Advanced Proficient Proficient
Partially Proficient
NJASK Proficiency Trends - Math - Grade Level - 08
This graph presents the grade level outcomes in the categories
of Advanced Proficient, Proficient, and Partially Proficient
over the last four years.
The National Assessment of Educational Progress (NAEP) is the largest national assessment of what our nation’s students know and can
do. NAEP assesses fourth-, eighth-, and twelfth-grade students in subjects such as reading, mathematics, science, and writing. The
reporting of NAEP scores on state report cards is a federal mandate. The results of NAEP are also published as the Nation’s Report Card,
and are available for the nation, states, and, in some cases, urban districts. The NAEP scores on the report card include grades four and
eight 2013 reading and math scores for New Jersey which are the last scores published. For subgroup outcomes, visit :
13 38 10
17 41 8
For more information, visit <http://nces.ed.gov/nationsreportcard/>http://www.nj.gov/education/pr/1314/naep/naep4math.html
2013 National Assessment Educational Progress (NAEP)
Below Basic Basic AdvancedGrade 4 Math
All Students Nation 34
ProficientState/Nation
All Students State (NJ) 39
The National Assessment of Educational Progress (NAEP) is the largest national assessment of what our nation’s students know and can
do. NAEP assesses fourth-, eighth-, and twelfth-grade students in subjects such as reading, mathematics, science, and writing. The
reporting of NAEP scores on state report cards is a federal mandate. The results of NAEP are also published as the Nation’s Report Card,
and are available for the nation, states, and, in some cases, urban districts. The NAEP scores on the report card include grades four and
eight 2013 reading and math scores for New Jersey which are the last scores published.For subgroup outcomes, visit :
18 34 16
26 38 9
For more information, visit <http://nces.ed.gov/nationsreportcard/>
2013 National Assessment Educational Progress (NAEP)
Below Basic Basic AdvancedGrade 8 Math
All Students Nation 27
http://www.nj.gov/education/pr/1314/naep/naep8math.html
State/Nation Proficient
All Students State (NJ) 33
11. GRADE SPAN
11
2013-14
OCEAN CITY INTERMEDIATE SCHOOL
09-3780-060
CAPE MAY
OCEAN CITY 04-08
19TH STREET & BAY AVE
OCEAN CITY, NJ 08226
ACADEMIC ACHIEVEMENT
State of New Jersey
Data is presented for subgroups when the count is high enough under
NCLB suppression rules.
Data is presented for subgroups when the count is high enough under
NCLB suppression rules.
This table presents the grade level proficiency results, as measured by
NJASK, in Advanced Proficient, Proficient, and Partially Proficient
categories for all appropriate subgroups.
NJASK Results - Science Grade Level - 04
This table presents the grade level proficiency results, as measured by
NJASK, in Advanced Proficient, Proficient, and Partially Proficient
categories for all appropriate subgroups.
NJASK Results - Science Grade Level - 08
2%35%63%
1%30%68%
---
---
---
---
---
---
---
9%43%48%
23%56%21%
22%58%20%
---
33%42%25%
---
---
---
71%29%0%
---
29%47%24%
Partially
Proficient
Advanced
Proficient
Subgroups
Partially
Proficient
Advanced
Proficient
Subgroups
Proficient
Schoolwide
White
Black
Hispanic
American Indian
Asian
Two or More Races
Students with Disability
Limited English Proficient
Students
Economically Disadvantaged
Students
Proficient
Schoolwide
White
Black
Hispanic
American Indian
Asian
Two or More Races
Students with Disability
Limited English Proficient
Students
Economically Disadvantaged
Students
2010-11 2012-13 2013-14
0
20
40
60
80
100100
55
31
35
10
6361
28
35
Advanced Proficient Proficient
Partially Proficient
2010-11 2011-12 2012-13 2013-14
0
20
40
60
80
100100
21
49
53
23
40
12
3538
129
56
53
Advanced Proficient Proficient
Partially Proficient
This graph presents the grade level outcomes in the categories
of Advanced Proficient, Proficient, and Partially Proficient
over the last four years.
NJASK Proficiency Trends - Science - Grade Level - 04
This graph presents the grade level outcomes in the categories
of Advanced Proficient, Proficient, and Partially Proficient
over the last four years.
NJASK Proficiency Trends - Science - Grade Level - 08
3
12. GRADE SPAN
12
2013-14
OCEAN CITY INTERMEDIATE SCHOOL
09-3780-060
CAPE MAY
OCEAN CITY 04-08
19TH STREET & BAY AVE
OCEAN CITY, NJ 08226
COLLEGE AND CAREER READINESS
State of New Jersey
Students in both elementary and middles schools begin to demonstrate college readiness behaviors long before they even enter
high school. Among the behaviors that research has shown to be indicative of success and college and career readiness are regularly
attending school and challenging themselves with rigorous course work. First, the table presents the percentage of students, as
measured against the school’s enrollment in eighth grade, who were reported via NJSMART as being enrolled in Algebra I. The table
also presents the percentage of students who were chronically absent during the prior school year. A chronically absent student is a
student who was not present for any reason for 10% or more of the total days possible for that individual student.
The first column - Schoolwide Performance - represents the outcomes for these particular indicators in this school. The second
column - Peer School Percentile - indicates how the school’s performance compares to its group of peer schools. For example, a school
whose peer school is 65 in Algebra I Enrollment has a higher Algebra I Enrollment than 65% of its peer group. The third column -
Statewide Percentile - indicates how the school’s performance compares to schools across the state. The fourth column - Statewide
Target - provides the statewide targets for each of these indicators. The last column - Met Target? - indicates whether the School
Performance met or exceeded the statewide target.
The Summary row presents the averages of the peer school percentiles, the average of statewide percentiles and the percentage
of statewide targets met.
This table presents the percentage of eighth graders who
were reported in the Algebra I course code in NJSMART
and the percentage of those students who earned a C or
higher in the course.
Algebra I Absenteeism
The chart below presents the percentage of students who were
absent in each category of absence: 0 absences, 1- 5 absences,
6 - 10 absences, 11 - 15 absences, and more than 15 absences.
An absence is defined as being ‘not present’ and includes the
days missed regardless of whether they were determined to be
excused or unexcused by the school.
Chronic Absenteeism (%)
Students taking Algebra (%)
Algebra grade (C or better)
Students taking Algebra I
Summary
22%
100%
39 40
3742
22%
45 34 NO
20%
6%
YES
50%
9%
Met Target?Statewide
Target
Peer
Percentile
Statewide
Percentile
School
Performance
College and Career Readiness
Indicators
2013-14 School
2012-13 2013-14
DATA_YEAR
PercentStudentsChronicallyAbsent(%)
0
5
10
15
20
25
30
9.0
30.0
Chronic Absenteeism Trend
This graph presents the percentage of the enrolled students who
were chronically absent for the past two years.
0 Absences 1-5 Absences 6-10 Absences 11-15 Absences 15+ Absences
Absences
PercentAbsent
0
5
10
15
20
25
30
35
21
31
29
5
15
0 Absences 1-5 Absences 6-10 Absences
11-15 Absences 15+ Absences
13. GRADE SPAN
13
2013-14
OCEAN CITY INTERMEDIATE SCHOOL
09-3780-060
CAPE MAY
OCEAN CITY 04-08
19TH STREET & BAY AVE
OCEAN CITY, NJ 08226
STUDENT GROWTH
State of New Jersey
This section of the performance report presents data about student growth, utilizing the Student Growth Percentile
Methodology (SGP). SGP creates a measure of how students progressed in grades 4 through 8 in NJ ASK Language Arts
Literacy and Math when compared to other students with a similar NJ ASK test score history. A short video explaining the
methodology can be found here: http://www.state.nj.us/education/njsmart/performance/
The first column - Schoolwide Performance - presents the schoolwide median growth score in either Language Arts
Literacy or Math for all students in the school. The second column - Peer Percentile - indicates how the school’s growth
performance compares to its group of peer schools. The third column - Statewide Percentile - indicates how a school compares
to schools across the state. The last column - Met Target? - indicates whether the school’s performance met or exceeded the
target.
The summary row presents the averages of the peer school percentiles, the averages of statewide percentiles, the
percentage of statewide targets met.
This table presents for all students with growth scores the interaction between their proficiency level on NJASK and their growth
scores. For example, in the top left cell the percentage of students who are both partially proficient AND also demonstrating low
growth is displayed.
Low Growth is defined as an Student Growth Percentile score less than 35.
Typical Growth is defined as an Student Growth Percentile score between 35 and 65.
High Growth is defined as a Student Growth Percentile score higher than 65.
8192
59
55
100
84
92
69
100%
35
35
Met Target?Statewide
Target
Peer
Percentile
Schoolwide
Performance
Student Growth on Math
Student Growth on Language Arts
Student Growth Indicators
Student Growth
Language Arts Math
GROWTH
Advanced
Proficient
GROWTH
1% 2% 8%
4%7%12%
22%14%8%
12% 15%14%
3%5%7%
YES
YES
Statewide
Percentile
Proficient
Partially
Proficient
Advanced
Proficient
12% 25% 29%Proficient
HighLow
Partially
Proficient
HighLow TypicalTypical
5
14. GRADE SPAN
14
2013-14
OCEAN CITY INTERMEDIATE SCHOOL
09-3780-060
CAPE MAY
OCEAN CITY 04-08
19TH STREET & BAY AVE
OCEAN CITY, NJ 08226
WITHIN SCHOOL ACHIEVEMENT GAP
State of New Jersey
Grade Level - 04 Grade Level - 04
Grade Level - 05 Grade Level - 05
This section of the performance report presents data about the achievement gap that exists within a school - as measured
by the difference between the students’ scale scores at the 25th and 75th percentile in the school, the so-called Interquartile
Range (IQR). Taken together with an understanding of the overall and average achievement levels in the school, the IQR furthers
an understanding of the range of student outcomes that exist in a school. A school gap smaller than the state gap indicates that
the school’s range of student outcomes is narrower than the state’s while a school gap larger than the state gap indicates that the
school’s range of student outcomes is larger than the state’s.
NJ ASK Language Arts 25th %ile vs 75th%ile NJ ASK Math 25th %ile vs 75th%ile
This table presents the scale scores associated with students
at the bottom (0th percentile), the 25th percentile, the 50th
percentile, the 75th percentile and the top (99th percentile)
of school's distribution.
This table presents the scale scores associated with students
at the bottom (0th percentile), the 25th percentile, the 50th
percentile, the 75th percentile and the top (99th percentile) of
school's distribution.
26 5733 69
157
189
202
215
242 300
273
250
216
141100
186
202
219
300
100
195
228
264
300
30 5338 56
155
191
208
221
251 300
262
235
209
163100
186
206
224
300
100
206
235
262
300
0th
25th
50th
75th
99th
Percentile
0th
25th
50th
75th
99th
Scale Score Gap -
State
25th vs 75th Gap
Scale Score Gap -
State
State Scale Score
0th
25th
50th
75th
99th
Percentile
0th
25th
50th
75th
99th
Scale Score Gap -
State
25th vs 75th Gap
Scale Score Gap -
State
State Scale Score
Scale Score Gap -
School
25th vs 75th Gap
Scale Score Gap -
School
Scale Score Gap -
School
25th vs 75th Gap
Scale Score Gap -
School
Percentile School Scale Score School Scale Score State Scale Score
Percentile School Scale Score School Scale Score State Scale Score
15. GRADE SPAN
15
2013-14
OCEAN CITY INTERMEDIATE SCHOOL
09-3780-060
CAPE MAY
OCEAN CITY 04-08
19TH STREET & BAY AVE
OCEAN CITY, NJ 08226
WITHIN SCHOOL ACHIEVEMENT GAP
State of New Jersey
Grade Level - 06 Grade Level - 06
Grade Level - 07 Grade Level - 07
NJ ASK Language Arts 25th %ile vs 75th%ile NJ ASK Math 25th %ile vs 75th%ile
This table presents the scale scores associated with students
at the bottom (0th percentile), the 25th percentile, the 50th
percentile, the 75th percentile and the top (99th percentile)
of school's distribution.
This table presents the scale scores associated with students
at the bottom (0th percentile), the 25th percentile, the 50th
percentile, the 75th percentile and the top (99th percentile) of
school's distribution.
29 4638 58
147
206
218
235
278 300
264
242
218
170100
192
211
230
300
100
201
228
259
300
41 5346 66
156
205
227
246
290 300
252
225
199
141100
188
211
234
300
100
184
214
250
300
0th
25th
50th
75th
99th
Percentile
0th
25th
50th
75th
99th
Scale Score Gap -
State
25th vs 75th Gap
Scale Score Gap -
State
State Scale Score
0th
25th
50th
75th
99th
Percentile
0th
25th
50th
75th
99th
Scale Score Gap -
State
25th vs 75th Gap
Scale Score Gap -
State
State Scale Score
Scale Score Gap -
School
25th vs 75th Gap
Scale Score Gap -
School
Scale Score Gap -
School
25th vs 75th Gap
Scale Score Gap -
School
Percentile School Scale Score School Scale Score State Scale Score
Percentile School Scale Score School Scale Score State Scale Score
16. GRADE SPAN
16
2013-14
OCEAN CITY INTERMEDIATE SCHOOL
09-3780-060
CAPE MAY
OCEAN CITY 04-08
19TH STREET & BAY AVE
OCEAN CITY, NJ 08226
WITHIN SCHOOL ACHIEVEMENT GAP
State of New Jersey
Grade Level - 08 Grade Level - 08
NJ ASK Language Arts 25th %ile vs 75th%ile NJ ASK Math 25th %ile vs 75th%ile
This table presents the scale scores associated with students
at the bottom (0th percentile), the 25th percentile, the 50th
percentile, the 75th percentile and the top (99th percentile)
of school's distribution.
This table presents the scale scores associated with students
at the bottom (0th percentile), the 25th percentile, the 50th
percentile, the 75th percentile and the top (99th percentile) of
school's distribution.
24 5734 67
161
214
226
238
270 300
270
238
213
157100
204
221
238
300
100
192
227
259
300
0th
25th
50th
75th
99th
Percentile
0th
25th
50th
75th
99th
Scale Score Gap -
State
25th vs 75th Gap
Scale Score Gap -
State
State Scale Score
Scale Score Gap -
School
25th vs 75th Gap
Scale Score Gap -
School
Percentile School Scale Score School Scale Score State Scale Score
17. 7
GRADE SPAN
17
2013-14
OCEAN CITY INTERMEDIATE SCHOOL
09-3780-060
CAPE MAY
OCEAN CITY 04-08
19TH STREET & BAY AVE
OCEAN CITY, NJ 08226
SCHOOL CLIMATE
State of New Jersey
This table presents the amount of time
that a typical student is engaged in
instructional activities under the
supervision of a certified teacher.
Length of School Day Instructional Time
Student Suspension Rate Student Expulsions
Student to Staff Ratio
This table presents the amount of time a
school is in session for a typical student on a
normal school day.
This table presents the percentage of students
who were suspended one or more times
during the school year.
This table presents the number of students
who were expelled from the school and
district during the school year.
This table presents the count of students per
faculty member or administrator in the school.
All staff are counted in full-time equivalents.
School
School
School
Faculty
Administrators
1.2%
10
499
0
6 Hrs. 10 Mins.
0 Hrs. 0 Mins.
6 Hrs. 40 Mins.2013-14
2013-14
2013-14
2013-14
2013-14
School
Full Time
Shared Time
School
18. 18
CUMBERLAND
CUMBERLAND
CUMBERLAND
This table presents the list of peer schools in alphabetical order by county name that was created specifically for this school
(highlighted in yellow). Peer schools are drawn from across the state and represent schools that have similar grade configurations
and that are educating students of similar demographic characteristics, as measured by enrollment in Free/Reduced Lunch
Programs, Limited English Proficiency or Special Education Programs.
SCHOOL NAMEDISTRICT NAMECOUNTY NAME
FRPL LEP SpED
06-08ATLANTIC 47.2% 1.7% 11.3%
06-08ATLANTIC 46.5% 2.1% 9.3%
06-08BERGEN 44.6% 2.4% 15.2%
06-08BERGEN 47.4% 4.0% 17.8%
04-08BURLINGTON 31.9% 0.4% 13.4%
06-08CAMDEN 32.6% 1.0% 20.5%
06-08CAMDEN 34.8% 0.0% 12.0%
06-08CAMDEN 30.7% 0.0% 16.4%
PK-08CAMDEN 39.7% 1.0% 14.9%
PK-08CAMDEN 37.9% 1.7% 17.1%
04-08CAPE MAY 31.3% 0.0% 14.8%
PK-08CHARTERS 35.3% 0.0% 8.7%
PK-08 54.1% 3.5% 11.8%
KG-08 37.3% 0.0% 7.6%
06-08 54.5% 4.5% 18.3%
07-08ESSEX 42.0% 3.4% 19.1%
07-08ESSEX 39.4% 2.3% 19.0%
05-08GLOUCESTER 32.2% 0.1% 17.0%
PK-08HUDSON 48.3% 0.7% 0.2%
PK-08HUDSON 67.7% 5.6% 8.6%
PK-08HUDSON 61.2% 5.0% 10.9%
PK-08HUDSON 62.8% 5.6% 12.5%
PK-08MONMOUTH 47.2% 3.3% 18.0%
PK-08MONMOUTH 32.4% 0.2% 12.9%
06-08OCEAN 33.6% 0.8% 16.3%
06-08OCEAN 40.8% 2.5% 20.7%
06-08OCEAN 30.9% 0.3% 17.1%
KG-08SALEM 33.6% 0.0% 15.3%
06-08SALEM 31.3% 0.0% 17.9%
06-08SALEM 32.7% 0.7% 18.2%
06-08UNION 39.5% 1.5% 13.6%
09-3780-060OCEAN CITY INTERMEDIATE SCHOOLSCHOOL PEER GROUP
GRAD
ESPAN
CDS
CODE
ALDER AVENUE MIDDLE SCHOOL
FERNWOOD AVENUE MIDDLE
SCHOOL
ROY W. BROWN MIDDLE SCHOOL
MEMORIAL MIDDLE SCHOOL
FLORENCE RIVERFRONT SCHOOL
JOHN A. CARUSI MIDDLE SCHOOL
ANN A. MULLEN MIDDLE SCHOOL
GLEN LANDING MIDDLE SCHOOL
MAGNOLIA
MARY E. VOLZ ELEMENTARY
SCHOOL
OCEAN CITY INTERMEDIATE
SCHOOL
LEARNING COMMUNITY CHARTER
SCHOOL
DEERFIELD TOWNSHIP SCHOOL
DISTRICT
STOW CREEK TOWNSHIP
WOODRUFF MIDDLE SCHOOL
BLOOMFIELD MIDDLE SCHOOL
ROOSEVELT MIDDLE SCHOOL
WILLIAMSTOWN MIDDLE SCHOOL
NICHOLAS ORESKO #14
JAMES F. MURRAY SCHOOL
FRANKLIN ELEMENTARY SCHOOL
LINCOLN ELEMENTARY SCHOOL
WOODROW WILSON
MEMORIAL SCHOOL
RUSSELL O. BRACKMAN MIDDLE
SCHOOL
LAKE RIVIERA MIDDLE SCHOOL
MANCHESTER TOWNSHIP MIDDLE
SCHOOL
ELSINBORO TOWNSHIP SCHOOL
PENNSVILLE MIDDLE SCHOOL
WOODSTOWN MIDDLE SCHOOL
BURNET MIDDLE SCHOOL
01-1310-038
01-1310-039
03-0300-075
03-1345-060
05-1520-055
07-0800-067
07-1780-100
07-1780-055
07-2890-050
07-4590-040
09-3780-060
80-7115-960
11-1020-040
11-5070-050
11-5300-070
13-0410-030
13-5680-090
15-3280-110
17-0220-140
17-2390-350
17-2410-070
17-3610-090
25-3500-060
25-5230-050
29-0185-050
29-0530-043
29-2940-045
33-1350-050
33-4075-055
33-5910-070
39-5290-060
EGG HARBOR TWP
EGG HARBOR TWP
BERGENFIELD BORO
ELMWOOD PARK
FLORENCE TWP
CHERRY HILL TWP
GLOUCESTER TWP
GLOUCESTER TWP
MAGNOLIA BORO
RUNNEMEDE BORO
OCEAN CITY
LEARNING COMMUNITY CS
DEERFIELD TWP
STOW CREEK TWP
UPPER DEERFIELD TWP
BLOOMFIELD TWP
WEST ORANGE TOWN
MONROE TWP
BAYONNE CITY
JERSEY CITY
KEARNY TOWN
NORTH BERGEN TWP
NEPTUNE CITY
UNION BEACH
BARNEGAT TWP
BRICK TWP
MANCHESTER TWP
ELSINBORO TWP
PENNSVILLE
WOODSTOWN-PILESGROVE
REG
UNION TWP