
Recomendados
Mais conteúdo relacionado
Mais procurados
Mais procurados (20)
Semelhante a Fatigue Analysis Report_ Final
Semelhante a Fatigue Analysis Report_ Final (20)
Fatigue Analysis Report_ Final
- 1. Fatigue Analysis Report 2011-1-0610-403-GRO1 RochesterInstitute of Technology 1 Table of Contents Executive Summary............................................................................................................................3 Hypothesis.........................................................................................................................................5 Introduction and Background.............................................................................................................5 Alternate Experiments .......................................................................................................................6 Results and Conclusion.......................................................................................................................7 Appendix A........................................................................................................................................8 Part Measurements& Initial Calculations..........................................................................................8 Appendix B........................................................................................................................................9 Initial S/N Diagram..........................................................................................................................9 CompletedPost Annealed S/N Diagram .........................................................................................11 Appendix C......................................................................................................................................13 Finite Element Analysis .................................................................................................................13 Appendix D......................................................................................................................................20 Fatigue Test..................................................................................................................................20 Pre-Annealed Fatigue Testing.....................................................................................................20 Post Annealed Fatigue Testing ...................................................................................................25 Appendix E ......................................................................................................................................28 Tensile Testing..............................................................................................................................28 Tensile Test of the pre-annealed Samples...................................................................................28 Tensile Test of the post-annealed Samples..................................................................................30 Appendix F.......................................................................................................................................32 Hardness......................................................................................................................................32 Pre Annealed Hardness Testing..................................................................................................32 Post Annealed Hardness Testing.................................................................................................34 Appendix G......................................................................................................................................36 Combustion-Infrared Absorption ...................................................................................................36 Appendix H......................................................................................................................................38 Spark Test....................................................................................................................................38
- 2. Fatigue Analysis Report 2011-1-0610-403-GRO1 RochesterInstitute of Technology 2 Appendix I.......................................................................................................................................40 Metallography..............................................................................................................................40 Pre-Annealed Metallography Test ..............................................................................................40 Post-Annealed Metallography Test.............................................................................................43 Appendix J.......................................................................................................................................45 Annealing.....................................................................................................................................45 Appendix K......................................................................................................................................46 Cost Analysis ................................................................................................................................46 Appendix L.......................................................................................................................................47 Green Belt Tools...........................................................................................................................47 Project Charter..........................................................................................................................47 Gantt chart ...............................................................................................................................49 Stages of Team Development.....................................................................................................50 PDCA........................................................................................................................................51 Process Flow Chart....................................................................................................................52 High Level SIPOC.......................................................................................................................53 Box Plot Statistics on Testing......................................................................................................54 Two Sample T-Test:Non Annealed/Annealed..............................................................................56 ANOVA .....................................................................................................................................58 Cause and Effect Fatigue Diagram ..............................................................................................60 Cause and Effect Material Diagram.............................................................................................61 C & E Checklist..........................................................................................................................62 Appendix M.....................................................................................................................................63 Meeting Notes..............................................................................................................................63 References ...................................................................................................................................65
- 3. Fatigue Analysis Report 2011-1-0610-403-GRO1 RochesterInstitute of Technology 3 Executive Summary To accurately understand the failure characteristics of materials, an investigation on 10 specimens of AISI 1018 Cold Rolled steel was undertaken. The test specimens were initially fatigue tested under fully reversed load conditions in a cantilever beam model. To begin to understand the failure characteristics the 10 specimens were stressed in a fatigue tester. Rotating at an average of 3450 rpm and loaded at one end, similar to a cantilever beam. Loads varied on a team to team basis, but were in the range of published data of AISI 1018 CRS steel’s mean strength (Sm) and Endurance Limit (Se). The loads ranged from 90N to 175N. An S-N Diagram for the material was generated based on the correction factors estimated from the published values. The completed “corrected” S-N diagram was our starting point. The S-N diagram was referenced to determine load characteristics required for the fatigue test. The 10 specimens were individually loaded into the fatigue tester. Once the machine was fully operational the load was introduced to the free end by rotating the dial knob on the machine. It took about 1000-2000 revolutions before the specimen reached the desired load value for each test run. This variation, in what should have been a constant load was negligible for the overall experiment. The trend with the load and its expected number of cycles to failure showed a much higher mean strength. This translated to a much higher Ultimate Tensile Strength being found from the test values. The results showed a nearly 29% increase compared to the expected value. The expected value was 65.3ksi and experimental value was calculated as 84.2ksi. This created many doubts as to the authenticity of the material or the process of fabrication. As a class, it was established that either the material was not actually 1018 CRS, or the fabrication process induced significant internal stresses by process of work hardening the specimen. To confirm our hypothesis of the material two groups of experiments and testing were done. One test involved the authentication of the material, while the other involved the possibility of internal stresses. In an attempt to verify the quality of output of the fatigue tester, parts of the 10 initial specimens were tensile tested. The Tensile tests results corresponded with the fatigue test giving an average Sut of 100.4ksi. The different between the results of the fatigue test and tensile test were relatively close but still substantially high compared to the critical to quality value of 65.3ksi. The results between the fatigue and tensile test were neglected, due to the bigger issue. These differences may have occurred due to specimen loading conditions, system calibration errors or other random errors.
- 4. Fatigue Analysis Report 2011-1-0610-403-GRO1 RochesterInstitute of Technology 4 To further verify the results a Rockwell Hardness test was conducted on the specimens. The hardness test results showed an average ultimate tensile strength of 98ksi. After three multiple test results, all verifying an accurate read of 80+ Sut, a spark test was performed to confirm the carbon content. A Combustion test performed by an outsourced laboratory, IMR Test Labs, also confirmed the carbon content of 1 specimen as 0.19% of weight. This test result indicted the specimens were in fact AISI 1018 Cold Rolled Steel. At this point it was clear that the only variance that had not formally been taken into account was manufacturing process. Work hardened materials deviate from most published values, as was observed through test experiments. However, this claim needed to be backed up. A metallurgical grain structure test would enable us to read the grain structure of our specimens and compare it to published data from the American Metallurgical Society. Studying the specimens under a high powered microscope, visually the data corresponded with that of published images. However, photographs were not conclusive enough, or a reliable source of data to draw any conclusion; There can be errors such as human eye errors. At this point it was verified that we know the samples were of AISI 1018 CRS. To bring the Sut down closer to its published values within 3-4% range, a set of new 1018 CRS specimens from which the same batch the original was received. These specimens were put into a furnace to undergo full annealing. Upon the completion of the annealing process, the five specimens were then re-tested for fatigue, tensile, hardness and metallurgy. The results of the post annealed specimens were found to be close to published value of 65.3ksi within 3-4%. Therefore, as hypothesized, the material of the specimens was in fact AISI 1018 Cold Rolled Steel which was induced with internal stresses. To effectively complete this project, Six Sigma tools were utilized to better define, measure, analyze, improve and control (DMAIC) the main objective and customer need which was to determine the fatigue characteristics of given samples of AISI 1018 cold rolled steel. Tools such as project plan using a Gantt chart, process flow chart, diagrams, brainstorming, PDCA, ANOVA, SIPOC, two sample T-test, box plots, and cost analysis were incorporated into the report to be better organized & utilize the DMAIC process.
- 5. Fatigue Analysis Report 2011-1-0610-403-GRO1 RochesterInstitute of Technology 5 Hypothesis After conducting the fatigue analysis experiments, we encountered a problem. The actual fatigue data was significantly higher than both the published and calculated corrected data. We suspect that the cause of this material's increase in fatigue characteristics is a result of strain hardening that occurred during the cold drawing manufacturing process of these specimens. To verify our suspicions, we will conduct a series of tests to verify the SUT of the specimens. This will ensure that there was no major error during the fatigue testing of the material. Spark and metallurgy test will be done to verify that material is actually 1018 CRS. At the completion of these tests, we should be able to conclude that the material is still in fact 1018 CRS with an increase in SUT due to strain hardening during manufacturing process of the specimens. Introductionand Background For the 2011 fall quarter Failure Mechanics class, a CTQ (Critical to Quality) was given to determine the fatigue characteristics of AISI 1018 CRS within a 99% confidence level and compare them to the published values. In the process of reaching this CTQ, Six Sigma tools were utilized. With these found fatigue characteristics, analysis were to be done to show the general applicable engineering design in terms of safety factors. The failure of materials theoretically occurs at much lower stress levels than the published values of the ultimate tensile strength (SUT). An important part of Failure Mechanics is to understand the conditions of bodies that incur alternating stresses under cyclic loading. With this understanding, predictions of failure can be achieved, and designs can be created at variable FOS (Factors of Safety) for different applications. Using a fatigue tester is a favorable way to test the fatigue characteristics of a material. Usage of this machine requires knowledge of Failure Mechanics and strength of materials in order to utilize the data from this machine. With this knowledge a controlled set of test can be conducted and the data can be interrupted into a SUT. This is achieved with the creation of a SN-Diagram (Stress vs. Number of cycles). To further constrain that the material and verify the material properties, other test can be conducted. These test include, hardness, metallurgy, spark, and tensile test. A collection of this data and published data will provide controlled fatigue characteristics with verified material properties.
- 6. Fatigue Analysis Report 2011-1-0610-403-GRO1 RochesterInstitute of Technology 6 Alternate Experiments To qualify the legitimacy of the Fatigue test results, a tensile test and a Hardness test were performed. The specimens used for both these experiments were parts of the broken specimens from the fatigue tests. For all the following experiments parts of the same specimens used for the fatigue test were used. This was to ensure no corruption of the sample set. For the Tensile test the neck of the specimen was used. Tensile test results, performed on 4 specimens were concurrent with those from the fatigue test. The average ultimate tensile strength derived from the experiment was 100ksi. The tensile test was however not enough evidence to dismiss either one of the hypothesis. A hardness test was then performed on 4 samples of the fatigue test. The average HRB number derived from the hardness test was 94.4 HRB. According to the Rockwell Hardness Conversion charts this indicted an ultimate tensile strength of approximately 98ksi. The results of the Tensile and Hardness test were concurrent with those of the Fatigue test. Precise results did not however account for accuracy. The investigation then leaned towards proving the authenticity of the specimens’ material. To conclude the specimen was in fact AISI 1018 Cold Rolled Steel, a spark test, Combustion test, and Metallographic test were performed. The spark test was visually conclusive. The spark profiles matched those of low to medium carbon steel alloys. This indicted the carbon content was between 0.15% and 0.20% of weight of the material. This is characteristic of low carbon steels, under which 1018 CRS falls. The combustion test was more precise. It was outsourced to IMR Testing Labs due to the lack of testing equipment here at RIT. IMR Testing Labs reported a carbon content of 0.19% of weight. This matched the requirements of AISI 1018 Carbon Steel according to UNS-G- 10180 standards. The Metallographic test helped observe the grain structure of the specimens. Polished and acid etched image results determined that the grain structure was similar to published images characteristic to low carbon steels. After performing all these tests, it was conclusive that the specimens were in fact AISI 1018 CRS, but the anomaly of the results being higher than its published/expected Sut is due to the presence of internal stresses. So to bring down the ultimate tensile strength value to a more acceptable range, it was decided that a full annealing process will have to be done. A batch of the same specimens were taken and thrown into the annealing oven to have them fully annealed. Upon annealing of these specimens, the group received 5 specimens, and the same fatigue, tensile, hardness and metallurgic tests were performed all over again to
- 7. Fatigue Analysis Report 2011-1-0610-403-GRO1 RochesterInstitute of Technology 7 compare the post annealed data to that of the pre annealed data. The results of these tests were found to be closer to published values within 3-4 percent variance. The average ultimate tensile strength indicated by the annealed specimens was 62.5ksi. A two sample T- test was made to compare the pre annealed and post annealed data, as part of the Six Sigma tools. This observation led to the conclusion that the material was accurately provided by the supplier. It was 1018 Cold Rolled Steel and the failure characteristics are in accordance to published data. Six Sigma Tools incorporated in the fatigue analysis report: Project Charter Gantt Chart Stages of Team Development Plan Do Check Act Process Flow Chart High Level SIPOC Box Plot Two Sample T-test ANOVA Cause and Effect Diagrams C & E Checklist Cost Analysis Results and Conclusion After performing multiple tests on the given sample specimens it is likely that they are AISI 1018 CRS. To confirm the material a vast number of other aspects must be researched. The manufacturing process would tell us a lot more about the components of the material. All test performed qualify the presence of internal stresses in the material. There is minimal evidence in this investigation that leads to conclusively verify that the material is 1018 CRS. Had specimens of 1015 CRS or 1020 CRS been tested, with a 4% variance in results the collected data would conclude the same most probably. The material exhibits characteristics of 1018 CRS but is not conclusive enough to accurately determine the ingredients of the material. However, the objective of the investigation was accurately met. Its failure conditions and behavior under these conditions were accurately charted. To verify material components accurately, further investigation and experiments would be necessary.
- 8. Fatigue Analysis Report 2011-1-0610-403-GRO1 RochesterInstitute of Technology 8 Appendix A Part Measurements& Initial Calculations 1018 ColdRolledSteel SUT= 65,300psi D= 0.500” d= 0.3125” Length=4.125” r= 0.1563” 𝑟 𝑑 = 0.1563" 0.3125" = .24 𝐷 𝑑 = 0.500 .3125 = 1.6* KT= 1.51 (Reference Figure C-1,(Norton,Page 1000)) L=4.125-0.3125= 3.8125”= MomentArm *Note:Basedon Figure C-1,there isa givencurve for 2.0 & 1.5 withvaluesforKT of 1.5 & 1.55 respectively.Therefore we made alinearinterpolationtoobtainthe value of 1.51 for KT. AreaMoment of Inertia= 𝐼 = 𝜋𝑑4 64 = 𝜋(0.3125" )4 64 = 4.68 × 10⁻⁴ 𝑖𝑛4 Avg. Surface CTemp CReliability CLoad Csize Csurface Corr. Factor 86.28μ” 1 0.702 1 0.778 0.975 0.5325 SUT’= Corr.Factor×SUT 𝜎 𝑚𝑎𝑥 = 𝑀𝐶 𝐼 → 𝐹 × 𝐿 × 𝑟 𝐼 = 𝐹 × 3.8125" × 0.1563 4.68 × 10⁻⁴ 𝑖𝑛4 𝜎 𝑚𝑎𝑥 = 𝐹 × 1272.87 𝜎 𝑚𝑎𝑥 1272.87 = 𝐹(𝑙𝑏𝑠) 𝜎 𝑚𝑎𝑥 286.18 = 𝐹(𝑁) Se’ = SUT × 0.5= 32,650 psi Se=Se’ ×CTemp×CReliability×CLoad×Csize×Csurface Se= 32,650 psi × 0.5325 Se= 17.386 psi Sm=SUT × 0.9= 58,770 psi
- 9. Fatigue Analysis Report 2011-1-0610-403-GRO1 RochesterInstitute of Technology 9 Appendix B Initial S/N Diagram S-N Diagram and Force Values for Fatigue Testing Revs Published Corrected 0 65300 65300 1.0E+03 58770 58770 1.0E+06 32650 17386 1.0E+09 32650 17386 Projected numbers Actual Rev Actual MinutesSample Stress (psi) Revs Force (N) Minutes 1 50000 4320 175 1.22 78697 22.17 2 48000 6030 168 1.70 80624 22.71 3 46000 8420 161 2.37 85440 24.07 4 44929 10070 157 2.84 103119 29.05 5 42640 14760 149 4.16 114689 32.31 6 40065 22680 140 6.39 108647 30.60 7 38061 31690 133 8.93 297435 83.78 8 36344 42210 127 11.89 522331 147.14 9 34341 58960 120 16.61 354164 99.76 10 25756 87150 90 24.55 3853035 1085.36 y = -5991ln(x) +100150 0 10000 20000 30000 40000 50000 60000 70000 1.0E+00 1.0E+02 1.0E+04 1.0E+06 Corrected Corrected Log. (Corrected)
- 10. Fatigue Analysis Report 2011-1-0610-403-GRO1 RochesterInstitute of Technology 10
- 11. Fatigue Analysis Report 2011-1-0610-403-GRO1 RochesterInstitute of Technology 11 Completed Post Annealed S/N Diagram Revs Published Corrected 0 65300 65300 1.0E+03 58770 58770 1.0E+06 32650 17386 1.0E+09 32650 17386 Post Anneal Revs Projected numbers Actual Rev Actual MinutesSample Stress (psi) Revs Force (N) Minutes 1 50000 4320 175 1.22 78697 22.17 4063 2 48000 6030 168 1.70 80624 22.71 3 46000 8420 161 2.37 85440 24.07 6320 4 44929 10070 157 2.84 103119 29.05 5 42640 14760 149 4.16 114689 32.31 8019 6 40065 22680 140 6.39 108647 30.60 7 38061 31690 133 8.93 297435 83.78 18770 8 36344 42210 127 11.89 522331 147.14 9 34341 58960 120 16.61 354164 99.76 24980 10 25756 87150 90 24.55 3853035 1085.36 Pre- Anneal Post Anneal Tensile 100 ksi 62 ksi Hardness 98 ksi 57.8 ksi
- 12. Fatigue Analysis Report 2011-1-0610-403-GRO1 RochesterInstitute of Technology 12
- 13. Fatigue Analysis Report 2011-1-0610-403-GRO1 RochesterInstitute of Technology 13 Appendix C Finite Element Analysis Executive Summary Finite ElementAnalysisisapowerful tool that can be usedtoanalyze complex stress situationsonmultiple parts. Whenused properlyitcan findsolutionstoproblemsthat are toocomplex forclassical closed-form methodsof stressdeflectionanalysis. If these calculationsare done byhand,it is too easyto misscertainstressconcentrationsthatthe software isprogrammedtopickup on.The FEA software expeditesandstandardizesthe processso accurate calculationsare consistentlycreated. Model Information Model name: Part1-1 Current Configuration: Default
- 14. Fatigue Analysis Report 2011-1-0610-403-GRO1 RochesterInstitute of Technology 14 Solid Bodies Document Name and Reference Treated As Volumetric Properties Document Path/Date Modified Chamfer1 Solid Body Mass:0.0795517 kg Volume:1.01082e-005 m^3 Density:7870 kg/m^3 Weight:0.779606 N C:UsersArs1080AppD ataLocalTempPart1- 1.SLDPRT Nov 07 15:11:41 2011 Units Unit system: SI (MKS) Length/Displacement mm Temperature Kelvin Angular velocity Rad/sec Pressure/Stress N/m^2 Material Properties Model Reference Properties Components Name: AISI 1018 Steel, Cold Rolled Model type: Linear Elastic Isotropic Default failure criterion: Max von Mises Stress Yield strength: 50763.2 psi Tensile strength: 60915.8 psi Elastic modulus: 2.97327e+007 psi Poisson's ratio: 0.29 Mass density: 0.284322 lb/in^3 Shear modulus: 1.1603e+007 psi Thermal expansion coefficient: 6.5e-006 /Fahrenheit SolidBody 1(Chamfer1)(Part1- 1) Curve Data:N/A
- 15. Fatigue Analysis Report 2011-1-0610-403-GRO1 RochesterInstitute of Technology 15 Loads and Fixtures Fixture name Fixture Image Fixture Details Fixed-2 Entities: 1 face(s) Type: Fixed Geometry ResultantForces Components X Y Z Resultant Reaction force(N) -0.0023194 100.791 0.00255805 100.791 Reaction Moment(N-m) 0 0 0 0 Load name Load Image Load Details Gravity-1 Reference: Top Plane Values: 0 0 -9.81 Units: SI Remote Load (Direct transfer)-1 Entities: 1 face(s) Type: Load (Direct transfer) Coordinate System: Global cartesian coordinates Force Values: ---, -100, --- N Moment Values: ---, ---, --- N-m Reference coordinates: 5.5 0.15625 0 in Components transferred: Force
- 16. Fatigue Analysis Report 2011-1-0610-403-GRO1 RochesterInstitute of Technology 16 Mesh Information Meshtype SolidMesh MesherUsed: Standardmesh Automatic Transition: Off Include MeshAuto Loops: Off Jacobian points 4 Points ElementSize 0.0851578 in Tolerance 0.00425789 in MeshQuality High Total Nodes 11285 Total Elements 6862 MaximumAspect Ratio 7.5232 % of elementswithAspectRatio < 3 98.8 % of elementswithAspectRatio > 10 0 % of distortedelements(Jacobian) 0 Time to complete mesh(hh;mm;ss): 00:00:02 Computername: 719-70-1130-04
- 17. Fatigue Analysis Report 2011-1-0610-403-GRO1 RochesterInstitute of Technology 17 Resultant Forces Reaction Forces Selectionset Units Sum X Sum Y Sum Z Resultant Entire Model N -0.0023194 100.791 0.00255805 100.791 Reaction Moments Selectionset Units Sum X Sum Y Sum Z Resultant Entire Model N-m 0 0 0 0 Study Results Name Type Min Max Stress1 VON: von Mises Stress 7.66339e-007 ksi Node: 841 29.774 ksi Node: 331 Part1-1-Study 1-Stress-Stress1
- 18. Fatigue Analysis Report 2011-1-0610-403-GRO1 RochesterInstitute of Technology 18 Name Type Min Max Displacement1 URES: Resultant Displacement 0 in Node: 8 0.0309513 in Node: 330 Name Type Min Max Strain1 ESTRN: EquivalentStrain 1.06866e-010 Element: 4490 0.000690231 Element: 2346
- 19. Fatigue Analysis Report 2011-1-0610-403-GRO1 RochesterInstitute of Technology 19 Conclusion In this specific FEA analysis, you can quickly determine where the part incurs the most stress in the model. The distributed von MISES stress throughout the part range from 7.66339e-007 ksi to 29.774 ksi. These numbers are not as important as the proportion of the stresses throughout the specimen. Error could have occurred in the calculation of the stress due to user error. But the distribution of the stresses in the model still holds true. The most important distribution of stress to concentrate on is the ones located at the fillet. More specifically speaking, the greatest stress will be at the point of fixation, furthest from the load. This is important to further investigate during the design of this part and during the fatigue analysis of this cantilever beam. You can also find from this FEA analysis is the areas in which the cantilever beam incurs the greatest defection. The specimen is under a load and in reverse bending. Due to the moment force, the point of fixation is undergoing the most stress. The point where the most deflection occurs is at the load. A significant amount of deflection is shown in the diagrams and illustrated with the colors and scale.
- 20. Fatigue Analysis Report 2011-1-0610-403-GRO1 RochesterInstitute of Technology 20 Appendix D Fatigue Test Pre-AnnealedFatigueTesting Executive Summary The goal of this experiment was to find the ultimate strength of 1018 CRS and compare it to the published data. 10 specimens were given to us by our boss and each specimen will be tested at various loads based on our initial calculations. All of the data collected from the fatigue tests will be compiled together to create an S-N Diagram to find the ultimate strength of the 1018 samples. The 10 specimens were tested at forces ranging from 90N to 175N. The fatigue tester operated at 3450 revolutions per minute. After gathering all of the data and drawing a new logarithmic line, the ultimate strength was determine to be 84 ksi, as can be seen in the S-N Diagram (Appendix B). The ultimate strength of the tested parts was far higher than the published date for ultimate strength. Tensile and hardness tests will be performed next to see if the machine is off or the parts are out of spec and to get down to the reason why the measured data and published data are off by more than 3-4%. Equipment Specifications Fully reversed bending analysis was performed on a standard G.U.N.T Fatigue Testing machine manufactured by G.U.N.T. Hamburg GmbH, Germany. The equipment specifications are as follows: Motor Speed: 3450 rpm Output: 0.37kW Load 0- 300 Newton’s Load Cycle Counter Electronic 8-digit digital display Can be switched to display speed The machine was ideal for performing a fully reversed bending test on a small scale. The fully reversed condition is achieved as the specimen rotates with the top half of the profile
- 21. Fatigue Analysis Report 2011-1-0610-403-GRO1 RochesterInstitute of Technology 21 in tension while the bottom half in compression. Due to excessive, long term usage it was suspected the motor output would differ from the manufacturing specifications. We took a reading of the RPM and got results back showing that it wasn’t off by much. During operational conditions there would be a substantial amount of load on the test specimen. This load would generate higher friction that the motor would have to overcome. This could potentially have lowered the speed at which the machine ran. Goals and Objectives Fatigue testing of all ten specimens and use the data to create a new logarithmic line to calculate the measured ultimate strength of the 1018 CRS. Procedure As a starting point an estimated S-N Diagram was constructed. This helped chart the likely pattern that a sample of AISI 1018 Cold Rolled Steel would impersonate. The estimate S-N diagram was used as reference to determine the load conditions for the actual experiment. Taking the number of cycles as the independent variable, loads ranging from 90-175N were determined. The load range was then divided and each of the 10 specimens was assigned a load value. Once loaded into the fatigue tester the specimens were tested and the number of cycles to breakpoint was noted and plotted on the S-N Diagram. Data& Graph Projected numbers Actual Rev Actual MinutesSample Stress (psi) Revs Force (N) Minutes 1 50000 4320 175 1.22 78697 22.17 2 48000 6030 168 1.70 80624 22.71 3 46000 8420 161 2.37 85440 24.07 4 44929 10070 157 2.84 103119 29.05 5 42640 14760 149 4.16 114689 32.31 6 40065 22680 140 6.39 108647 30.60 7 38061 31690 133 8.93 297435 83.78 8 36344 42210 127 11.89 522331 147.14 9 34341 58960 120 16.61 354164 99.76 10 25756 87150 90 24.55 3853035 1085.36
- 22. Fatigue Analysis Report 2011-1-0610-403-GRO1 RochesterInstitute of Technology 22 Results Analysis: During the experiment, there was a noticeable difference in revolutions required to cause failure. This difference was further emphasized with a visual comparison between expected data points and actual data point. Comparing the expected and actual results on the S-N Diagram we see how the actual data resulted in a change in the expected Se, Sm and Sut. The published value for the 1018 CRS is 65.3 ksi and the value projected by this data set is 84.2 ksi. This is about a 29% error between the two sets of data. Error Evaluation As mentioned previously, our specimens took longer to break than we had anticipated. This inaccuracy of results may have been caused due to a number of factors such as system errors, calibration offsets, human errors, loading condition faults, the wrong material being provided by the supplier, etc. One thing though, the precision of the results following a path similar to expected path, though offset, proves that random errors were negligible. The further this test issue, and determine why our data was off by so much, we will be performing additional tests, including hardness and tensile.
- 23. Fatigue Analysis Report 2011-1-0610-403-GRO1 RochesterInstitute of Technology 23 Fatigue (All Groups) Group psi Ksi Revs Group psi Ksi Revs Group psi Ksi Revs 1,1 50120 50.1 92765 1,4 55000 55.0 36874 1,7 52750 52.8 49228 46700 46.7 74593 53000 53.0 41441 49000 49.0 53427 43700 43.7 171770 49000 49.0 110696 47100 47.1 70320 40870 40.9 135990 46000 46.0 80430 44500 44.5 86027 37600 37.6 314187 42000 42.0 24696 40750 40.8 122848 34100 34.1 1269818 41000 41.0 158725 38900 38.9 108295 54800 54.8 48330 38000 38.0 213696 36750 36.8 215479 39210 39.2 151716 34000 34.0 164803 33300 33.3 NB 50170 50.2 89575 29000 29.0 687565 30500 30.5 588000 54500 54.5 54326 27500 27.5 NB 27750 27.8 1300000 1,2 50653 177 6348 51000 51.0 75356 2,1 50000 50.0 78697 46933 164 72309 46000 46.0 116434 48000 48.0 80624 34341 120 68209 42000 42.0 83371 46000 46.0 85440 44071 154 81616 1,5 42776 42.8 127447 45000 45.0 103119 40351 141 129102 40616 40.6 85375 43000 43.0 114689 37489 131 299223 38457 38.5 128596 40000 40.0 108647 31479 110 419308 35608 35.6 326093 38000 38.0 297435 29190 102 625383 27415 27.4 1248645 36000 36.0 522331 34402 34.4 462652 34000 34.0 354164 29565 29.6 945661 26000 26.0 NB 1,3 56000 56.0 63,274 31871 31.9 136044 2,2 42000 42.0 69906 53000 53.0 31,317 31137 31.1 713505 46000 46.0 81565 50000 50.0 59,459 30262 30.3 811032 37000 37.0 242056 47000 47.0 29,603 1,6 60088 60.1 47196 39000 39.0 162536 44000 44.0 91,061 57835 57.8 56850 35000 35.0 313827 41000 41.0 182,538 54830 54.8 60469 41000 41.0 126482 38000 38.0 324,223 52577 52.6 175201 44000 44.0 84841 35000 35.0 401,379 50324 50.3 129368 31000 31.0 971272 32000 32.0 748,225 47319 47.3 145139 33000 33.0 669313 29000 29.0 2845198 45066 45.1 198444 34000 34 339841 42813 42.8 272859 39808 39.8 264111 37555 37.6 281022
- 24. Fatigue Analysis Report 2011-1-0610-403-GRO1 RochesterInstitute of Technology 24 Group Sut 1,1 86.6 1,2 67.0 1,3 79.2 1,4 82.4 1,5 66.4 1,6 164.4 1,7 85.3 2,1 84.2 2,2 73.9
- 25. Fatigue Analysis Report 2011-1-0610-403-GRO1 RochesterInstitute of Technology 25 Post AnnealedFatigueTesting Executive Summary The goal of this experiment was to find the ultimate strength of annealed samples of 1018 CRS and compare it to the published data. Five specimens were given to us and each specimen is to be tested at various loads based on our initial calculations. All of the data collected from the fatigue test will be compiled together to create an S-N Diagram to calculate the ultimate strength of the 1018 samples. The five samples were tested at forces ranging from 120N to 175N. The fatigue tester operated at approximately 3450 revolutions per minute. After gathering all of the data and drawing a new logarithmic line, the ultimate strength was determine to be 67.5 ksi as can be seen in the S-N Diagram (Appendix B). The ultimate strength of the tested parts was 3.4% higher than the published date for ultimate strength. Tensile and hardness tests will be performed to further verify this value. Equipment Specifications Fully reversed bending analysis was performed on a standard G.U.N.T Fatigue Testing machine manufactured by G.U.N.T. Hamburg GmbH, Germany. The equipment specifications are as follows: Motor Speed: 3450 rpm Output: 0.37kW Load 0- 300 Newton’s Load Cycle Counter Electronic 8-digit digital display Can be switched to display speed The machine was ideal for performing a fully reversed bending test on a small scale. The fully reversed condition is achieved as the specimen rotates with the top half of the profile in tension while the bottom half in compression. Due to excessive, long term usage it was suspected the motor output would differ from the manufacturing specifications. We took a reading of the RPM and got results back suggesting that it was close to its specified speed. During operational conditions there would be a substantial amount of load on the test
- 26. Fatigue Analysis Report 2011-1-0610-403-GRO1 RochesterInstitute of Technology 26 specimen. This load would generate higher friction that the motor would have to overcome. This could have potentially reduced the speed of the machine under load. Goals and Objectives Fatigue testing five annealed specimens and use the data to create a new logarithmic line to calculate the measured ultimate strength of the annealed 1018 CRS, then compare it to both the pre-annealed values as well as the published value. Procedure As a starting point an estimated S-N Diagram was constructed. This helped chart the likely pattern that a sample of AISI 1018 Cold Rolled Steel would impersonate. The estimate S-N diagram was used as reference to determine the load conditions for the actual experiment. Taking the number of cycles as the independent variable, loads ranging from 120-175N were determined. The load range was then divided and each of the five specimens was assigned a load value. Once loaded into the fatigue tester the specimens were tested and the number of cycles to breakpoint was noted and plotted on the S-N Diagram. Data& Graph Projected numbers Actual Rev Actual Minutes Post Anneal RevSample Stress (psi) Revs Force (N) Minutes 1 50000 4320 175 1.22 78697 22.17 4063 2 48000 6030 168 1.70 80624 22.71 3 46000 8420 161 2.37 85440 24.07 6320 4 44929 10070 157 2.84 103119 29.05 5 42640 14760 149 4.16 114689 32.31 8019 6 40065 22680 140 6.39 108647 30.60 7 38061 31690 133 8.93 297435 83.78 18770 8 36344 42210 127 11.89 522331 147.14 9 34341 58960 120 16.61 354164 99.76 24980 10 25756 87150 90 24.55 3853035 1085.36
- 27. Fatigue Analysis Report 2011-1-0610-403-GRO1 RochesterInstitute of Technology 27 Results Analysis: During the experiment, there was a difference in time required to failure point, although it was far less than that of the non- annealed samples. Comparing the expected and actual results on the expected S-N Diagram we see how the actual data resulted in a change in the expected Se, Sm and Sut. The theoretical value for the 1018 CRS should be 65.3 ksi and our value came out to be 67.5 ksi. This is about a 3.4% error between the two sets of data. Error Evaluation The inaccuracy of results may have been caused due to a number of factors such as system errors, calibration offsets, human errors, loading condition faults, the wrong material being provided by the supplier, etc. The precision of the results following a path similar to expected path, though offset, proves that random errors were negligible. Overall, the samples were within 4% of the published data, so further testing will help define the tested ultimate tensile strength of the material.
- 28. Fatigue Analysis Report 2011-1-0610-403-GRO1 RochesterInstitute of Technology 28 Appendix E Tensile Testing TensileTestofthe pre-annealedSamples Executive Summary To confirm the ultimate tensile strength of the specimens and to compare them to and validate the fatigue testing results, tensile testing was performed on four specimens. By measuring the parts to find the area broken and using the MTS Universal Testing machine, we were able to obtain the ultimate tensile strength for those specimens. An average tensile strength of 100 ksi was recorded, with a standard deviation of 6.2 ksi. This average was considerably higher than the ultimate strength projected by our fatigue results. Equipment Tensile Tester Goals & Objectives The goal of this experiment was to determine the ultimate tensile strength of four of the specimens of 1018 cold rolled steel. This value could then be compared to the projected ultimate strength from the fatigue values. Procedure Four samples (samples 1, 2, 3, and 4 as labeled from fatigue testing) were tested in the Universal Testing Insight tensile testing machine. The machine was set up to hold the size specimen we were using, then the piece was secured inside. The sample was first secured in the upper vice and then slowly lowered into the lower vice, and secured there. A strain gauge was attached to the specimen and the machine was started. Once prompted, the strain gauge was removed and the test continued until fracture. The stress and strain figured were recorded by the computer. The specimen was then removed than the process was repeated.
- 29. Fatigue Analysis Report 2011-1-0610-403-GRO1 RochesterInstitute of Technology 29 Data All Specimen Graph Individual Specimen Graphs Specimen # : 1 Specimen # : 2 Specimen # : 3 Specimen # : 4
- 30. Fatigue Analysis Report 2011-1-0610-403-GRO1 RochesterInstitute of Technology 30 Specimen Results Specimen # Specimen Comment Diameter Peak Load Peak Stress Modulus Break Stress Stress At Offset Yield Strain At Break % Total Energy Absorbed in lbf psi psi Psi psi ft*lbf/in^2 1 Part 1 0.311 8048 105947.5 3.38E+07 1.03E+05 9.68E+04 3.326 274 2 Part 2 0.311 7969 104909.3 3.23E+07 7.52E+04 9.77E+04 23.779 1743 3 Part 3 0.312 7284 95278.6 3.24E+07 6.56E+04 8.11E+04 21.07 1598 4 Part 4 0.313 7253 94258.3 3.18E+07 7.44E+04 8.03E+04 8.973 674 Mean 0.312 7639 100098.4 3.26E+07 7.96E+04 8.90E+04 14.287 1072 Std. Dev. 0.001 429 6183.1 8.77E+05 1.63E+04 9.58E+03 9.738 712 TensileTestofthe post-annealedSamples Executive Summary To confirm the ultimate tensile strength of the annealed specimens and to compare them to and validate the pre and post- annealed fatigue testing results, tensile testing was performed on five specimens. By measuring the parts to find the area broken and using the MTS Universal Testing machine, we were able to obtain the ultimate tensile strength for those specimens. An average ultimate tensile strength of 62.2 ksi was found through testing, with a standard deviation of 0.356 ksi. This average was 4.7% lower than the published value. Equipment Tensile Tester Goals & Objectives The goal of this experiment was to determine the ultimate tensile strength of five of the annealed specimens of 1018 cold rolled steel. This value could then be compared to the projected ultimate strength from the fatigue values, as well as our pre- annealing tensile values to determine differences.
- 31. Fatigue Analysis Report 2011-1-0610-403-GRO1 RochesterInstitute of Technology 31 Procedure Four samples (samples 1, 2, 3, 4 and 5 as labeled from fatigue testing) were tested in the Universal Testing Insight tensile testing machine. The machine was set up to hold the size specimen we were using, then the piece was secured inside. The sample was first secured in the upper vice and then slowly lowered into the lower vice, and secured there. A strain gauge was attached to the specimen and the machine was started. Once prompted, the strain gauge was removed and the test continued until fracture. The stress and strain figures were recorded by the computer. The specimen was then removed than the process was repeated. Specimen Results Specimen # Specimen Comment Diameter Peak Load Peak Stress Modulus Break Stress Stress At Offset Yield Strain At Break Total Energy Absorbed in lbf Psi psi psi psi % ft*lbf/in^2 1 Part 1 0.31 4706 62347.3 3.32E+07 4.52E+04 3.95E+04 29.015 1912 2 Part 2 0.31 4669 61854.5 3.15E+07 4.48E+04 3.83E+04 31.107 2126 3 Part 3 0.313 4753 61770 3.24E+07 4.46E+04 3.82E+04 31.447 2170 4 Part 4 0.309 4687 62498.9 3.56E+07 4.50E+04 3.89E+04 32.957 2371 5 Part 5 0.309 4687 62506.8 3.08E+07 4.42E+04 3.98E+04 32.259 2290 Mean 0.31 4700 62195.5 3.27E+07 4.48E+04 3.89E+04 31.357 2174 Std. Dev. 0.002 32 356.8 1.84E+06 3.75E+02 7.08E+02 1.494 175
- 32. Fatigue Analysis Report 2011-1-0610-403-GRO1 RochesterInstitute of Technology 32 Appendix F Hardness Pre AnnealedHardnessTesting Executive Summary To confirm the ultimate tensile strength of the fatigue and tensile tests and to validate theirs results hardness test on 4 specimens was performed. Rockwell B scale was used and correction factors were used to find the hardness of each sample. After collecting all of the data an average of 94.4 was found. By using a conversion graph, the ultimate tensile strength was found to be 98 ksi. This test helped to confirm that the ultimate tensile strength of the parts were higher than published data. Equipment Wilson Instruments Rockwell Hardness Tester Series 2000 Goals & Objectives The goal of the experiment was to determine the hardness for the 4 specimens tested of the 1018 CRS. This number could then be converted to ultimate tensile strength to be compared to the published data, as well as the results from the fatigue and tensile tests.
- 33. Fatigue Analysis Report 2011-1-0610-403-GRO1 RochesterInstitute of Technology 33 Procedure 4 samples were tested 4 times each on the Wilson Rockwell Hardness Tester. This was a fairly simple test. The specimens were placed on the hardness testing machine. The indenter used was a hardened steel ball. This indenter is used for aluminum, brass and soft steels. The indenter’s comparative scale is the HRB. Once the samples were placed on the testing platform a mechanical arm indented it. The indentation marks left were then measured for area of indentation. The area was then cross referenced with Rockwell Conversion Charts to determine the ultimate tensile strength. Data Hardness Pre-Annealed Results Part 1 HRB Actual HRB Corrected 1 94 95.8 2 93.6 95.4 3 94.4 96.2 4 94.4 96.2 Part 2 1 96.4 98.4 2 96.6 98.3 3 96.2 97.9 4 96.5 98.2 Part 3 1 89.9 91.9 2 89.9 91.9 3 90 92 4 90.1 92.1 Part 4 1 89.4 91.4 2 90.4 92.4 3 89.1 91.1 4 89.4 91.4 Average= 94.41 BHN= 207.99 SUT= 98 ksi The average of all the values provided a 94.4 HRB number. This is indicative of an ultimate tensile strength of roughly 98 ksi. Published data however provides an HRB number of 71 for 1018 Cold Drawn Steel. This is a 25% deviation; 8% error range is allowed.
- 34. Fatigue Analysis Report 2011-1-0610-403-GRO1 RochesterInstitute of Technology 34 Error Analysis Errors in the Hardness test may have occurred due to various reasons. The 4 times that each specimen was tested, it was tested in 4 different locations. Even by testing each sample 4 times, there can still be 4 spots chosen that do not reflect the overall mechanical properties of the material. Also, there could have been faulty results if the steel was tested too close to the edges of the sample. Conclusion Since the readings of the hardness test are concurrent with the results from the tensile test and the fatigue test, the results are valid. The slight errors that may have occurred are thus, negligible. Post AnnealedHardnessTesting Part 1 HRB Actual HRB Corrected Rockwell B Hardness Numbers (HRB) Equations to Convert Rockwell B Hardness (HRB) into Brinell Hardness (HB 1 60.9 57.3 2 63.1 59.6 from to 3 60.5 56.8 55 69 HB = 1.646 x HRB + 8.7 4 51.5 47.4 70 79 HB = 2.394 x HRB – 42.7 5 53.6 49.6 80 89 HB = 3.297 x HRB – 114 Part 2 90 100 HB = 5.582 x HRB – 319 1 50.3 46.1 2 62.1 58.5 3 62 58.4 4 56.8 52.9 5 62 58.4 Part 3 1 52.8 48.7 2 57 53.2 3 60.6 57 4 51.6 47.5 5 51.4 47.3 Part 4 1 32.1 27 2 45.7 41.3 3 60 56.3 4 61.9 58.3 5 57.3 53.5 Part 5 1 50 45.8 2 59.9 56.2 3 61.5 57.9 4 55.3 51.4 5 53.1 49.1 55.72 51.82 BHN= 637.5 Average= 506.63 SUT= 266 ksi
- 35. Fatigue Analysis Report 2011-1-0610-403-GRO1 RochesterInstitute of Technology 35 Results After retrieving all the data from the past 4 tests on the pre annealed samples, we realized that our ultimate tensile strength was higher than the published data for cold rolled 1018 steel. In trying to lower the tensile strength of the samples, we fully annealed 5 additional samples and tested them. In order to ensure the most accurate results, we preformed four different tests to prove our samples were in fact 1018 Cold Rolled Steel. The tests that we preformed included a fatigue test, tensile test, metallurgy test and a Rockwell Hardness test. The annealing process heats the samples to slightly below the materials austenizing temperature. Once it reaches this temperature, it begins to slow cool and over time lowers the strength of the material by making it more ductile by allowing the grain structure to return to its pre-drawn state. The results from the annealed hardness test are compared directly with results of the pre annealed hardness test of the 10 previous samples. Through the results we can see that the hardness average of the pre annealed samples are higher than that of the annealed samples. What this means is that the annealing process has made the surface of the new samples softer than the original pre annealed samples, ultimately lowering the strength of the samples to meet the published ultimate tensile strength.
- 36. Fatigue Analysis Report 2011-1-0610-403-GRO1 RochesterInstitute of Technology 36 Appendix G Combustion-Infrared Absorption Executive Summary The carbon content test or otherwise known as combustion test was outsourced to IMR Testing Labs since the required equipment was unavailable to us through RIT. This test was conducted to better verify the carbon content in the specimens and help verify the Spark Test results. IMR Testing Labs combustion tested 1 sample specimen that was received from a group in Section 1 of Failure Mechanics class. Their report concluded that the specimen has 0.19% of carbon by weight. The published characteristics of AISI 1018 Carbon steel require between 0.15% and 0.20% of carbon by weight. They also concluded that the sample met UNS-G-10180 standards for AISI 1018 Carbon Steel. The report provided by IMR Test Labs is provided in the next page. This report has been made available by the generosity of Thomas Mordovancey from Section 1. Error Analysis Accounting for possible errors in this test was no possible due to an inadequacy of information pertaining to the testing method. Conclusion The combustion test is standard test performed by IMR Testing Labs often. In spite of a lack of information about the testing method, it was concluded that the results were conclusive.
- 37. Fatigue Analysis Report 2011-1-0610-403-GRO1 RochesterInstitute of Technology 37
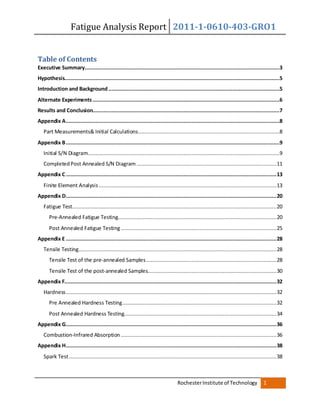
- 38. Fatigue Analysis Report 2011-1-0610-403-GRO1 RochesterInstitute of Technology 38 Appendix H Spark Test Executive Summary The spark test is used to determine relative molecular content of materials. In this case, the test was used to determine the relative carbon content of our steel specimens. The test involved use of a grinder and a specimen of 1018 steel. Vision and picture comparison was used to come to our conclusions. After observing the spark patterns and color, the specimen appears to be a low or mild carbon steel. Equipment The equipment used was a grinding wheel. Goals & Objectives The objective of this test was to determine a relative (mild or low, medium, or high carbon) carbon content of the specimen. The specification of the specimen could then be compared to that to see if it fell within that category. Procedure After the grinding wheel had come to speed, the specimen was securely held and touched to the wheel. The spark pattern was observed and photographs were taken to document the patterns. Conclusion Due to the leafing observed in the spark patterns, as well as very little branching, it was concluded that the samples had the spark characteristics of a mild carbon steel. Data There is no numeric data for this experiment, only photographs recording the spark patterns and colors.
- 39. Fatigue Analysis Report 2011-1-0610-403-GRO1 RochesterInstitute of Technology 39 Above:(Fromtopto bottom) mildcarbonsteel, mediumcarbonsteel,andhighcarbonsteel spark characteristics.(Picturesfrom www.capeforge.com) Left:Two picturesof a spark testperformedona sample of 1018 coldrolledsteel.
- 40. Fatigue Analysis Report 2011-1-0610-403-GRO1 RochesterInstitute of Technology 40 Appendix I Metallography Pre-AnnealedMetallographyTest Executive Summary At this point it is established that the specimen is definitely AISI CRS 1018, and the results were not due to a faulty machine. The fatigue, tensile, and hardness test results all gave tensile strengths that were far above the published data. We are now assuming that the steel must have been malformed to produce different results and is suspected that some cold-working has happened. A metallurgical test was performed to prove this hypothesis. It was found that upon performing this test, the grains were elongated, as seen in the images below. These elongated grains were due to some unknown cold-working, and resulted in giving us inflated results for the tests performed thus far. It is now known that we have to anneal the 1018 CRS specimens to match the published data. The annealing type that was chosen is Full Annealing, because that should bring the results to that of the published data within 3-4% as we expect, by getting the grains back to normal. Goals and Objectives The purpose of this test is to verify the grain structure of a material. Depending on the contents of a material the metallurgical test will help validate the previously done Spark Test and Combustion test and our hypothesis. Procedure A sample from one of the specimens was cut and polished to a fine, 1 micron grit. Once polished the sample was cleaned in alcohol. After the alcohol had dried off the polished surface of the sample was treated with acid and then drowned in flowing water. This helped dilute the acid and the sample was then safe to touch with human hands. The sample was then observed under a high magnification microscope. The microscope helped determine the grain structure clearly. The images taken by a camera capable of taking such pictures was then compared to published data.
- 41. Fatigue Analysis Report 2011-1-0610-403-GRO1 RochesterInstitute of Technology 41 Data/Images Collected PublishedImagefor1018CRS CollectedImagefor 1018CRS
- 42. Fatigue Analysis Report 2011-1-0610-403-GRO1 RochesterInstitute of Technology 42 CollectedImagesofGrain Structure under microscope Error Analysis The possibilities of errors in visually determining the accuracy of images is difficult. The abilities of the camera used to take the photographs were mediocre. Under the microscope however the grain structure was clearer. Conclusion Though it is hard to photographically verify the images, it was visually conclusive that the specimen grain structure matched that of the published grain structure image close enough, but full annealing will now be performed.
- 43. Fatigue Analysis Report 2011-1-0610-403-GRO1 RochesterInstitute of Technology 43 Post-AnnealedMetallographyTest Executive Summary With the specimens being fully annealed, a metallurgy test was performed once again to examine their grain structures. We came to a decision that upon full annealing the 1018 CRS, the grain structure will become less elongated, thus giving it a lower Sut value, so that it would match out CTQ which is 65.3 ksi. With the annealed specimen, a fatigue, tensile, and hardness tests were performed all over again to compare the results of the pre annealed to that of the post annealed data. Finally a metallurgy test was also redone to compare grain structures, and we found that the grain structure was definitely less elongated than the pre annealed images. Goals and Objectives The objective of this experiment was to determine if performing the full annealing resulted in the samples having a more "normal" grain structure. Non-elongated grain structure is the reason why our fatigue, tensile and hardness Sut results are more close to the published value. Data/Images Collected Axial grain structure under microscope
- 44. Fatigue Analysis Report 2011-1-0610-403-GRO1 RochesterInstitute of Technology 44 Lateral grain structure under microscope
- 45. Fatigue Analysis Report 2011-1-0610-403-GRO1 RochesterInstitute of Technology 45 Appendix J Annealing Annealing is a process by which a treated or worked metal can be brought back to its original microstructure. During rolling or cold drawing, the grain structure of steel is elongated, making the steel stronger and harder. Annealing is processes which, by heating steel, its grain structure can relax and return to its original form. This non-elongated structure is typically weaker and softer than the elongated structure caused by cold rolling or cold drawing. The annealing process for bringing steel back to its original structure and properties involves heating and controlled cooling. In order to achieve the re-alignment of the grain structure in a full anneal, steel must be brought to 1200-1300 degrees Fahrenheit. After a short period of time, the steel must be cooled slowly to avoid a quenching effect, usually taking approximately 15 hours.
- 46. Fatigue Analysis Report 2011-1-0610-403-GRO1 RochesterInstitute of Technology 46 Appendix K Cost Analysis Energy Cost Machine/ Experiment Run Time (Hr.) Power Usage (watts) Kwh Cost ($0.15/Kwh) Fatigue 25 1000 25 $3.75 Tensile 2 200 0.4 $0.06 Hardness 1 750 0.75 $0.11 Annealing 12 5000 60 $9.00 Grinder 0.5 500 0.25 $0.04 Computer 50 270 13.5 $2.03 Metallurgy 1 2000 2 $0.30 Total 91.5 9720 101.9 $15.29 Testing Group Technicians Hours Wage Labor/Cost Group 1 Section 2 41.5 $16 $664 External Cost IMR $60 Material $20 Printing $40 Engineering Engineers Hours/Eng Wage/Eng. Labor/Cost 7 50 $26 $9,100 Total Cost of Project $9,914.00 Conclusion This #’s were derived through estimation and online information. This is a small representation of what this project would cost in industry.
- 47. Fatigue Analysis Report 2011-1-0610-403-GRO1 RochesterInstitute of Technology 47 Appendix L Green Belt Tools ProjectCharter PROJECT NO.: 20111-0610403-GRO1 Start Date September 7, 2011 Completion Date November9,2011 Belt Name Duane Beck Champion WilliamLeonard Element Description Team Charter Objective Statement What is the objective to be achieved? To determine the fatigue characteristics of AISI 1018 cold rolled steel and compare them to the published values by November 7, 2011. Project Scope Which part of the process will be investigated? To determine the fatigue characteristics of AISI 1018 CRS. Team Members Who is on the team, internal and external personnel? Internal: Rahat Kamal, David Schmidt, Andrew Smith, Kyle Manchester, Elijah Romulus, O’Neil Campbell, and Jeremy Ayala External: Mike Caldwell and William Leonard Project Schedule (Gantt Chart) What is the projected timeline for each phase of the project? Please Refer to Gantt Chart
- 48. Fatigue Analysis Report 2011-1-0610-403-GRO1 RochesterInstitute of Technology 48 Project Summaryfor the Green Belt in MET Stages / Phases Goals and Start Date Deliverable Outcomes Belt /Champion Approval Signatures And End Date Stage 1 Define Phase Stage 1 Measure Phase Stage 2 Analyze Phase Stage 3 Improve Phase Stage 3 Control Phase Stage 3 Written Report Stage 3 Oral Defense
- 49. Fatigue Analysis Report 2011-1-0610-403-GRO1 RochesterInstitute of Technology 49 Gantt chart
- 50. Fatigue Analysis Report 2011-1-0610-403-GRO1 RochesterInstitute of Technology 50 Forming1 • Team gets to know each other Storming2 • Conflict Resolution begins Norming3 • Team Starts to Form Performing4 • Teams are effective Adjourning5 • Team breaks off to complete tasks StagesofTeam Development Phase 1 The team was created and initial kick-off meeting was held. Taking the task at hand the group brainstormed ideas of how to split up the initial tasks. With the initial set of Fatigue testing the team has been formed. Phase 2 The team became effective at completing the tasks at hand in a timely and orderly manner Phase 3 The team broke into two smaller teams and was still able to perform and adjourn effectively as one big initial group.
- 51. Fatigue Analysis Report 2011-1-0610-403-GRO1 RochesterInstitute of Technology 51 PDCA Supply Chain Plan Do Check Act Supplier Receive CTQ requirements from Engineer Manufacture product to Engineer’s specifications Implement a random sampling plan and quality assurance program Provide a Certificate if Analysis (C of A) with each shipment Purchasing Receive CTQ requirements from Engineer Order 1018 CRS to Engineer’s specification Establish Supplier Audit Procedures Specify a Certificate of Analysis (C of A) must accompany each shipment of 1018 CRS Engineering Design and Develop 1018 Annealed Product Specification Implement internal inspection on incoming shipments of 1018 CRS Implement a random sampling plan. Perform testing and analysis on samples of 1018 CRS Verify against a C of A that comes with each shipment. Implement a Corrective action plan for nonconformance products. CORRECTIVE ACTION PLAN FOR NON CONFORMANCE OF 1018 ANNEALED PRODUCTS If the samples that are tested do not conform to product specifications, engineering takes the following actions: 1) Engineering completes a non-conformance report with data analysis results. 2) Engineering notifies purchasing with a non-conformance report with the data analysis results. 3) Purchasing notifies the Supplier of non-conformance report and results 4) Supplier investigates the non-conformance 5) Supplier responds to purchasing with a specified period of time 6) Purchasing notifies engineering for Supplier’s actions 7) Engineering enters non-conformance, data analysis, supplier correspondence and outcome in records control system.
- 52. Fatigue Analysis Report 2011-1-0610-403-GRO1 RochesterInstitute of Technology 52 Start Haveyoubeen trainedonFatigue Tester? Doyouhavepart totest? Yes Isthelabavailable touse? Yes Doesyourgroup havethelabsigned out? Yes Gettrainedbyalab techinthelab. No SeeLabtechto obtainsampleparts. No Findoutwhenthe labisavailableby lookingatthe schedule. No SignouttheLab onlinebyemailing MikeCaldwell. No BeginFatigueTestYes Unscrewthefour boltsthatsecurethe cageandcoversthe testpart. Removethecollet fromtheFatigue Machine. Loosentheforce knobtoremoveall forcesothepartcan beplacedinthe FatigueMachine. Placearoundhalf inchendofthetest specimen. Feedthesmaller, milledendofthe specimenthatis attachedtotheload knob. Placecolletinhalf inchspecimenend intofatigue machine. Threadthebolton totheFatigue Machinethatholds thecolletinplace. Tightenthebolt withthe2provided wrenches. Placethecageback overthetestpart. Fingertightenall fourboltsthat securethecage. Turnonfatigue Machinebypressing powerbutton. Areboth revolution counterssetto zero. Doyouhaveaforce selectedtosupplytothe part? Yes Getanothertechto assiststartingthe machine. Pressthestart button. Immediatelyafterthe machineisstarted,rotate theloadknobuntil desiredforceisachieved onforcegage. Pressthereset buttononeach revolutioncounter. No ReferenceyourSN- Diagramand determineaforceto testattoachieve desiredpoint. No Oncedesiredforce isreached,pressthe resetbuttononthe revolutioncounter. Letthepartrunin themachine. DiditBreak? Letthepartrununtil itreaches1million cycles. No Pressstopbuttonon topofpanel. Recordthe revolutionsfrom both“motorend” revolutioncounter andthe“partend” revolutioncounter. Yes Loosenthefour boltsonthesafety cage. Removethesafety cage. Loosenthebolton thecolletwiththe twowrenches. Removespecimen andcolletfrom FatigueMachine. Removethecollet fromthetest specimen. Placethecolletand thewrenchesonthe workbench. TurnofftheFatigue Machinebypressing thepowerbutton. End Yes ProcessFlowChart FatigueTestingProcedure
- 53. Fatigue Analysis Report 2011-1-0610-403-GRO1 RochesterInstitute of Technology 53 HighLevel SIPOC ReceiveCTQfrom Customer Order12'rodsfrom Manufacturer Receive12'rodsfrom Manufacturer LoadRodsinmachines forfabricationof specimens Inspectspecimens afterfrabrication HighLevelSIPOC Loadspecimensinbin forpickup Pickup1018 Specimensfrom Supplier CompleteProject Performothertestsas neededforfurther analysis Providestatusreport outs Performtesting/ breakinganalysis Receivelecturesand trainingfortestingand breaking Research1018 PublishedData ReceiveCustomer CTQ’sCompleteFatigue AnalysisReporton 1018Specimens Receive Customer Approval ThatCTQ Hasbeen Met
- 54. Fatigue Analysis Report 2011-1-0610-403-GRO1 RochesterInstitute of Technology 54 BoxPlotStatistics onTesting Pre- Annealed Sut Post Annealed Sut Published Data hrb Pre- Anneal Tensile Pre- Anneal Tensile (From HRB) Pre- Anneal Fatigue hrb Post- Anneal Tensile Post- Anneal Tensile (From HRB) Post- Anneal Fatigue 63.5 95.8 105.9 99.5 66.4 60.9 62.3 63.2 67.5 91.1 94.3 94.6 67.0 32.1 61.8 33.3 91.4 96.3 94.9 73.9 45.7 61.9 47.4 91.4 104.9 94.9 79.2 50.0 62.5 51.9 91.9 95.4 82.4 50.3 62.5 52.2 91.9 95.4 84.2 51.4 53.4 92.0 95.5 85.3 51.5 53.5 92.1 95.6 86.6 51.6 53.6 92.4 95.9 164.4 52.8 54.8 95.4 99.0 53.1 55.1 96.2 99.9 53.6 55.6 96.2 99.9 55.3 57.4 97.9 101.6 56.8 59.0 98.2 101.9 57.0 59.2 98.3 102.0 57.3 59.5 98.4 102.2 59.9 62.2 60.0 62.3 60.5 62.8 60.6 62.9 61.5 63.8 61.9 64.3 62.0 64.4 62.0 64.4 62.1 64.5 63.1 65.5
- 55. Fatigue Analysis Report 2011-1-0610-403-GRO1 RochesterInstitute of Technology 55 Real: Published HRB Pre-A Ten Pre-A Hard Pre-A Fat HRB A Ten A Hard A Fatigue Min 63.5 91.1 94.3 94.6 66.4 32.1 61.8 33.3 67.5 Q1 91.9 95.8 95.4 73.9 51.6 61.9 53.6 67.5 Med 93.9 100.6 97.5 82.4 57.0 62.3 59.2 67.5 Q3 96.6 105.2 100.3 85.3 60.9 62.5 63.2 67.5 Max 98.4 105.9 102.2 164.4 63.1 62.5 65.5 67.5 Mean 94.4 100.4 98.0 87.7 55.7 62.2 57.8 All unitsin KSI 0.0 20.0 40.0 60.0 80.0 100.0 120.0 140.0 160.0 180.0 Published Pre-A Ten Pre-A Hard Pre-A Fat A Ten A Hard A Fatigue 1018 CRS Comparative Box Plot
- 56. Fatigue Analysis Report 2011-1-0610-403-GRO1 RochesterInstitute of Technology 56 Two SampleT-Test:NonAnnealed/Annealed With a 95% confidence our null hypothesis for the report was that if each team was distributed the same 1018 Cold Rolled Steel, then all samples distributed should be within the range of the published tensile strength. For most groups this null hypothesis was accepted, but our results gave us a smaller variance from the published results. This smaller variance resulted in a low two tail P value. Sample # UTS (ksi) Group # Grp 1 S2 Published 1 62.3 Group 1 Sec 2 62.3 63.4 2 61.8 61.8 63.4 3 61.7 61.7 63.4 4 62.5 62.5 63.4 5 62.5 62.5 63.4 6 61.8 Group 6 Sec 1 7 62.9 8 62.6 9 61 10 61.1 Group 4 Sec 1 11 61.8 12 62.7 13 62.2 14 63.9 15 61 Group 3 Sec 1 16 63.1 17 59.5 18 60.9 19 62.5 Group 1 Sec 1 20 61.1 21 62.5 22 61.4 Avg= 61.945 S= 1.07095
- 57. Fatigue Analysis Report 2011-1-0610-403-GRO1 RochesterInstitute of Technology 57 Grp1 Sec2 Published Mean 62.16 63.4 Variance 0.0148 0 Observations 5 5 Hypothesized Mean Difference 0 df 4 t stat -7.20735 P(T<=t)onetail 0.000982 t critical one tail 2.131847 P(T<=t)twotail 0.001965 t critical twotail 2.776445 Ho:u1=up Ha:u1 does not equal Since the p value is less than 0.05, then we reject the null hypothesis There are some factors that we have to take into account to determine why our P value was so much smaller than that of other groups. There is nothing that we found that directly caused such a low P value, but there had to be some kind of discrepancy with the data collected among the four tests.
- 58. Fatigue Analysis Report 2011-1-0610-403-GRO1 RochesterInstitute of Technology 58 ANOVA An anova calculation is an analysis of variance between multiple groups of data to determine the statistical significance between the means of these groups. The data below was accumulated from 9 different groups preforming the same experiment with the same set of 1018 cold rolled steel samples. group1 s1 grp3 s1 grp 1 s2 grp6 s1 grp4 s1 grp2 s2 grp7 s1 grp2 s1 gr5 s1 93.7 93 105.9 100.5 92.1 95.6 94.7 92.9 94.2 91.5 94 104..9 92 94.3 94.2 96.1 93.4 92.9 93.2 93.3 95.3 94.9 96.2 93.8 95.2 93.4 96.1 93.6 104.4 94.3 96.7 94.5 95.7 94.8 93.9 95.6 93.6 95.1 100.1 96 95.3 95 92 102.6 95.5 106.4 95.7 96.1 102.2 91 92.9 95 92.8 96.4 93 94 101.1 97.8 94.4 96.5 93 90.6 93.6 94.7 103 94.8 Anova:SingleFactor Summary Groups Count Sum Average Variance Group 1 s1 10 946.8 94.68 19.79955556 Grp3 s1 8 769.246 96.156 18.14149764 Grp1 s2 5 500.5 100.1 28.34 Grp6 s1 8 779.332 97.417 19.27150229 Grp4 s1 4 377.0553 94.264 2.774714276 Grp2 s2 9 851.1 94.567 1.1225 Grp7 s1 10 954.3 95.43 0.564555556 Grp2 s1 8 753.87 94.234 10.74982679 Grp5 s1 4 378.8 94.7 2.08666667
- 59. Fatigue Analysis Report 2011-1-0610-403-GRO1 RochesterInstitute of Technology 59 ANOVA Source of Variation SS df MS F P-Value F crit Between Groups 173.766 8 21.721 1.883470962 0.08047624 2.1056 Within Groups 657.3409 57 11.532 Total 831.1069 65 Ho: u1=u3=u1=u6=u4=u2=u7 Ha: u1 does not=u3 does not =u1 does not= u6 does not=u4 does not=u2 does not=u7 If the p is < or =0.05, then reject the null hypothesis If the p is > 0.05, then fail to reject the null hypothesis After analyzing the data, we failed to reject the null hypothesis do to our calculated P value. Our P value was 0.08 which is larger than 0.05 cut off point for 95% confidence.
- 60. Fatigue Analysis Report 2011-1-0610-403-GRO1 RochesterInstitute of Technology 60 CauseandEffect FatigueDiagram Difference Between Published And Actual People Measurement EquipmentMaterials ProcessesEnvironment 1018Steel Testing Specifications FatigueTesting TrainingProcedures Calibration Trainer Experience Training RoomConditions Location RoomSetup ProjectPlan TrainingProcedures OperatingInstructions TestResults Typesof Measurements EquipmentCalibration
- 61. Fatigue Analysis Report 2011-1-0610-403-GRO1 RochesterInstitute of Technology 61 CauseandEffect Material Diagram 1018 Material Fatigue Characteristics People Measurement EquipmentMaterials ProcessesEnvironment 1018Steel Specifications TensileTesting SparkTesting Trainer Quenching IndustryStandards Annealing Process IMRTesting Metallography Testing HardnessTesting Machining Tempering Normalizing
- 62. Fatigue Analysis Report 2011-1-0610-403-GRO1 RochesterInstitute of Technology 62 C & E Checklist
- 63. Fatigue Analysis Report 2011-1-0610-403-GRO1 RochesterInstitute of Technology 63 Appendix M Meeting Notes Meeting # 1 Date: 9-15-2011 Tasks Gathered test samples Scheduled training with TA Took measurements of samples Discussed Project Plan Questions How does the fillet affect the size ratio and the moment arm? o It makes it stronger because if it were a 90 degree cut the stress concentration factor would be different. Meeting # 2 Date: 9-19-11 *Full Attendance* Task Worked on S-N Diagram to determine testing loads Project Plan Meeting # 3 Date: 9-21-11 Meeting # 4 Date: 9-26-11 Finished SN diagram with loads Meeting # 5 Date: 10-03-11 Set a break time with TA Began gathering data from other groups Analyzed the discrepancies encountered from the first three tested parts. -The last three parts tested were over the calculated S-N curve which draws other questions about the quality of the material given.
- 64. Fatigue Analysis Report 2011-1-0610-403-GRO1 RochesterInstitute of Technology 64 Meeting # 6 Date: 10-10-11 Assigned members to selected groups Distributed different sections of the lab report to certain members of the team. Analyzed the results from the most recent breaks. -The fourth part that was tested, had a 157 N load applied and ran for 103,119 cycles taking close to 30 minutes to break. -The fifth part was loaded at 90 N for 3,853,055 cycles and did not fail. -Since the part greatly exceeded the curve calculated in the S-N diagram, the piece theoretically never would have failed Meeting # 7 Date: 10-17-11 Finished SN diagram with loads Finished Rockwell Hardness testing on four different specimens Finished Tensile Testing of four different specimens -All values were what we expected and gave us a new specified tensile strength for the specimens Meeting # 8 Date: 10-24-11 On schedule for the report write up Finished the metallurgy test on two different specimens -One longitudinally and one transversely Got approval for the testing of annealed samples Meeting #9 Date: 10-31-11 Tested 5 annealed specimens over the weekend -All 5 tested for fatigue & Tensile -During the Tensile test the graph results were misplaced but the number values were still recorded. Hardness Testing completed on annealed specimens
- 65. Fatigue Analysis Report 2011-1-0610-403-GRO1 RochesterInstitute of Technology 65 References 1) Norton, Robert L. Machine Design: an Integrated Approach. Boston: Prentice Hall, 2011. Print. 2) Hibbeler, R. C. Statics and Mechanics of Materials. Boston: Prentice Hall, 2011. Print. 3) Online Materials Information Resource - MatWeb.Web. 04 Nov. 2011. http://www.matweb.com/. 4) Published images provided by http://www.metallographic.com/ 5) ASTM Standard E930 6) "Appendix 1—Rockwell/Brinell Hardness Conversion." Technical Data.Kennametal.Web. 8 Nov. 2011. <http://www.kennametal.com/images/pdf/techRef/milling/rockwellBrinde llHardnessConv.pdf>. 7) http://resources.schoolscience.co.uk/corus/16plus/steelch2pg3.html 8) http://www.substech.com/dokuwiki/doku.php?id=annealing_and_stress_rel ief 9) http://www.carbidedepot.com/formulas-hardness.htm 10)Failure Mechanics Section 1 (Group Data)