

Recomendados
Recomendados
Mais conteúdo relacionado
Último
Último (20)
Destaque
Destaque (20)
May 2012 MLS Statistics
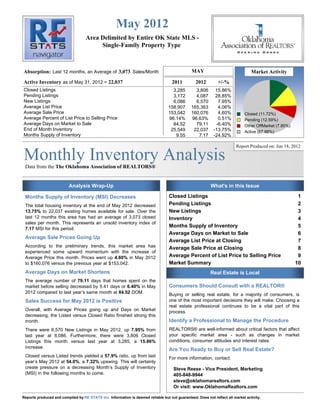
- 1. May 2012 Area Delimited by Entire OK State MLS - Single-Family Property Type Absorption: Last 12 months, an Average of 3,073 Sales/Month MAY Market Activity Active Inventory as of May 31, 2012 = 22,037 2011 2012 +/-% Closed Listings 3,285 3,806 15.86% Pending Listings 3,172 4,087 28.85% New Listings 6,086 6,570 7.95% Average List Price 158,907 165,363 4.06% Average Sale Price 153,042 160,076 4.60% Closed (11.72%) Average Percent of List Price to Selling Price 96.14% 96.63% 0.51% Pending (12.59%) Average Days on Market to Sale 84.52 79.11 -6.40% Other OffMarket (7.80%) End of Month Inventory 25,549 22,037 -13.75% Active (67.88%) Months Supply of Inventory 9.55 7.17 -24.92% Report Produced on: Jun 18, 2012 Monthly Inventory Analysis Data from the The Oklahoma Association of REALTORS® Analysis Wrap-Up What's in this Issue Months Supply of Inventory (MSI) Decreases Closed Listings 1 The total housing inventory at the end of May 2012 decreased Pending Listings 2 13.75% to 22,037 existing homes available for sale. Over the New Listings 3 last 12 months this area has had an average of 3,073 closed Inventory 4 sales per month. This represents an unsold inventory index of Months Supply of Inventory 5 7.17 MSI for this period. Average Days on Market to Sale 6 Average Sale Prices Going Up Average List Price at Closing 7 According to the preliminary trends, this market area has Average Sale Price at Closing 8 experienced some upward momentum with the increase of Average Price this month. Prices went up 4.60% in May 2012 Average Percent of List Price to Selling Price 9 to $160,076 versus the previous year at $153,042. Market Summary 10 Average Days on Market Shortens Real Estate is Local The average number of 79.11 days that homes spent on the market before selling decreased by 5.41 days or 6.40% in May Consumers Should Consult with a REALTOR® 2012 compared to last year’s same month at 84.52 DOM. Buying or selling real estate, for a majority of consumers, is Sales Success for May 2012 is Positive one of the most important decisions they will make. Choosing a real estate professional continues to be a vital part of this Overall, with Average Prices going up and Days on Market process. decreasing, the Listed versus Closed Ratio finished strong this month. Identify a Professional to Manage the Procedure There were 6,570 New Listings in May 2012, up 7.95% from REALTORS® are well-informed about critical factors that affect last year at 6,086. Furthermore, there were 3,806 Closed your specific market area - such as changes in market Listings this month versus last year at 3,285, a 15.86% conditions, consumer attitudes and interest rates. increase. Are You Ready to Buy or Sell Real Estate? Closed versus Listed trends yielded a 57.9% ratio, up from last For more information, contact: year’s May 2012 at 54.0%, a 7.32% upswing. This will certainly create pressure on a decreasing Month’s Supply of Inventory Steve Reese - Vice President, Marketing (MSI) in the following months to come. 405-848-9944 steve@oklahomarealtors.com Or visit: www.OklahomaRealtors.com Reports produced and compiled by RE STATS Inc. Information is deemed reliable but not guaranteed. Does not reflect all market activity.
- 2. Monthly Inventory Analysis Data from the The Oklahoma Association of REALTORS® May 2012 Closed Sales as of Jun 14, 2012 Closed Listings Report Produced on: Jun 18, 2012 Area Delimited by Entire OK State MLS - Single-Family Property Type MAY YEAR TO DATE (YTD) 2008 2009 2010 2011 2012 2008 2009 2010 2011 2012 3,906 3,819 3,806 15,782 15,348 14,677 3,331 3,285 13,447 13,144 1 Year 1 Year +15.86% +16.77% 2 Year 2 Year -0.34% +4.57% 5 YEAR MARKET ACTIVITY TRENDS 5yr MAY AVG = 3,629 3 MONTHS 5,000 High M 3,310 Jul 2008 = 4,047 A 4,000 Low R 3,000 Jan 2010 = 1,695 A 3,347 P Closed Listings 2,000 Closed Listings this R 1.12% 1,000 month at 3,806, above the 5 yr MAY M 3,806 A 0 Jun 2008 Dec 2008 Jun 2009 Dec 2009 Jun 2010 Dec 2010 Jun 2011 Dec 2011 average of 3,629 Y 13.71% CLOSED LISTINGS & BEDROOMS DISTRIBUTION BY PRICE Distribution of Closed Listings by Price Range % AVDOM 2 Beds 3 Beds 4 Beds 5 Beds+ $25,000 and less 129 3.39% 69.2 63 55 11 0 $25,001 $75,000 623 16.37% 81.0 215 362 44 2 $75,001 $100,000 462 12.14% 78.5 117 308 34 3 $100,001 Contact an experienced REALTOR Ready to Buy or Sell Real Estate? $150,000 1,006 26.43% 73.7 186 676 137 7 $150,001 $200,000 689 18.10% 76.2 98 385 196 10 $200,001 $275,000 462 12.14% 77.5 62 159 226 15 $275,001 and up 435 11.43% 98.8 33 108 245 49 Total Closed Units: 3,806 79.1 774 2053 893 86 Total Closed Volume: 609,248,738 89.42M 275.64M 212.33M 31.86M Average Closed Price: $160,076 $115,535 $134,262 $237,769 $370,423 Reports produced and compiled by RE STATS Inc. Information is deemed reliable but not guaranteed. Does not reflect all market activity. pp. 1 Steve Reese 405-848-9944 steve@oklahomarealtors.com
- 3. Monthly Inventory Analysis Data from the The Oklahoma Association of REALTORS® May 2012 Pending Listings as of Jun 14, 2012 Pending Listings Report Produced on: Jun 18, 2012 Area Delimited by Entire OK State MLS - Single-Family Property Type MAY YEAR TO DATE (YTD) 2008 2009 2010 2011 2012 2008 2009 2010 2011 2012 3,748 4,087 18,377 3,616 17,580 3,172 15,804 16,501 2,345 14,820 1 Year 1 Year +28.85% +24.00% 2 Year 2 Year +74.29% +11.37% 5 YEAR MARKET ACTIVITY TRENDS 5yr MAY AVG = 3,394 3 MONTHS 5,000 High M 3,822 Apr 2010 = 4,815 A 4,000 Low R 3,000 Dec 2009 = 2,009 A 4,068 P Pending Listings 2,000 Pending Listingsthis R 6.44% 1,000 month at 4,087, above the 5 yr MAY M 4,087 A 0 Jun 2008 Dec 2008 Jun 2009 Dec 2009 Jun 2010 Dec 2010 Jun 2011 Dec 2011 average of 3,394 Y 0.47% PENDING LISTINGS & BEDROOMS DISTRIBUTION BY PRICE Distribution of Pending Listings by Price Range % AVDOM 2 Beds 3 Beds 4 Beds 5 Beds+ $25,000 and less 151 3.69% 50.1 72 70 8 1 $25,001 $75,000 649 15.88% 76.6 202 390 47 10 $75,001 $100,000 494 12.09% 72.4 138 307 48 1 $100,001 Contact an experienced REALTOR Ready to Buy or Sell Real Estate? $150,000 1,087 26.60% 69.9 183 764 137 3 $150,001 $200,000 750 18.35% 76.5 103 425 211 11 $200,001 $275,000 481 11.77% 77.7 54 184 224 19 $275,001 and up 475 11.62% 94.2 45 110 259 61 Total Pending Units: 4,087 90.0 797 2250 934 106 Total Pending Volume: 682,675,378 93.38M 305.07M 242.05M 42.16M Average Listing Price: $158,934 $117,168 $135,589 $259,158 $397,770 Reports produced and compiled by RE STATS Inc. Information is deemed reliable but not guaranteed. Does not reflect all market activity. pp. 2 Steve Reese 405-848-9944 steve@oklahomarealtors.com
- 4. Monthly Inventory Analysis Data from the The Oklahoma Association of REALTORS® May 2012 New Listings as of Jun 14, 2012 New Listings Report Produced on: Jun 18, 2012 Area Delimited by Entire OK State MLS - Single-Family Property Type MAY YEAR TO DATE (YTD) 2008 2009 2010 2011 2012 2008 2009 2010 2011 2012 6,641 6,570 31,534 31,367 6,086 30,287 29,605 5,681 5,116 27,494 1 Year 1 Year +7.95% +5.95% 2 Year 2 Year +28.42% +3.57% 5 YEAR MARKET ACTIVITY TRENDS 5yr MAY AVG = 6,019 3 MONTHS 8,000 High M 6,568 7,000 Apr 2010 = 7,619 A 6,000 Low R 5,000 Dec 2008 = 3,505 A 6,701 4,000 P New Listings 3,000 New Listings this R 2.02% 2,000 month at 6,570, 1,000 above the 5 yr MAY M 6,570 A 0 Jun 2008 Dec 2008 Jun 2009 Dec 2009 Jun 2010 Dec 2010 Jun 2011 Dec 2011 average of 6,019 Y -1.95% NEW LISTINGS & BEDROOMS DISTRIBUTION BY PRICE Distribution of New Listings by Price Range % 2 Beds 3 Beds 4 Beds 5 Beds+ $50,000 and less 547 8.33% 226 288 31 2 $50,001 $75,000 607 9.24% 218 338 46 5 $75,001 $100,000 708 10.78% 160 475 70 3 $100,001 Contact an experienced REALTOR Ready to Buy or Sell Real Estate? $175,000 2,282 34.73% 379 1,539 345 19 $175,001 $225,000 868 13.21% 114 432 301 21 $225,001 $325,000 915 13.93% 113 338 418 46 $325,001 and up 643 9.79% 68 141 315 119 Total New Listed Units: 6,570 1278 3551 1526 215 Total New Listed Volume: 1,266,733,606 194.96M 535.64M 436.04M 100.10M Average New Listed Listing Price: $200,091 $152,553 $150,842 $285,738 $465,561 Reports produced and compiled by RE STATS Inc. Information is deemed reliable but not guaranteed. Does not reflect all market activity. pp. 3 Steve Reese 405-848-9944 steve@oklahomarealtors.com
- 5. Monthly Inventory Analysis Data from the The Oklahoma Association of REALTORS® May 2012 Active Inventory as of Jun 14, 2012 Active Inventory Report Produced on: Jun 18, 2012 Area Delimited by Entire OK State MLS - Single-Family Property Type END OF MAY ACTIVE DURING MAY 2008 2009 2010 2011 2012 2008 2009 2010 2011 2012 25,538 31,032 23,301 29,194 28,630 22,530 22,037 21,165 26,822 26,769 1 Year 1 Year -13.71% -7.74% 2 Year 2 Year -2.19% +6.95% 5 YEAR MARKET ACTIVITY TRENDS 5yr MAY AVG = 22,914 3 MONTHS Active Inventory 30,000 High M 21,865 Jul 2011 = 26,595 A Low R 20,000 Jan 2008 = 19,337 A 22,075 P 10,000 Inventory this R 0.96% month at 22,037, below the 5 yr MAY M 22,037 A 0 Jun 2008 Dec 2008 Jun 2009 Dec 2009 Jun 2010 Dec 2010 Jun 2011 Dec 2011 average of 22,914 Y -0.17% INVENTORY & BEDROOMS DISTRIBUTION BY PRICE Distribution of Inventory by Price Range % AVDOM 2 Beds 3 Beds 4 Beds 5 Beds+ $50,000 and less 1,894 8.59% 123.0 945 821 111 17 $50,001 $75,000 2,307 10.47% 113.5 851 1,292 140 24 $75,001 $100,000 2,603 11.81% 110.1 688 1,641 241 33 $100,001 Contact an experienced REALTOR Ready to Buy or Sell Real Estate? $175,000 6,952 31.55% 95.1 1,204 4,552 1,118 78 $175,001 $225,000 2,630 11.93% 95.3 393 1,285 880 72 $225,001 $350,000 3,378 15.33% 97.8 441 1,195 1,519 223 $350,001 and up 2,273 10.31% 115.0 216 474 1,081 502 Total Active Inventory by Units: 22,037 103.7 4,738 11,260 5,090 949 Total Active Inventory by Volume: 4,368,216,473 634.66M 1.75B 1.45B 530.42M Average Active Inventory Listing Price: $198,222 $133,952 $155,309 $285,728 $558,927 Reports produced and compiled by RE STATS Inc. Information is deemed reliable but not guaranteed. Does not reflect all market activity. pp. 4 Steve Reese 405-848-9944 steve@oklahomarealtors.com
- 6. Monthly Inventory Analysis Data from the The Oklahoma Association of REALTORS® May 2012 Active Inventory as of Jun 14, 2012 Months Supply of Inventory Report Produced on: Jun 18, 2012 Area Delimited by Entire OK State MLS - Single-Family Property Type MSI FOR MAY INDICATORS FOR MAY 2012 2008 2009 2010 2011 2012 Inventory Closed Absorption MSI MSI % 9.5 36,877 7.2 13.945% 7.2 22,037 6.7 6.9 7.0 1 Year 3,073 End of Closed Average Months Percent -24.89% Month Last Closed per Supply Months 2 Year Active 12 Month over of Supply of +2.72% Inventory Months 12 Months Inventory Inventory 5 YEAR MARKET ACTIVITY TRENDS 5yr MAY AVG = 7.5 3 MONTHS 10 High M 7.3 9 Jun 2011 = 9.9 A 8 Low R 7 6 Jan 2008 = 5.3 A 7.3 5 P Months Supply 4 Months Supply this R 0.36% 3 2 month at 7.2, 1 below the 5 yr MAY M 7.2 A 0 Jun 2008 Dec 2008 Jun 2009 Dec 2009 Jun 2010 Dec 2010 Jun 2011 Dec 2011 average of 7.5 Y -1.58% MONTHS SUPPLY & BEDROOMS DISTRIBUTION BY PRICE Distribution of Active Inventory by Price Range and MSI % MSI 2 Beds 3 Beds 4 Beds 5 Beds+ $50,000 and less 1,894 8.59% 4.3 5.2 3.6 3.7 5.4 $50,001 $80,000 2,885 13.09% 7.4 9.4 6.7 6.2 9.4 $80,001 $110,000 2,761 12.53% 6.6 7.7 6.3 6.3 10.3 $110,001 Contact an experienced REALTOR Ready to Buy or Sell Real Estate? $170,000 5,895 26.75% 6.4 7.1 6.3 6.3 6.4 $170,001 $240,000 3,571 16.20% 7.4 8.9 7.7 6.5 7.8 $240,001 $350,000 2,758 12.52% 9.9 13.2 10.8 8.7 9.9 $350,001 and up 2,273 10.31% 15.4 22.2 16.5 13.3 18.1 MSI: 7.2 7.7 6.6 7.6 11.8 Total Active Inventory: 22,037 4,738 11,260 5,090 949 Reports produced and compiled by RE STATS Inc. Information is deemed reliable but not guaranteed. Does not reflect all market activity. pp. 5 Steve Reese 405-848-9944 steve@oklahomarealtors.com
- 7. Monthly Inventory Analysis Data from the The Oklahoma Association of REALTORS® May 2012 Closed Sales as of Jun 14, 2012 Average Days on Market to Sale Report Produced on: Jun 18, 2012 Area Delimited by Entire OK State MLS - Single-Family Property Type MAY YEAR TO DATE (YTD) 2008 2009 2010 2011 2012 2008 2009 2010 2011 2012 86 85 92 81 86 88 87 79 73 78 1 Year 1 Year -6.40% -5.52% 2 Year 2 Year +8.93% +11.90% 5 YEAR MARKET ACTIVITY TRENDS 5yr MAY AVG = 81 3 MONTHS Average Days on Market 100 High M 94 90 Mar 2011 = 97 A 80 Low R 70 60 May 2010 = 73 A 83 50 P 40 Average DOM this R -11.23% 30 20 month at 79, 10 below the 5 yr MAY M 79 A 0 Jun 2008 Dec 2008 Jun 2009 Dec 2009 Jun 2010 Dec 2010 Jun 2011 Dec 2011 average of 81 Y -4.81% AVERAGE DOM OF CLOSED SALES & BEDROOMS DISTRIBUTION BY PRICE Distribution of Average Days on Market to Sale by Price Range % AVDOM 2 Beds 3 Beds 4 Beds 5 Beds+ $25,000 and less 129 3.39% 69.2 59.7 73.8 100.5 0.0 $25,001 $75,000 623 16.37% 81.0 91.0 77.0 65.4 48.5 $75,001 $100,000 462 12.14% 78.5 84.6 75.7 83.9 65.0 $100,001 Contact an experienced REALTOR Ready to Buy or Sell Real Estate? $150,000 1,006 26.43% 73.7 92.0 65.0 84.2 217.9 $150,001 $200,000 689 18.10% 76.2 88.8 75.5 69.8 107.2 $200,001 $275,000 462 12.14% 77.5 83.3 76.7 75.0 99.9 $275,001 and up 435 11.43% 98.8 190.0 84.1 93.4 97.0 Average Closed DOM: 79.1 91.1 72.9 80.5 106.3 Total Closed Units: 3,806 774 2053 893 86 Total Closed Volume: 609,248,738 89.42M 275.64M 212.33M 31.86M Reports produced and compiled by RE STATS Inc. Information is deemed reliable but not guaranteed. Does not reflect all market activity. pp. 6 Steve Reese 405-848-9944 steve@oklahomarealtors.com
- 8. Monthly Inventory Analysis Data from the The Oklahoma Association of REALTORS® May 2012 Closed Sales as of Jun 14, 2012 Average List Price at Closing Report Produced on: Jun 18, 2012 Area Delimited by Entire OK State MLS - Single-Family Property Type MAY YEAR TO DATE (YTD) 2008 2009 2010 2011 2012 2008 2009 2010 2011 2012 165,363 155,649 156,511 158,907 151,685 153,155 148,619 146,579 148,539 144,587 1 Year 1 Year +4.06% +2.61% 2 Year 2 Year +7.97% +6.19% 5 YEAR MARKET ACTIVITY TRENDS 5yr MAY AVG = 156K 3 MONTHS Average List Price 200,000 High M 154,853 May 2012 = 165,363 A Low R Nov 2008 = 135,798 A 158,659 100,000 P Average LPrice this R 2.46% month at 165,363, above the 5 yr MAY M 165,363 A 0 Jun 2008 Dec 2008 Jun 2009 Dec 2009 Jun 2010 Dec 2010 Jun 2011 Dec 2011 average of 156,495 Y 4.23% AVERAGE LIST PRICE OF CLOSED SALES & BEDROOMS DISTRIBUTION BY PRICE Distribution of Average List Price at Closing by Price Range % AVL$ 2 Beds 3 Beds 4 Beds 5 Beds+ $25,000 and less 104 2.73% 18,000 20,338 21,579 18,798 0 $25,001 $75,000 588 15.45% 52,357 55,786 56,378 57,698 40,000 $75,001 $100,000 494 12.98% 89,379 91,445 91,604 97,843 81,833 $100,001 Contact an experienced REALTOR Ready to Buy or Sell Real Estate? $150,000 980 25.75% 128,406 130,889 129,662 132,794 133,114 $150,001 $200,000 719 18.89% 173,764 176,796 175,899 177,621 182,948 $200,001 $275,000 455 11.95% 236,672 236,339 239,829 242,420 246,993 $275,001 and up 466 12.24% 416,520 388,190 378,324 427,267 545,893 Average List Price: $165,363 $120,296 $138,419 $244,732 $390,005 Total Closed Units: 3,806 774 2053 893 86 Total List Volume: 629,369,679 93.11M 284.17M 218.55M 33.54M Reports produced and compiled by RE STATS Inc. Information is deemed reliable but not guaranteed. Does not reflect all market activity. pp. 7 Steve Reese 405-848-9944 steve@oklahomarealtors.com
- 9. Monthly Inventory Analysis Data from the The Oklahoma Association of REALTORS® May 2012 Closed Sales as of Jun 14, 2012 Average Sold Price at Closing Report Produced on: Jun 18, 2012 Area Delimited by Entire OK State MLS - Single-Family Property Type MAY YEAR TO DATE (YTD) 2008 2009 2010 2011 2012 2008 2009 2010 2011 2012 160,076 150,053 151,997 153,042 144,062 145,470 148,164 141,438 143,580 139,351 1 Year 1 Year +4.60% +3.15% 2 Year 2 Year +8.04% +6.09% 5 YEAR MARKET ACTIVITY TRENDS 5yr MAY AVG = 151K 3 MONTHS Average Sold Price 200,000 High M 148,883 May 2012 = 160,076 A Low R Nov 2008 = 131,055 A 153,414 100,000 P Average SPrice this R 3.04% month at 160,076, above the 5 yr MAY M 160,076 A 0 Jun 2008 Dec 2008 Jun 2009 Dec 2009 Jun 2010 Dec 2010 Jun 2011 Dec 2011 average of 151,372 Y 4.34% AVERAGE SOLD PRICE OF CLOSED SALES & BEDROOMS DISTRIBUTION BY PRICE Distribution of Average Sold Price at Closing by Price Range % AVS$ 2 Beds 3 Beds 4 Beds 5 Beds+ $25,000 and less 129 3.39% 17,687 17,087 18,823 15,445 0 $25,001 $75,000 623 16.37% 52,423 51,709 53,170 50,373 39,000 $75,001 $100,000 462 12.14% 88,364 88,101 88,293 90,315 83,683 $100,001 Contact an experienced REALTOR Ready to Buy or Sell Real Estate? $150,000 1,006 26.43% 126,900 126,489 126,503 129,243 130,271 $150,001 $200,000 689 18.10% 172,562 171,092 172,195 174,005 172,834 $200,001 $275,000 462 12.14% 235,014 229,184 233,996 236,979 240,310 $275,001 and up 435 11.43% 410,001 376,337 362,473 414,294 515,969 Average Closed Price: $160,076 $115,535 $134,262 $237,769 $370,423 Total Closed Units: 3,806 774 2053 893 86 Total Closed Volume: 609,248,738 89.42M 275.64M 212.33M 31.86M Reports produced and compiled by RE STATS Inc. Information is deemed reliable but not guaranteed. Does not reflect all market activity. pp. 8 Steve Reese 405-848-9944 steve@oklahomarealtors.com
- 10. Monthly Inventory Analysis Data from the The Oklahoma Association of REALTORS® May 2012 Closed Sales as of Jun 14, 2012 Average Percent of List Price to Selling Price Report Produced on: Jun 18, 2012 Area Delimited by Entire OK State MLS - Single-Family Property Type MAY YEAR TO DATE (YTD) 2008 2009 2010 2011 2012 2008 2009 2010 2011 2012 97.13% 96.73% 96.83% 96.45% 96.63% 96.10% 96.38% 95.88% 96.14% 95.68% 1 Year 1 Year +0.51% +0.44% 2 Year 2 Year -0.21% -0.36% 5 YEAR MARKET ACTIVITY TRENDS 5yr MAY AVG=96.62% 3 MONTHS Average List/Sell Price 98 High M 95.69% May 2008 = 97.13% A Low R 97 Jan 2011 = 95.15% A 96.70% P 96 Average List/Sell this R 1.05% month at 96.63%, above the 5 yr MAY M 96.63% A 95 Jun 2008 Dec 2008 Jun 2009 Dec 2009 Jun 2010 Dec 2010 Jun 2011 Dec 2011 average of 96.62% Y -0.08% AVERAGE L/S% OF CLOSED SALES & BEDROOMS DISTRIBUTION BY PRICE Distribution of $avgmed L/S % by Price Range % AVL/S% 2 Beds 3 Beds 4 Beds 5 Beds+ $25,000 and less 129 3.39% 88.62% 86.70% 91.29% 86.26% 0.00% $25,001 $75,000 623 16.37% 94.39% 93.60% 95.21% 91.45% 96.67% $75,001 $100,000 462 12.14% 96.59% 97.14% 96.69% 93.33%102.47% $100,001 Contact an experienced REALTOR Ready to Buy or Sell Real Estate? $150,000 1,006 26.43% 97.53% 96.75% 97.72% 97.60% 98.36% $150,001 $200,000 689 18.10% 97.90% 97.16% 98.01% 98.21% 95.03% $200,001 $275,000 462 12.14% 97.80% 97.13% 97.70% 98.08% 97.54% $275,001 and up 435 11.43% 96.91% 96.59% 96.42% 97.39% 95.77% Average List/Sell Ratio: 96.60% 95.19% 96.93% 97.19% 96.45% Total Closed Units: 3,806 774 2053 893 86 Total Closed Volume: 609,248,738 89.42M 275.64M 212.33M 31.86M Reports produced and compiled by RE STATS Inc. Information is deemed reliable but not guaranteed. Does not reflect all market activity. pp. 9 Steve Reese 405-848-9944 steve@oklahomarealtors.com
- 11. Monthly Inventory Analysis Data from the The Oklahoma Association of REALTORS® May 2012 Inventory as of Jun 14, 2012 Market Summary Report Produced on: Jun 18, 2012 Area Delimited by Entire OK State MLS - Single-Family Property Type Inventory Inventory Market Activity Market Activity New Listings Closed Sales 6,570 = 22.93% 3,806 = 11.72% Start Inventory Pending Sales 22,077 4,087 = 12.59% Total Inventory Other Off Market Units 2,533 = 7.80% 28,647 Volume Active Inventory $5,546,348,727 22,037 = 67.88% Absorption: Last 12 months, an Average of 3,073 Sales/Month MAY Year To Date Active Inventory as of May 31, 2012 = 22,037 2011 2012 +/-% 2011 2012 +/-% Closed Sales 3,285 3,806 15.86% 13,144 15,348 16.77% Pending Sales 3,172 4,087 28.85% 14,820 18,377 24.00% New Listings 6,086 6,570 7.95% 29,605 31,367 5.95% Average List Price 158,907 165,363 4.06% 151,685 155,649 2.61% Average Sale Price 153,042 160,076 4.60% 145,470 150,053 3.15% Average Percent of List Price to Selling Price 96.14% 96.63% 0.51% 95.68% 96.10% 0.44% Average Days on Market to Sale 84.52 79.11 -6.40% 92.21 87.12 -5.52% Monthly Inventory 25,549 22,037 -13.75% 25,549 22,037 -13.75% Months Supply of Inventory 9.55 7.17 -24.92% 9.55 7.17 -24.92% 2011 2011 MAY MARKET 2012 AVERAGE PRICES 2012 New Listings Pending Listings List Price Sale Price 6,086 6,570 165,363 158,907 160,076 4,087 3,172 153,042 +7.95% +28.85% +4.06% +4.60% 2011 2011 INVENTORY 2012 AVERAGE L/S% & DOM 2012 Active Inventory Monthly Supply of Inventory % of List to Sale Price Days on Market to Sale 25,549 9.55 96.63% 84.52 22,037 7.17 96.14% 79.11 -13.75% -24.92% +0.51% -6.40% Reports produced and compiled by RE STATS Inc. Information is deemed reliable but not guaranteed. Does not reflect all market activity. pp. 10 Steve Reese 405-848-9944 steve@oklahomarealtors.com