Financing Water and Sanitation in Developing Countries
•
0 gostou•278 visualizações

Financing Water and Sanitation in Developing Countries: Key trends and figures.

Recomendados
Recomendados
Mais conteúdo relacionado
Mais de Development Co-operation Directorate (DCD-DAC)
Mais de Development Co-operation Directorate (DCD-DAC) (20)
Último
Último (20)
Financing Water and Sanitation in Developing Countries
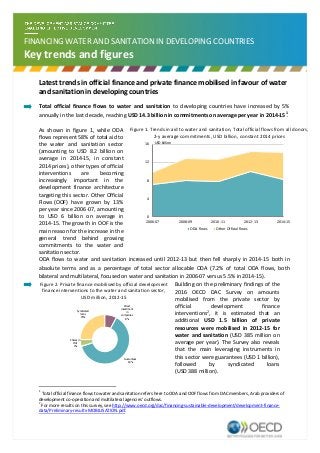
- 1. Latest trends in official finance and private finance mobilised in favour of water and sanitation in developing countries Total official finance flows to water and sanitation to developing countries have increased by 5% annually in the last decade, reaching USD 14.3 billion in commitments on average per year in 2014-151 . As shown in figure 1, while ODA flows represent 58% of total aid to the water and sanitation sector (amounting to USD 8.2 billion on average in 2014-15, in constant 2014 prices), other types of official interventions are becoming increasingly important in the development finance architecture targeting this sector. Other Official Flows (OOF) have grown by 13% per year since 2006-07, amounting to USD 6 billion on average in 2014-15. The growth in OOF is the main reason for the increase in the general trend behind growing commitments to the water and sanitation sector. Figure 1. Trends in aid to water and sanitation, Total official flows from all donors, 2-y average commitments, USD billion, constant 2014 prices ODA flows to water and sanitation increased until 2012-13 but then fell sharply in 2014-15 both in absolute terms and as a percentage of total sector allocable ODA (7.2% of total ODA flows, both bilateral and multilateral, focused on water and sanitation in 2006-07 versus 5.5% in 2014-15). Figure 2. Private finance mobilised by official development finance interventions to the water and sanitation sector, USD million, 2012-15 Building on the preliminary findings of the 2016 OECD DAC Survey on amounts mobilised from the private sector by official development finance interventions2 , it is estimated that an additional USD 1.5 billion of private resources were mobilised in 2012-15 for water and sanitation (USD 385 million on average per year). The Survey also reveals that the main leveraging instruments in this sector were guarantees (USD 1 billion), followed by syndicated loans (USD 388 million). 1 Total official finance flows to water and sanitation refers here to ODA and OOF flows from DAC members, Arab providers of development co-operation and multilateral agencies’ outflows. 2 For more results on this survey, see http://www.oecd.org/dac/financing-sustainable-development/development-finance- data/Preliminary-results-MOBILISATION.pdf. 0 4 8 12 16 2006-07 2008-09 2010-11 2012-13 2014-15 ODA flows Other Official flows USD billion Direct investment in companies 8% Guarantees 63% Shares in CIVs 4% Syndicated loans 25% FINANCING WATER AND SANITATION IN DEVELOPING COUNTRIES Key trends and figures
- 2. In 2014-15, Low and Middle Income Countries (LMICs) received the bulk of official flows to water and sanitation (40%), followed by Upper Middle Income Countries (UMICs, 33%) and Least Developed Countries (LICs, 22%). (Figure 3.1). When looking specifically at ODA flows, again LMICs received 40% followed by LICs with 33% and UMICs with 19%. Asia is prioritised as a recipient region, receiving 45% of total official financing to water and sanitation, followed by Africa (27%), America (18%) and Europe (6%). Figure 3.2. Figure 3.1 Income distribution of official flows to water in developing countries in 2014-15, commitments Figure 3.2 Regional distribution of official flows to water in developing countries in 2014-15, commitments In 2014-15, the main modality used to channel total official flows in the water sector was investments projects (91%); whereas 5% was in the form of sector budget support; 2% as contributions to specific- purpose programmes and funds managed by international organisations (multilateral, INGO), and 1% as technical assistance. An estimated 59% of all official interventions in the water and sanitation sector in developing countries concerned investments in infrastructure to provide water supply (20%), sanitation (20%) and, water and sanitation (19%). Figure 4. Sub sector breakdown of water and sanitation official interventions in 2014-15. LMICs 40% UMICs 33% LICs 22% Unallocated by income 5% South & Central Asia 25% Far East Asia 13% Middle East 8% South of Sahara 21% North of Sahara 6% South America 12% North & Central America 5% Europe 6% Developing countries unspecified 3% Oceania 1% 14% 20% 9% 20% 4% 19% 7% 5% 2% Water policy and resources conservation Water supply -large systems Water supply - basic Sanitation - large systems Sanitation - basic Both, water supply and sanitation - large systems Both, water supply and sanitation - basic Waste management River basins' development Box 1. The contribution of Arab providers to the water and sanitation sector in developing countries From 2009 onwards, Arab ODA and OOF flows are tracked in the Creditor Reporting System (CRS) database, which cover two bilateral providers (Kuwait, United Arab Emirates) and a number of Arab institutions (Arab Fund for Economic and Social Development, Islamic Development Bank, Arab Bank for Development in Africa and OPEC Fund for International Development). Figure 5. ODA and OOF flows by Arab donors Per-year average, USD million commitments, 2014 prices In 2014-15, total official flows to the water and sanitation sector from Arab providers amounted to USD 938 million per year, growing at 13% annually in the period 2010-15. This represents 12% of their total official flows to developing countries. From these, USD 938 million, 73% focused on interventions in Africa, 14% on South and Central Asia and 13% on South and Central America. All their activities were extended in the form of investment projects. 5 161 61 264 478 389 295 600 488 2010-11 2012-13 2014-15 ODA Grants ODA Loans Other Official Flows (non Export Credit)