2016 ENV Ministerial - Penny Johnes - UK - Nitrogen - Breakout session
•Transferir como PPTX, PDF•
0 gostou•1,772 visualizações

2016 ENV Ministerial - Penny Johnes - UK - Nitrogen - Breakout session

Recomendados
Mais conteúdo relacionado
Mais procurados
Mais procurados (20)
Destaque
Destaque (20)
Semelhante a 2016 ENV Ministerial - Penny Johnes - UK - Nitrogen - Breakout session
Semelhante a 2016 ENV Ministerial - Penny Johnes - UK - Nitrogen - Breakout session (20)
Mais de OECD Environment
Mais de OECD Environment (20)
Último
Último (20)
2016 ENV Ministerial - Penny Johnes - UK - Nitrogen - Breakout session
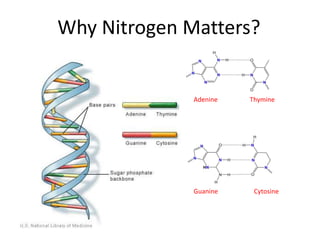
- 1. Why Nitrogen Matters? Adenine Thymine Guanine Cytosine
- 2. The Nitrogen Cascade: the unintended consequences of increasing N use Modified from European Nitrogen Assessment (2011) Nitrogen export Nitrogen in inland and coastal waters
- 3. The five key threats of excess N Disturbance of the global N cycle is far great in magnitude than our modification of the C cycle
- 4. Visible impacts of terrestrial N pollution: biodiversity losses Loss of biodiverse understorey Loss of sensitive lichen species Biodiversity loss in farmed meadows Biodiverse woodland understorey Lichens sensitive to air pollution Wildflower biodiversity in meadows N-poor natural ecosystems N-enriched ecosystems NEnrichment
- 5. Visible impacts of nutrient enrichment on the ecology of inland waters Filamentous algal growth in lakes Closure of waterbodies Fish kills, Thames Toxic algal blooms Microcystis bloom, Michigan Blue-green algal bloom, Lake Erie: Satellite image Bradford-on-Avon Canal the amenity value of inland waters
- 6. Visible impacts of coastal nutrient pollution: implications for coastal communities Caulerpa, Florida Green tides, Brittany Fish kills, Gulf of Mexico Shell-fishery closure Under the microscope Microcystis bloom, Baltic Noctiluca tides, New Zld. Phaeocystis foam, NL
- 7. The scale of the N challenge in UK waters Total N lost to waters annually Typical riverine concentrations 1 – >20 mg N/l TN (kg/ha) 0 – 2 3 – 4 5 – 8 9 – 16 17 – 32 33 – 64 65 – 128 > 128 Target riverine concentrations 1 – 2 mg N/l Greene et al (2015) Environmental Modelling & Software 68, 219-232
- 8. European Nitrogen Assessment (2011) The scale of the N challenge in EU waters Potential eutrophication risk due to N enrichment
- 9. Population exposure to nitrate in European waters Increasing societal exposure to nitrate in drinking water, generating adverse human health effects and increasing water treatment costs European Nitrogen Assessment (2011); Our Nutrient World (2013) Airborne PM2.5: months of life expectancy lost Ammonia and NOx contribute to increasing societal exposure to total PM2.5 in air, generating respiratory illness and cancer and increasing healthcare costs.
- 11. UNECE Gothenburg Protocol Five Priorities for Ammonia 1. Low emission techniques for land spreading of cattle/pig/ poultry manures and mineral fertilizers 2. Animal feeding strategies, inc phase feeding 3. Covers on new slurry stores 4. Farm N balance on demonstration farms 5. Low emission new pig & poultry housing
- 12. EU Nitrates Directive (1991) Targeted Action for Nitrate 1. Identification of polluted waters or at risk of pollution 2. Designation of land draining into those waters as Nitrate Vulnerable Zones 3. Establishment of voluntary Codes of Good Agricultural Practice to reduce nitrate leaching 4. Establishment of compulsory Action Programmes within NVZs 5. Closing mineral cycles: managing farm nutrient use efficiency to reduce excess negative impacts • Aimed at reducing nitrate in drinking water to < 11.3 mg N/l • Environmental targets are < 2 mg N/l
- 13. Dr Clare Howard: TFRN Secretariat & Towards INMS Team Policy context: UN Sustainable Development Goals and Nitrogen • 17 UN Sustainable Development Goals, with 169 targets • 8 UN SDGs and 17 targets specifically linked to Nitrogen
- 14. The N challenge: towards integrated solutions • The scale of N pollution in soil, air and water is greater than previously thought – Action is urgently need to halt biodiversity loss and bring human health impacts under control – Effective approaches will combine mitigation policies both for hotspots and N use efficiency • Food production is the single greatest contributor to environmental degradation – This will rise as economies develop and population grows – We need to develop strategies to reduce this impact • Current policy instruments do not go far enough and fail to address – The potential for pollutant swapping between sectors, sources or N forms – The potential to maximise co-benefits and account for trade-offs between costs and benefits • Nitrogen is a cross-sectoral problem, with the potential for cross-sectoral win-wins – Climate Change – Biodiversity – Air Pollution from Transport – Water • Addressing the nitrogen challenge requires integrated, holistic cross-sectoral solutions
Notas do Editor
- Nitrogen is an essential element that, together with oxygen, hydrogen, carbon and phosphorus, forms the basis of all life on Earth. It is a key component of the molecules that make up DNA, and so, when we add more N to any environment, if there is a sufficient quantity of the other elements, we make more life. Humans discovered this many centuries ago, and at the start of the 20th Century two Scientists, Fritz Haber and Carl Bosch discovered an industrial process with would allow us to ‘fix’ Nitrogen from the atmosphere, which is its largest natural pool on Earth, and transform it into a form which could be applied to crops and grass as fertiliser to stimulate crop growth and produce larger animals. The process was well-meant and well-founded, and has allowed us to produce vastly greater quantities of food. At present it is estimated that 50% of the world’s population is dependent on food produced solely through the Haber-Bosch process.
- Alas, no system on Earth is every fully sealed. Every system leaks to a greater or lesser extent, so that excess nitrogen not taken up by crops and grass nor stored in the system, leaks out to other systems. We refer to this as the Nitrogen Cascade, shown here. While we have, as a species, realised our ambition to increase food production in many areas of the world, the unintended consequences of increasing our nitrogen use include a wide array of adverse impacts on the Earth system, so much so that we have substantially exceeded what is known as the planetary boundary for nitrogen – the ability of the Earth ecosystem as a whole to cope with these impacts without having an adverse impact in turn on humanity.
- There are many threats to human and ecosystem health which result from this increasing N use. Our crop production systems, in association with the burning of fossil fuels emits harmful nitrogenous gases to the atmosphere, compromising air quality in urban areas where vehicle emissions are most dense, and contributing to the Greenhouse Gas Balance. Nitrogen deposited from these sources back onto the land surface contributes to the acidification of soils and the loss of biodiversity in sensitive natural environments. Nitrogen also builds up in soil systems as a direct impact of fertiliser applications, leading to the loss of native soil biodiversity. It also leaks from crop production systems in the presence of rainfall and snowmelt, and flushed into streams, rivers, lakes and estuaries and out into the coastal zone where it generates significant adverse effects on ecosystem and human health through the process we refer to as eutrophication. Nitrogen thus represents a cross-sectoral challenge, with disturbance of the global Nitrogen cycle being far greater in magnitude and the reach of its impacts than our modification of the Carbon cycle.
- Examples of terrestrial impacts include the loss of the diverse native woodland understorey, and the replacement of these plants with nutrient-hungry competitor species such as ivy and nettle as shown in this slide here, with the impacted woodland located immediately downwind from a poultry farm. The second pair of slides shows the loss of sensitive lichen species and the replacement of these communities with dense filamentous algal growth. This, again is downwind from a poultry farm, with the greatest accumulation of algal growth on the right-hand side of the tree immediately downwind from the poultry farm emissions. The right-hand pair of images show the loss of wildflower biodiversity in response to nitrogen enrichment, with the native species out-competed by grass species in the presence of nitrogen.
- Turning to freshwater ecosystems, the impacts are more dramatically evident, with the problems occurring worldwide. You will note that the title refers to nutrients rather than nitrogen, as nitrogen acts in tandem with other nutrient forms to generate these effects. [I will then talk through the individual slides using the titles beneath them]. In addition to the obvious loss of biodiversity, the algal blooms may produce hepatotoxins which are sufficient, if consumed, to kill dogs and sheep, and to cause skin blistering and vomiting in humans. You may remember seeing the London 2012 Olympic Games where the bronze medal-winning men’s triathlete, Jonny Brownlee, was vomiting blue-green water on the finish line, having swum in the contaminated Serpentine River in London during the event, or the way in which the Olympic diving pool at Rio turned from clear blue to murky green almost overnight, having to be drained and cleaned before the competition continued. Both indicated algal growth in the presence of nutrient pollution.
- As the nitrogen is washed downstream into estuaries and coastal waters, similar impacts occur with a wide range of harmful coastal algal blooms recorded worldwide, particularly in enclosed waters such as Chesapeake Bay, the Baltic Sea and the Northern Adriatic, where flushing rates are reduced and dilution of peak concentrations is limited. The problem is rising worldwide, with harmful algal blooms evident on the coast wherever there is intensive food production taking place. [I will then talk about each of these slides]. While the problems are most severe in the coastal waters off more developed economies, this problem will occur off the coast of less economically developed nations wherever development is accelerated in tandem with increased food production and/or a change in diet to include greater quantities of meat and dairy consumption. With 70% of world population growth predicted to occur in coastal environments, the clash between economic development and the environmental, human health, amenity and economic impacts of N enrichment in the coastal zone will be severe
- To give an idea of the scale of the challenge, this slide shows the rate of nitrogen flow from land to water in the UK. This is the result of modelling work undertaken for the UK government on the rates and sources of Nitrogen and Phosphorus pollution in UK waters. While there are some obvious regional trends, with hotspots around cities such as London, Birmingham, Manchester and so on, the technical detail is not important. What I would like you to take away from this image is the fact that the map should, in the absence of Nitrogen pollution, be blue. We are a very long way from anything approaching natural conditions in most of the UK, with nitrogen pollution in UK rivers is up to 10 times higher than in unpolluted waters. The scale of the challenge is significant, particularly in areas of the world with high population density, more developed economies and intensive food production.
- If we upscale to the EU27 we can see that the problem is not limited to highly developed and intensively farmed nations. The potential risk of eutrophication in EU waters resulting from nitrogen enrichment is shown on this map, taken from the European Nitrogen Assessment in 2011. Here we can see that all but the northern parts of Scandinavia and fragments of land in the Mediterranean states have at least a medium and more commonly a high risk of eutrophication due to nitrogen enrichment.
- The impacts on Human Health have also been mapped for the EU27 in the same programme, with population exposure to nitrate in drinking water shown here on the left, with the months of life expectancy lost as a result of particulate matter build-up (referred to here as total PM2.5) shown here on the right. Ammonia released primarily from animal agriculture and NOx emitted from vehicle exhausts is a key contributor to total PM2.5. The net result is increasing societal exposure and risk of generating adverse human health impacts as well as increasing water treatment and healthcare costs. The total costs of nitrogen pollution have been estimated in a range of studies. Our own work in the UK suggests £10-£20,000 per kilometre squared of land in lowland farming areas is the cost associated with fertiliser loss from agricultural land and the associated environmental damage in the UK. In the EU27 we estimate €18 billion of fertilisers lost every year in the EU27, equivalent to 25% of CAP budget, while the publication ‘Our Nutrient World’ suggests an estimated 2 trillion US Dollars of damage to the global environment and human health. All of these are annual and repeating costs, and there is an opportunity if we act to bring the profligate use of nitrogen as a resource under control to make significant cost savings on both the fertiliser loss and associated environmental damage costs.
- So, nitrogen pollution is environmentally and economically damaging, with our disruption of the global N cycle being far greater, already, than our disruption of the global carbon cycle. The damage costs are significant, and these are set to rise as the global population grows and people coming out of poverty have access to a richer diet, supported through Haber-Bosch nitrogen. And yet the problem is unequally distributed, globally. As this very interesting map produced by the National Geographic Magazine recently showed, there are areas of the world with well-developed economies where the annual nitrogen balance is in substantial excess and impacts of nitrogen pollution are substantial. In these areas there is luxury use of nitrogen, supporting food intake which generates significant adverse health effects. The economic development of India, China and Brazil in recent decades has been accompanied with a switch from deficiency to excess, yet other areas of the world have a substantial N deficiency where diet is poor and 239 million people go hungry every year. So the question we must ask is how we can take action on this problem? What policy levers could we pull to live more sustainably, to curb the impacts of nitrogen pollution and address the need to address the nitrogendeficiency in less economically developed areas?
- The policy context is complicated with a lack of joined-up thinking at present, which means that we often advocate policies to resolve one problem, which generates adverse impacts for another pollutant or sector. WE refer to this as pollutant swapping. Classic examples of this are given below. Recent work by the UNECE Task Force for Reactive Nitrogen has developed a series of guidance documents on mitigation measures to tackle the emission of ammonia to the atmosphere from agricultural sources. [I will run through the bullet points on the slide here] Some of these measures would reduce associated nitrogen flux to other sectors. However others would simply swap an emission reduction for an increase in the flux of nitrogen to waters. An effective policy would consider the whole element cycle within the socio-economic context, looking for win-win situations where a mitigation strategy led to cross-sectoral reductions in nitrogen pollution while maintaining food production at a sustainable level.
- Another example is in the mitigation measures that have been developed in many nations to tackle nitrate pollution of drinking water supplies. [I will then run through the bullet points on the slide] Again, these advocate specific measures to tackle a single form of nitrogen pollution, and fluxes to a single environmental domain (water) without considering the impact of these measures on the flux of other forms of nitrogen pollution to waters and to other environmental domains.
- The recent adoption of the UN Sustainable Development Goals provides an opportunity to approach nitrogen in a different manner. Of the 17 goals and 169 targets, the TFRN Secretariat have identified 9 goals and 17 targets that are specifically linked to nitrogen. [I will then run through the nitrogen-relevant targets on the slide] These SDGs provide a policy framework, within which there is a real opportunity to motivate change, develop approaches which can reduce both the environmental and human health impacts of nitrogen pollution while reducing the costs associated with luxury nitrogen use. There is also an opportunity to think cross-sectorally, across the water, air, climate and soil domains, so that we can avoid pollution swapping effects and identify the mitigation options offering a win-win outcome.
- So, if I can sum up: [I will then run through each of the bullet points on the slide]