![The graph was manipulatedandadjustedsothe 0 wouldbe the ground.Interval from0.85 s to
1.5 s showsa complete bounce,with1.15s is whichwhere the ball isattop of a bounce,1.4 s is a point
whenthe ball isjustabout to touchthe ground,1.45 s isthe instantthe ball hitthe ground,and1.5 s is
whenthe ball isjustleavingthe ground.
Figure 3 shows a relationship as Potential Energy to where the ball is located when dropped
Potential Energyinthisexperimentisthe gravitational potentialstored,itcanalsobe
representedas
PE = mgh [Eq.1]
Where m ismass,g is gravity,andh is height.A complete bounce fromthe graphisfrom0.85 s
to 1.45 s. The pointwhere the ball isatthe top of a bounce isat 1.15 s , potential energyismaximum
here due to the fact that heightisgreatesthere.1.4s is whenthe ball is juststartingto touch the
ground,at 1.45 s isthe instantwhere the ball touchesthe ground,here potential Energyisatit’sleast,
due to 0 height,anditisalso where elasticenergyisgainedtobounce the ball backup butit doesnot
bounce back as highdue to energylostasthermal. 1.5 isthe instantthe ball leavesthe ground.
Potential Energyisdecreasingaftereachbounce due to it doesnotbounce back as highaftereachtime
it hitsthe ground.](data:image/gif;base64,R0lGODlhAQABAIAAAAAAAP///yH5BAEAAAAALAAAAAABAAEAAAIBRAA7)
Recomendados
Mais conteúdo relacionado
Último
Último (20)
Destaque
Destaque (20)
Ball drop
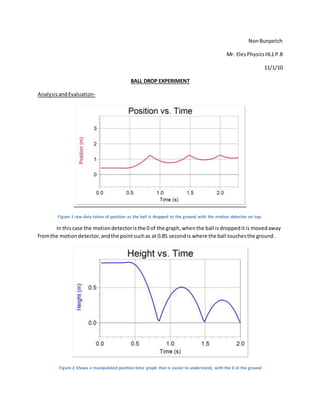
- 1. NonBunpetch Mr. ElesPhysicsHL1 P.8 11/1/10 BALL DROP EXPERIMENT AnalysisandEvaluation- Figure 1 raw data taken of position as the ball is dropped to the ground with the motion detector on top. In thiscase the motiondetectoristhe 0 of the graph,whenthe ball isdroppeditis movedaway fromthe motiondetector,andthe pointsuchas at 0.85 secondis where the ball touchesthe ground. Figure 2 Shows a manipulated position-time graph that is easier to understand, with the 0 at the ground
- 2. The graph was manipulatedandadjustedsothe 0 wouldbe the ground.Interval from0.85 s to 1.5 s showsa complete bounce,with1.15s is whichwhere the ball isattop of a bounce,1.4 s is a point whenthe ball isjustabout to touchthe ground,1.45 s isthe instantthe ball hitthe ground,and1.5 s is whenthe ball isjustleavingthe ground. Figure 3 shows a relationship as Potential Energy to where the ball is located when dropped Potential Energyinthisexperimentisthe gravitational potentialstored,itcanalsobe representedas PE = mgh [Eq.1] Where m ismass,g is gravity,andh is height.A complete bounce fromthe graphisfrom0.85 s to 1.45 s. The pointwhere the ball isatthe top of a bounce isat 1.15 s , potential energyismaximum here due to the fact that heightisgreatesthere.1.4s is whenthe ball is juststartingto touch the ground,at 1.45 s isthe instantwhere the ball touchesthe ground,here potential Energyisatit’sleast, due to 0 height,anditisalso where elasticenergyisgainedtobounce the ball backup butit doesnot bounce back as highdue to energylostasthermal. 1.5 isthe instantthe ball leavesthe ground. Potential Energyisdecreasingaftereachbounce due to it doesnotbounce back as highaftereachtime it hitsthe ground.
- 3. Figure 4 shows kinetic energy in relationship to where the ball is. KineticEnergyisthe energyof motion,andcan be representedby KE = 1/2mv2 [Eq.2] Where m standsfor massand v standsfor velocity. A completebounce inthisgraphis fromthe interval of 0.85s to 1.45s. The ball at highestpointhas 0 kineticenergyasthe velocityof the ball becomes0.And as the ball acceleratesbacktowardthe groundit gainsmore and more kineticenergy and reachesmaximumata pointrightbefore the ball hitsthe ground.Atthe instantthe ball hitthe groundkineticenergybecomes0as velocityof the ball is0, as can be seeninthe graph at point0.85s. as the ball leavesthe groundithas elasticenergystoredtohelpitbounce backup,but notas highas some energyislostas thermal.Itdeceleratesasitgoesupdue to gravityactingon it and finallyreaching0 again.
- 4. Figure 5 shows the total energy of the system as the ball is dropped, the total energy is included of Potential and Kinetic Energy Total Energyinthisgraph isthe Potential andKineticEnergycombined.A complete bounce is fromthe interval 0.85sto 1.45s. Throughoutthe bounce the ball have a constanttotal energyexpectfor whenthe ball hitsthe ground,thenitbecomes0. It bounce have constanttotal energybecause kinetic and potential addedtobe equal ateverypointinthatbounce.Atthe pointwhere the ball hitsthe ground,the energydoesn’treallybecome 0,itisconservedtoelastic,butappearedas0 because the motiondetectordoesnotmeasure elasticenergy.The total energyaftereachbounce becomeslessand lessdue tothe lostinenergyas thermal whenthe ball hitsthe ground.The percentenergylostcanbe calculatedas 1st to 2nd bounce – |(3.8 – 2.2) / 3.8| x 100 = 42.1% 2nd to 3rd bounce - |(2.2 – 1.4) / 2.2| x 100 = 36.4% It can be assumedthatthe percentenergylostbecomeslessandless aftereachbounce.