SlideShare uma empresa Scribd logo
1 de 7
Baixar para ler offline
Investment Market Update
Swedish cross border investment
Non-domestic markets back on the radar
DTZ Research
4 March 2014
Contents
Overview 2
Geographic focus 3
Size of overseas investments 5
Preferred sectors 5
Investor types 5
Authors
Karin Witalis
Head of Research, Sweden
+ 46 (0)73 650 88 53
karin.witalis@dtz.com
Nigel Almond
Head of Strategy Research
+ 44 (0)20 3296 2328
nigel.almond@dtz.com
Contacts
Magali Marton
Head of CEMEA Research
+ 33 (0)1 4964 4954
magali.marton@dtz.com
Hans Vrensen
Global Head of Research
+ 44 (0)20 3296 2159
hans.vrensen@dtz.com
 The purpose of this paper is to outline the recent trends in non-domestic
investment activity by Swedish investors, looking at the cross border capital
flow, the types of investor, and the geographies and sectors that they have
invested in.
 Since 2004 over EUR7bn of investment has been made outside of Swedish
borders. Two thirds of this investment was undertaken in the last five years
(Figure 1).
 The main geographic focus has been towards Europe, in particular other
Nordic countries such as Finland and Norway, as well as Germany and the UK.
The US is also a significant focus and the third most invested market outside of
Sweden. Asia Pacific is a new market for Swedish investors and its share is still
limited.
 Compared to activity overall, Swedish investors show greater diversity in the
types of property they will invest in.
 When categorising the Swedish property investors into different groups, it is
clear that that private property vehicles (unlisted funds) have been the most
active cross border investor group. The second largest group is institutions.
Figure 1
Cross border investment activity by Swedish investors, EUR bn
Source: DTZ Research, Real Capital Analytics
0.0
0.5
1.0
1.5
2.0
2004 2005 2006 2007 2008 2009 2010 2011 2012 2013
EUR2.5bn
EUR4.6bn
Swedish cross border investment
www.dtz.com Investment Market Update 2
Overview
Renewed activity post financial crisis
The 1980s saw strong levels of commercial real estate
investment by Swedish investors outside of Sweden.
However, this activity stopped abruptly with the banking
and property crisis in the early 1990s. Since then the
majority of Swedish investment has been focused
domestically. Yet, there have been exceptions to this rule,
and over the last five years a growing stream of Swedish
capital has been invested in non-domestic markets.
Since 2004 over EUR7bn of investment has been made
outside of Swedish borders (Figure 2). Although this
represents just 12% of total Swedish capital invested, it is
noteworthy that two thirds of this overseas investment has
been deployed in the last five years (Figure 3).
Over the past decade cross border activity has been on an
upward trend. There have been notable spikes (Figure 3).
The first in 2007 coincided with the peak in global
investment activity. Since then we have also seen stronger
levels of activity in 2010 and 2012. In 2010 most of the
cross border investment was in Norway and to a lesser
extent Germany. In 2012 Swedish investors took big leaps
into the British and American markets.
Purchasing activity only highlights half the story. Swedish
investors have been active on the sell side as well. In the
five year period 2004-2008, Swedish investors were
typically net sellers abroad, with net sales totalling
EUR1.5bn over the period (Figure 4). This was actually
consistent with domestic activity, where Swedish investors
were also net sellers at home by almost EUR13bn.
In the wake of the financial crisis starting in 2008 we have
seen growing activity from Swedish investors both at home
and abroad. Sweden was not impacted by the financial
crisis relative to other European nations. Also, in the years
directly after the start of the financial crisis national
institutional investors and private investors were able to
ensure high liquidity in the major markets. This led to
increasing activity with Swedish investors once again net
buyers in their home markets each year since 2009.
A similar trend has been seen overseas with Swedish net
buying over the period 2009-13 reaching EUR0.7bn, and
positive with the exception of 2012, which saw a
significant sale in Norway of close to EUR1bn. This was
more than enough to wipe-out the record EUR1.7bn of
cross border acquisitions that year (Figure 4).
Figure 2
Swedish capital invested EUR bn and % cross border
Source: DTZ Research, Real Capital Analytics
Figure 3
Swedish cross border investments 2004-12, EUR bn
Source: DTZ Research, Real Capital Analytics
Figure 4
Swedish cross border net investment, EUR bn
Source: DTZ Research, Real Capital Analytics
0%
5%
10%
15%
20%
25%
0
2
4
6
8
10
12
2004 2005 2006 2007 2008 2009 2010 2011 2012 2013
Domestic Cross border % cross border (RHS)
0.0
0.5
1.0
1.5
2.0
2004 2005 2006 2007 2008 2009 2010 2011 2012 2013
EUR2.5bn
EUR4.6bn
-3
-2
-2
-1
-1
0
1
1
2
2
-2.5
-2.0
-1.5
-1.0
-0.5
0.0
0.5
1.0
1.5
2.0
2004 2005 2006 2007 2008 2009 2010 2011 2012 2013
Investments Sales Net
Swedish cross border investment
www.dtz.com Investment Market Update 3
Geographic focus
As outlined earlier, the majority (close to 90%) of Swedish
investment has been in Sweden itself. But the proportion
of total investment going overseas has grown, averaging
14% of total investment in the last five years. This
compares to 7% in the previous five year period.
In terms of investments overseas, the main focus has been
towards Europe (Figure 5), representing 84% of cross
border investment over the last ten years. North America
represents a further 13% of investment, with all capital
deployed in the US. Asia Pacific is a new market for
Swedish investors and its share is no more than 3%.
Although relatively modest in a Global context, these flows
highlight how some Swedish investors are taking the lead
in investing far and wide.
Focus on home region
The majority of investment in Europe has been directed
towards other Nordic countries - Denmark, Finland and
Norway (Figure 6). This trend is not surprising, as investors
focus on those markets closer to home and, ones they
know best. Finland and Norway have been most favoured
over Denmark in the last five years. The reduced activity in
Denmark is not surprising, given this market has been
more exposed to the banking crisis and problematic real
estate loans relative to neighbouring markets.
Outside the Nordic region, Swedish investors have
preferred large, established markets including the UK and
Germany. This has been the case both before and after the
financial crisis.
Emerging interest for the US and Asia Pacific
More recently we have seen growing activity in the US
which is the third most invested market outside Sweden in
the last five years, with volumes totalling close to
EUR0.8bn, and spread across a number of US cities but
notably San Jose, Boston and Washington DC. The US is a
large market, similar in size to the whole of Europe, which
provides many investment opportunities. Pricing over
recent years has also been attractive, with relatively high
levels of liquidity to be found in major markets.
Investment across Asia Pacific in the last five years has
been entirely focussed on China. The investments in these
markets have mainly been for occupational purposes as
the Swedish retailer, IKEA, has expanded its operations in a
number of key cities.
Figure 5
Swedish capital invested in different continents, EUR bn
Source: DTZ Research, Real Capital Analytics
Figure 6
Country allocation 2004-2008 vs 2009-2013
Source: DTZ Research, Real Capital Analytics
0.0
0.5
1.0
1.5
2.0
2004 2005 2006 2007 2008 2009 2010 2011 2012 2013
Rest Europe North America Asia Pacific
0%
10%
20%
30%
40%
50%
60%
70%
80%
90%
100%
2004-08 2009-13
Norway
Finland
US
UK
Germany
China
Denmark
Other
Swedish cross border investment
www.dtz.com Investment Market Update 4
Figure 7
Swedish cross border flows 2009-13 in key overseas markets
Source: DTZ Research, Real Capital Analytics
Stronger activity in neighbouring markets
Over the last five years Norway and Finland have been
key markets for Swedish investors with over EUR1bn
invested in each market over this period. The close
proximity to Sweden means Swedish investors are able to
invest with relative ease. They are also markets where we
have seen significant sales over the same period
(Figure 7). Only in Denmark has investment been low.
Higher net investment further afield
The next significant markets are the US and UK, where
over EUR0.7bn has been invested in each market. The US
has also seen a relatively higher number of sales too,
although both show strong levels of net investment.
Other key investment markets have been China, the
Czech Republic and Germany. With the exception of the
latter, sales have been relatively low to date. Outside
these markets investment have been relatively limited.
€1,150m
€70m
€370m
€15m
€0m
€1,000m
€400m
€300m
€180m
€1,600m
€750m
€760m
€35m
€60m €880m
€100m
€340m
€0m
€0m
€200m
Swedish cross border investment
www.dtz.com Investment Market Update 5
Size of overseas investments
When investing overseas, Swedish investors have typically
focussed on larger lot sizes. The majority (over 80%) of
overseas investments are for lots in excess of EUR200m
(Figure 8). This is not surprising. Overseas investments are
typically larger as investors seek to deploy as much money
in fewer deals to reduce travel, due diligence and
acquisition costs. On average deals have been EUR44m in
the last five years. This compares to EUR25m at home.
Preferred sectors
Compared to activity overall, Swedish investors show
greater diversity in the types of property they will invest
in (Figure 9). Offices typically account for 50% of
investment in Europe. Based on recent activity, offices
account for just 30% of investment, with retail dominating
at over 40%. Other sectors, notably healthcare are also a
focus for investment, representing 15% of acquisitions
over the last five years
1
.
Even prior to 2009, Swedish investors were more
diversified in their choice of investments with mixed use
and other assets (mostly healthcare) in focus.
Investor types
When categorising the Swedish property investors into
different groups, it is clear that that private property
vehicles (unlisted funds) have been the most active cross
border investor group, placing nearly EUR3bn in non-
domestic markets. The second largest group is institutions
with EUR855m invested abroad. Private property
companies have also been active with EUR677m invested
outside Sweden.
When dividing the series into before and after the start of
the financial crisis, some interesting patterns emerge
(Figure 10). Institutions have grown their share abroad,
while listed companies and private investors have been
relatively less active. Private property vehicles were the
largest cross border investor before the financial crisis.
We have also see growing corporate activity, reflecting
investments by IKEA as outlined earlier.
1
Note that residential and hotel property is not included in this study.
Figure 8
Size of overseas investments
Source: DTZ Research, Real Capital Analytics
Figure 9
Sector allocation for Swedish cross border investments
Source: DTZ Research, Real Capital Analytics
Figure 10
Investor type
Source: DTZ Research, Real Capital Analytics
0%
20%
40%
60%
80%
100%
2004-08 2009-13
Over EUR500m
EUR200-500m
EUR50-200m
Under EUR50m
0%
20%
40%
60%
80%
100%
2004-08 2009-13
Office
Retail
Industrial
Mixed use
Other
0%
20%
40%
60%
80%
100%
2004-08 2009-13
Private Property Vehicle Institution
Corporate Private investor/ Company
Listed companies Other
Swedish cross border investment
www.dtz.com Investment Market Update 6
Other DTZ Research Reports
Other research reports can be downloaded from www.dtz.com/research. These include:
Occupier Perspective
Updates on occupational markets from an occupier
perspective, with commentary, analysis, charts and data.
Global Occupancy Costs Offices
Global Occupancy Costs Logistics
Obligations of Occupation Americas
Obligations of Occupation Asia Pacific
Obligations of Occupation EMEA
Global Office Review
Regional Headquarters Asia Pacific- November 2013
Sweden - Computer Games developers – November 2013
India Office Demand and Trends Survey 2012-13
Poland Banking Sector - January 2013
Property Times
Regular updates on occupational markets from a landlord
perspective, with commentary, charts, data and forecasts.
Coverage includes Asia Pacific, Bangkok, Beijing, Berlin,
Brisbane, Bristol, Brussels, Budapest, Central London,
Chengdu, Chongqing, Dalian, Edinburgh, Europe, Frankfurt,
Glasgow, Guangzhou, Hangzhou, Ho Chi Minh City, Hong
Kong, India, Jakarta, Japan, Kuala Lumpur, Luxembourg,
Madrid, Manchester, Melbourne, Milan, Nanjing,
Newcastle, Paris, Poland, Prague, Qingdao, Rome, Seoul,
Shanghai, Shenyang, Shenzhen, Singapore, Stockholm,
Sydney, Taipei, Tianjin, Ukraine, Warsaw, Wuhan, Xian.
Investment Market Update
Regular updates on investment market activity, with
commentary, significant deals, charts, data and forecasts.
Coverage includes Asia Pacific, Australia, Belgium, Czech
Republic, Europe, France, Germany, Italy, Japan, Mainland
China, South East Asia, Spain, Sweden, UK.
Money into Property
For more than 35 years, this has been DTZ's flagship
research report, analysing invested stock and capital flows
into real estate markets across the world. It measures the
development and structure of the global investment
market. Available for Global, Asia Pacific, Europe, North
America and UK.
Foresight
Quarterly commentary, analysis and insight into our in-
house data forecasts, including the DTZ Fair Value Index™.
Available for Global, Asia Pacific, Europe and UK. In
addition we publish an annual outlook report.
Insight
Thematic, ad hoc, topical and thought leading reports on
areas and issues of specific interest and relevance to real
estate markets.
China Investment Market Sentiment Survey January 2014
China The Technology Sector January 2014
Insight Czech Republic Green buildings December 2013
Net Debt Funding Gap - November 2013
UK secondary market pricing - October 2013
German Open Ended Funds - October 2013
Great Wall of Money - October 2013
Quantitative Easing - UK Regions - September 2013
Singapore Government Land Sales - September 2013
UK lending market -September 2013
Quantitative Easing - August 2013
Property Investment Guide Asia Pacific 2013-2014
DTZ Research Data Services
For more detailed data and information, the
following are available for subscription. Please
contact graham.bruty@dtz.com for more
information.
 Property Market Indicators
Time series of commercial and industrial
market data in Asia Pacific and Europe.
 Real Estate Forecasts, including the DTZ
Fair Value Index
TM
Five-year rolling forecasts of commercial
and industrial markets in Asia Pacific,
Europe and the USA.
 Investment Transaction Database
Aggregated overview of investment activity
in Asia Pacific and Europe.
 Money into Property
DTZ’s flagship research product for over 35
years providing capital markets data
covering capital flows, size, structure,
ownership, developments and trends, and
findings of annual investor and lender
intention surveys.
www.dtz.com Investment Market Update 7
DTZ Research
DTZ Research Contacts
Global Head of Research
Hans Vrensen
Phone: +44 (0)20 3296 2159
Email: hans.vrensen@dtz.com
Head of Strategy Research
Nigel Almond
Phone: +44 (0)20 3296 2328
Email: nigel.almond@dtz.com
Head of Research, Sweden
Karin Witalis
Phone: +46 (0)8 671 34 26
Email: karin.witalis@dtz.com
Head of UK Research
Global Head of Forecasting
Fergus Hicks
Phone: +44 (0)20 3296 2307
Email: fergus.hicks@dtz.com
Head of CEMEA Research
Magali Marton
Phone: +33 1 49 64 49 54
Email: magali.marton@dtz.com
DTZ Business Contacts
Chief Executive, EMEA
John Forrester
Phone: +44 (0)20 3296 2002
Email: john.forrester@dtz.com
Head of Capital Markets, Sweden
Fredrik Lidjan
Phone: +46 (0)8 671 34 76
Email: fredrik.lidjan@dtz.com
Managing Director, Sweden
Agneta Jacobsson
Phone: +46 (0)8 671 34 55
Email: agneta.jacobsson@dtz.com
Head of Valuation, Sweden
Sven Erik Hugosson
Phone: +46 (0)8 671 34 59
svenerik.hugosson@dtz.com
DISCLAIMER
This report should not be relied upon as a basis for entering into transactions without seeking specific, qualified, professional advice. Whilst
facts have been rigorously checked, DTZ can take no responsibility for any damage or loss suffered as a result of any inadvertent inaccuracy
within this report. Information contained herein should not, in whole or part, be published, reproduced or referred to without prior
approval. Any such reproduction should be credited to DTZ.
© DTZ March 2014

Mais conteúdo relacionado

Último

Kohinoor Hinjewadi Phase 2 Pune E-Brochure.pdf
Kohinoor Hinjewadi Phase 2 Pune  E-Brochure.pdfKohinoor Hinjewadi Phase 2 Pune  E-Brochure.pdf
Kohinoor Hinjewadi Phase 2 Pune E-Brochure.pdfManishSaxena95
 
Best Deal Virtual Space in Satya The Hive Tata Zudio 750 Sqft 1.89 Cr All inc...
Best Deal Virtual Space in Satya The Hive Tata Zudio 750 Sqft 1.89 Cr All inc...Best Deal Virtual Space in Satya The Hive Tata Zudio 750 Sqft 1.89 Cr All inc...
Best Deal Virtual Space in Satya The Hive Tata Zudio 750 Sqft 1.89 Cr All inc...ApartmentWala1
 
Properties for Sale in Istanbul with Schools and Parks | Antalya Development
Properties for Sale in Istanbul with Schools and Parks | Antalya DevelopmentProperties for Sale in Istanbul with Schools and Parks | Antalya Development
Properties for Sale in Istanbul with Schools and Parks | Antalya DevelopmentAntalya Development
 
2k Shots ≽ 9205541914 ≼ Call Girls In Sainik Farm (Delhi)
2k Shots ≽ 9205541914 ≼ Call Girls In Sainik Farm (Delhi)2k Shots ≽ 9205541914 ≼ Call Girls In Sainik Farm (Delhi)
2k Shots ≽ 9205541914 ≼ Call Girls In Sainik Farm (Delhi)Delhi Call girls
 
3D Architectural Rendering Company by Panoram CGI
3D Architectural Rendering Company by Panoram CGI3D Architectural Rendering Company by Panoram CGI
3D Architectural Rendering Company by Panoram CGIPanoram CGI
 
M3M 129 E Brochure Noida Expressway, Sector 129, Noida
M3M 129 E Brochure Noida Expressway, Sector 129, NoidaM3M 129 E Brochure Noida Expressway, Sector 129, Noida
M3M 129 E Brochure Noida Expressway, Sector 129, Noidasarak0han45400
 
9990771857 Call Girls Dwarka Sector 9 Delhi (Call Girls ) Delhi
9990771857 Call Girls Dwarka Sector 9 Delhi (Call Girls ) Delhi9990771857 Call Girls Dwarka Sector 9 Delhi (Call Girls ) Delhi
9990771857 Call Girls Dwarka Sector 9 Delhi (Call Girls ) Delhidelhimodel235
 
9990771857 Call Girls in Dwarka Sector 6 Delhi (Call Girls) Delhi
9990771857 Call Girls in Dwarka Sector 6 Delhi (Call Girls) Delhi9990771857 Call Girls in Dwarka Sector 6 Delhi (Call Girls) Delhi
9990771857 Call Girls in Dwarka Sector 6 Delhi (Call Girls) Delhidelhimodel235
 
Shapoorji Pallonji Joyville Vista Pune | Spend Your Family Time Together
Shapoorji Pallonji Joyville Vista Pune | Spend Your Family Time TogetherShapoorji Pallonji Joyville Vista Pune | Spend Your Family Time Together
Shapoorji Pallonji Joyville Vista Pune | Spend Your Family Time Togetheraidasheikh47
 
call girls in ganesh nagar Delhi 8264348440 ✅ call girls ❤️
call girls in ganesh nagar Delhi 8264348440 ✅ call girls ❤️call girls in ganesh nagar Delhi 8264348440 ✅ call girls ❤️
call girls in ganesh nagar Delhi 8264348440 ✅ call girls ❤️soniya singh
 
Call Girls in shastri nagar Delhi 8264348440 ✅ call girls ❤️
Call Girls in shastri nagar Delhi 8264348440 ✅ call girls ❤️Call Girls in shastri nagar Delhi 8264348440 ✅ call girls ❤️
Call Girls in shastri nagar Delhi 8264348440 ✅ call girls ❤️soniya singh
 
Kohinoor Flats In Hinjewadi Phase 2 | Homes Built To Suit Your Needs
Kohinoor Flats In Hinjewadi Phase 2 | Homes Built To Suit Your NeedsKohinoor Flats In Hinjewadi Phase 2 | Homes Built To Suit Your Needs
Kohinoor Flats In Hinjewadi Phase 2 | Homes Built To Suit Your Needsaidasheikh47
 
2k Shot Call girls Aiims Delhi 9205541914
2k Shot Call girls Aiims Delhi 92055419142k Shot Call girls Aiims Delhi 9205541914
2k Shot Call girls Aiims Delhi 9205541914Delhi Call girls
 
Girls in Kalyanpuri }Delhi↫8447779280↬Escort Service. In Delhi NCR
Girls in Kalyanpuri }Delhi↫8447779280↬Escort Service. In Delhi NCRGirls in Kalyanpuri }Delhi↫8447779280↬Escort Service. In Delhi NCR
Girls in Kalyanpuri }Delhi↫8447779280↬Escort Service. In Delhi NCRasmaqueen5
 
Purva Soukhyam in Guduvancheri Chennai.pdf
Purva Soukhyam in Guduvancheri Chennai.pdfPurva Soukhyam in Guduvancheri Chennai.pdf
Purva Soukhyam in Guduvancheri Chennai.pdfpritika141199
 
Call Girls In Mayur Vihar Delhi ☆↫8447779280 ❤Escorts Service In Delhi
Call Girls In Mayur Vihar Delhi ☆↫8447779280 ❤Escorts Service In DelhiCall Girls In Mayur Vihar Delhi ☆↫8447779280 ❤Escorts Service In Delhi
Call Girls In Mayur Vihar Delhi ☆↫8447779280 ❤Escorts Service In Delhiasmaqueen5
 
Greater Vancouver Realtors Statistics Package April 2024
Greater Vancouver Realtors Statistics Package April 2024Greater Vancouver Realtors Statistics Package April 2024
Greater Vancouver Realtors Statistics Package April 2024VickyAulakh1
 
9990771857 Call Girls in Dwarka Sector 2 Delhi (Call Girls) Delhi
9990771857 Call Girls in Dwarka Sector 2 Delhi (Call Girls) Delhi9990771857 Call Girls in Dwarka Sector 2 Delhi (Call Girls) Delhi
9990771857 Call Girls in Dwarka Sector 2 Delhi (Call Girls) Delhidelhimodel235
 
Maha Mauka Squarefeet Brochure |Maha Mauka Squarefeet PDF Brochure|
Maha Mauka Squarefeet Brochure |Maha Mauka Squarefeet PDF Brochure|Maha Mauka Squarefeet Brochure |Maha Mauka Squarefeet PDF Brochure|
Maha Mauka Squarefeet Brochure |Maha Mauka Squarefeet PDF Brochure|AkshayJoshi575980
 
Premium Villa Projects in Sarjapur Road Bengaluru
Premium Villa Projects in Sarjapur Road BengaluruPremium Villa Projects in Sarjapur Road Bengaluru
Premium Villa Projects in Sarjapur Road BengaluruShivaSeo3
 

Último (20)

Kohinoor Hinjewadi Phase 2 Pune E-Brochure.pdf
Kohinoor Hinjewadi Phase 2 Pune  E-Brochure.pdfKohinoor Hinjewadi Phase 2 Pune  E-Brochure.pdf
Kohinoor Hinjewadi Phase 2 Pune E-Brochure.pdf
 
Best Deal Virtual Space in Satya The Hive Tata Zudio 750 Sqft 1.89 Cr All inc...
Best Deal Virtual Space in Satya The Hive Tata Zudio 750 Sqft 1.89 Cr All inc...Best Deal Virtual Space in Satya The Hive Tata Zudio 750 Sqft 1.89 Cr All inc...
Best Deal Virtual Space in Satya The Hive Tata Zudio 750 Sqft 1.89 Cr All inc...
 
Properties for Sale in Istanbul with Schools and Parks | Antalya Development
Properties for Sale in Istanbul with Schools and Parks | Antalya DevelopmentProperties for Sale in Istanbul with Schools and Parks | Antalya Development
Properties for Sale in Istanbul with Schools and Parks | Antalya Development
 
2k Shots ≽ 9205541914 ≼ Call Girls In Sainik Farm (Delhi)
2k Shots ≽ 9205541914 ≼ Call Girls In Sainik Farm (Delhi)2k Shots ≽ 9205541914 ≼ Call Girls In Sainik Farm (Delhi)
2k Shots ≽ 9205541914 ≼ Call Girls In Sainik Farm (Delhi)
 
3D Architectural Rendering Company by Panoram CGI
3D Architectural Rendering Company by Panoram CGI3D Architectural Rendering Company by Panoram CGI
3D Architectural Rendering Company by Panoram CGI
 
M3M 129 E Brochure Noida Expressway, Sector 129, Noida
M3M 129 E Brochure Noida Expressway, Sector 129, NoidaM3M 129 E Brochure Noida Expressway, Sector 129, Noida
M3M 129 E Brochure Noida Expressway, Sector 129, Noida
 
9990771857 Call Girls Dwarka Sector 9 Delhi (Call Girls ) Delhi
9990771857 Call Girls Dwarka Sector 9 Delhi (Call Girls ) Delhi9990771857 Call Girls Dwarka Sector 9 Delhi (Call Girls ) Delhi
9990771857 Call Girls Dwarka Sector 9 Delhi (Call Girls ) Delhi
 
9990771857 Call Girls in Dwarka Sector 6 Delhi (Call Girls) Delhi
9990771857 Call Girls in Dwarka Sector 6 Delhi (Call Girls) Delhi9990771857 Call Girls in Dwarka Sector 6 Delhi (Call Girls) Delhi
9990771857 Call Girls in Dwarka Sector 6 Delhi (Call Girls) Delhi
 
Shapoorji Pallonji Joyville Vista Pune | Spend Your Family Time Together
Shapoorji Pallonji Joyville Vista Pune | Spend Your Family Time TogetherShapoorji Pallonji Joyville Vista Pune | Spend Your Family Time Together
Shapoorji Pallonji Joyville Vista Pune | Spend Your Family Time Together
 
call girls in ganesh nagar Delhi 8264348440 ✅ call girls ❤️
call girls in ganesh nagar Delhi 8264348440 ✅ call girls ❤️call girls in ganesh nagar Delhi 8264348440 ✅ call girls ❤️
call girls in ganesh nagar Delhi 8264348440 ✅ call girls ❤️
 
Call Girls in shastri nagar Delhi 8264348440 ✅ call girls ❤️
Call Girls in shastri nagar Delhi 8264348440 ✅ call girls ❤️Call Girls in shastri nagar Delhi 8264348440 ✅ call girls ❤️
Call Girls in shastri nagar Delhi 8264348440 ✅ call girls ❤️
 
Kohinoor Flats In Hinjewadi Phase 2 | Homes Built To Suit Your Needs
Kohinoor Flats In Hinjewadi Phase 2 | Homes Built To Suit Your NeedsKohinoor Flats In Hinjewadi Phase 2 | Homes Built To Suit Your Needs
Kohinoor Flats In Hinjewadi Phase 2 | Homes Built To Suit Your Needs
 
2k Shot Call girls Aiims Delhi 9205541914
2k Shot Call girls Aiims Delhi 92055419142k Shot Call girls Aiims Delhi 9205541914
2k Shot Call girls Aiims Delhi 9205541914
 
Girls in Kalyanpuri }Delhi↫8447779280↬Escort Service. In Delhi NCR
Girls in Kalyanpuri }Delhi↫8447779280↬Escort Service. In Delhi NCRGirls in Kalyanpuri }Delhi↫8447779280↬Escort Service. In Delhi NCR
Girls in Kalyanpuri }Delhi↫8447779280↬Escort Service. In Delhi NCR
 
Purva Soukhyam in Guduvancheri Chennai.pdf
Purva Soukhyam in Guduvancheri Chennai.pdfPurva Soukhyam in Guduvancheri Chennai.pdf
Purva Soukhyam in Guduvancheri Chennai.pdf
 
Call Girls In Mayur Vihar Delhi ☆↫8447779280 ❤Escorts Service In Delhi
Call Girls In Mayur Vihar Delhi ☆↫8447779280 ❤Escorts Service In DelhiCall Girls In Mayur Vihar Delhi ☆↫8447779280 ❤Escorts Service In Delhi
Call Girls In Mayur Vihar Delhi ☆↫8447779280 ❤Escorts Service In Delhi
 
Greater Vancouver Realtors Statistics Package April 2024
Greater Vancouver Realtors Statistics Package April 2024Greater Vancouver Realtors Statistics Package April 2024
Greater Vancouver Realtors Statistics Package April 2024
 
9990771857 Call Girls in Dwarka Sector 2 Delhi (Call Girls) Delhi
9990771857 Call Girls in Dwarka Sector 2 Delhi (Call Girls) Delhi9990771857 Call Girls in Dwarka Sector 2 Delhi (Call Girls) Delhi
9990771857 Call Girls in Dwarka Sector 2 Delhi (Call Girls) Delhi
 
Maha Mauka Squarefeet Brochure |Maha Mauka Squarefeet PDF Brochure|
Maha Mauka Squarefeet Brochure |Maha Mauka Squarefeet PDF Brochure|Maha Mauka Squarefeet Brochure |Maha Mauka Squarefeet PDF Brochure|
Maha Mauka Squarefeet Brochure |Maha Mauka Squarefeet PDF Brochure|
 
Premium Villa Projects in Sarjapur Road Bengaluru
Premium Villa Projects in Sarjapur Road BengaluruPremium Villa Projects in Sarjapur Road Bengaluru
Premium Villa Projects in Sarjapur Road Bengaluru
 

Destaque

PEPSICO Presentation to CAGNY Conference Feb 2024
PEPSICO Presentation to CAGNY Conference Feb 2024PEPSICO Presentation to CAGNY Conference Feb 2024
PEPSICO Presentation to CAGNY Conference Feb 2024Neil Kimberley
 
Content Methodology: A Best Practices Report (Webinar)
Content Methodology: A Best Practices Report (Webinar)Content Methodology: A Best Practices Report (Webinar)
Content Methodology: A Best Practices Report (Webinar)contently
 
How to Prepare For a Successful Job Search for 2024
How to Prepare For a Successful Job Search for 2024How to Prepare For a Successful Job Search for 2024
How to Prepare For a Successful Job Search for 2024Albert Qian
 
Social Media Marketing Trends 2024 // The Global Indie Insights
Social Media Marketing Trends 2024 // The Global Indie InsightsSocial Media Marketing Trends 2024 // The Global Indie Insights
Social Media Marketing Trends 2024 // The Global Indie InsightsKurio // The Social Media Age(ncy)
 
Trends In Paid Search: Navigating The Digital Landscape In 2024
Trends In Paid Search: Navigating The Digital Landscape In 2024Trends In Paid Search: Navigating The Digital Landscape In 2024
Trends In Paid Search: Navigating The Digital Landscape In 2024Search Engine Journal
 
5 Public speaking tips from TED - Visualized summary
5 Public speaking tips from TED - Visualized summary5 Public speaking tips from TED - Visualized summary
5 Public speaking tips from TED - Visualized summarySpeakerHub
 
ChatGPT and the Future of Work - Clark Boyd
ChatGPT and the Future of Work - Clark Boyd ChatGPT and the Future of Work - Clark Boyd
ChatGPT and the Future of Work - Clark Boyd Clark Boyd
 
Getting into the tech field. what next
Getting into the tech field. what next Getting into the tech field. what next
Getting into the tech field. what next Tessa Mero
 
Google's Just Not That Into You: Understanding Core Updates & Search Intent
Google's Just Not That Into You: Understanding Core Updates & Search IntentGoogle's Just Not That Into You: Understanding Core Updates & Search Intent
Google's Just Not That Into You: Understanding Core Updates & Search IntentLily Ray
 
Time Management & Productivity - Best Practices
Time Management & Productivity -  Best PracticesTime Management & Productivity -  Best Practices
Time Management & Productivity - Best PracticesVit Horky
 
The six step guide to practical project management
The six step guide to practical project managementThe six step guide to practical project management
The six step guide to practical project managementMindGenius
 
Beginners Guide to TikTok for Search - Rachel Pearson - We are Tilt __ Bright...
Beginners Guide to TikTok for Search - Rachel Pearson - We are Tilt __ Bright...Beginners Guide to TikTok for Search - Rachel Pearson - We are Tilt __ Bright...
Beginners Guide to TikTok for Search - Rachel Pearson - We are Tilt __ Bright...RachelPearson36
 
Unlocking the Power of ChatGPT and AI in Testing - A Real-World Look, present...
Unlocking the Power of ChatGPT and AI in Testing - A Real-World Look, present...Unlocking the Power of ChatGPT and AI in Testing - A Real-World Look, present...
Unlocking the Power of ChatGPT and AI in Testing - A Real-World Look, present...Applitools
 
12 Ways to Increase Your Influence at Work
12 Ways to Increase Your Influence at Work12 Ways to Increase Your Influence at Work
12 Ways to Increase Your Influence at WorkGetSmarter
 
Ride the Storm: Navigating Through Unstable Periods / Katerina Rudko (Belka G...
Ride the Storm: Navigating Through Unstable Periods / Katerina Rudko (Belka G...Ride the Storm: Navigating Through Unstable Periods / Katerina Rudko (Belka G...
Ride the Storm: Navigating Through Unstable Periods / Katerina Rudko (Belka G...DevGAMM Conference
 

Destaque (20)

Skeleton Culture Code
Skeleton Culture CodeSkeleton Culture Code
Skeleton Culture Code
 
PEPSICO Presentation to CAGNY Conference Feb 2024
PEPSICO Presentation to CAGNY Conference Feb 2024PEPSICO Presentation to CAGNY Conference Feb 2024
PEPSICO Presentation to CAGNY Conference Feb 2024
 
Content Methodology: A Best Practices Report (Webinar)
Content Methodology: A Best Practices Report (Webinar)Content Methodology: A Best Practices Report (Webinar)
Content Methodology: A Best Practices Report (Webinar)
 
How to Prepare For a Successful Job Search for 2024
How to Prepare For a Successful Job Search for 2024How to Prepare For a Successful Job Search for 2024
How to Prepare For a Successful Job Search for 2024
 
Social Media Marketing Trends 2024 // The Global Indie Insights
Social Media Marketing Trends 2024 // The Global Indie InsightsSocial Media Marketing Trends 2024 // The Global Indie Insights
Social Media Marketing Trends 2024 // The Global Indie Insights
 
Trends In Paid Search: Navigating The Digital Landscape In 2024
Trends In Paid Search: Navigating The Digital Landscape In 2024Trends In Paid Search: Navigating The Digital Landscape In 2024
Trends In Paid Search: Navigating The Digital Landscape In 2024
 
5 Public speaking tips from TED - Visualized summary
5 Public speaking tips from TED - Visualized summary5 Public speaking tips from TED - Visualized summary
5 Public speaking tips from TED - Visualized summary
 
ChatGPT and the Future of Work - Clark Boyd
ChatGPT and the Future of Work - Clark Boyd ChatGPT and the Future of Work - Clark Boyd
ChatGPT and the Future of Work - Clark Boyd
 
Getting into the tech field. what next
Getting into the tech field. what next Getting into the tech field. what next
Getting into the tech field. what next
 
Google's Just Not That Into You: Understanding Core Updates & Search Intent
Google's Just Not That Into You: Understanding Core Updates & Search IntentGoogle's Just Not That Into You: Understanding Core Updates & Search Intent
Google's Just Not That Into You: Understanding Core Updates & Search Intent
 
How to have difficult conversations
How to have difficult conversations How to have difficult conversations
How to have difficult conversations
 
Introduction to Data Science
Introduction to Data ScienceIntroduction to Data Science
Introduction to Data Science
 
Time Management & Productivity - Best Practices
Time Management & Productivity -  Best PracticesTime Management & Productivity -  Best Practices
Time Management & Productivity - Best Practices
 
The six step guide to practical project management
The six step guide to practical project managementThe six step guide to practical project management
The six step guide to practical project management
 
Beginners Guide to TikTok for Search - Rachel Pearson - We are Tilt __ Bright...
Beginners Guide to TikTok for Search - Rachel Pearson - We are Tilt __ Bright...Beginners Guide to TikTok for Search - Rachel Pearson - We are Tilt __ Bright...
Beginners Guide to TikTok for Search - Rachel Pearson - We are Tilt __ Bright...
 
Unlocking the Power of ChatGPT and AI in Testing - A Real-World Look, present...
Unlocking the Power of ChatGPT and AI in Testing - A Real-World Look, present...Unlocking the Power of ChatGPT and AI in Testing - A Real-World Look, present...
Unlocking the Power of ChatGPT and AI in Testing - A Real-World Look, present...
 
12 Ways to Increase Your Influence at Work
12 Ways to Increase Your Influence at Work12 Ways to Increase Your Influence at Work
12 Ways to Increase Your Influence at Work
 
ChatGPT webinar slides
ChatGPT webinar slidesChatGPT webinar slides
ChatGPT webinar slides
 
More than Just Lines on a Map: Best Practices for U.S Bike Routes
More than Just Lines on a Map: Best Practices for U.S Bike RoutesMore than Just Lines on a Map: Best Practices for U.S Bike Routes
More than Just Lines on a Map: Best Practices for U.S Bike Routes
 
Ride the Storm: Navigating Through Unstable Periods / Katerina Rudko (Belka G...
Ride the Storm: Navigating Through Unstable Periods / Katerina Rudko (Belka G...Ride the Storm: Navigating Through Unstable Periods / Katerina Rudko (Belka G...
Ride the Storm: Navigating Through Unstable Periods / Katerina Rudko (Belka G...
 

Swedish Cross Border Investment

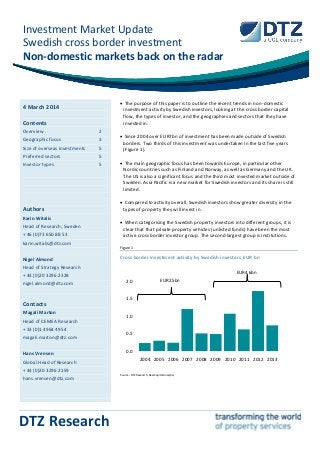
  • 1. Investment Market Update Swedish cross border investment Non-domestic markets back on the radar DTZ Research 4 March 2014 Contents Overview 2 Geographic focus 3 Size of overseas investments 5 Preferred sectors 5 Investor types 5 Authors Karin Witalis Head of Research, Sweden + 46 (0)73 650 88 53 karin.witalis@dtz.com Nigel Almond Head of Strategy Research + 44 (0)20 3296 2328 nigel.almond@dtz.com Contacts Magali Marton Head of CEMEA Research + 33 (0)1 4964 4954 magali.marton@dtz.com Hans Vrensen Global Head of Research + 44 (0)20 3296 2159 hans.vrensen@dtz.com  The purpose of this paper is to outline the recent trends in non-domestic investment activity by Swedish investors, looking at the cross border capital flow, the types of investor, and the geographies and sectors that they have invested in.  Since 2004 over EUR7bn of investment has been made outside of Swedish borders. Two thirds of this investment was undertaken in the last five years (Figure 1).  The main geographic focus has been towards Europe, in particular other Nordic countries such as Finland and Norway, as well as Germany and the UK. The US is also a significant focus and the third most invested market outside of Sweden. Asia Pacific is a new market for Swedish investors and its share is still limited.  Compared to activity overall, Swedish investors show greater diversity in the types of property they will invest in.  When categorising the Swedish property investors into different groups, it is clear that that private property vehicles (unlisted funds) have been the most active cross border investor group. The second largest group is institutions. Figure 1 Cross border investment activity by Swedish investors, EUR bn Source: DTZ Research, Real Capital Analytics 0.0 0.5 1.0 1.5 2.0 2004 2005 2006 2007 2008 2009 2010 2011 2012 2013 EUR2.5bn EUR4.6bn
  • 2. Swedish cross border investment www.dtz.com Investment Market Update 2 Overview Renewed activity post financial crisis The 1980s saw strong levels of commercial real estate investment by Swedish investors outside of Sweden. However, this activity stopped abruptly with the banking and property crisis in the early 1990s. Since then the majority of Swedish investment has been focused domestically. Yet, there have been exceptions to this rule, and over the last five years a growing stream of Swedish capital has been invested in non-domestic markets. Since 2004 over EUR7bn of investment has been made outside of Swedish borders (Figure 2). Although this represents just 12% of total Swedish capital invested, it is noteworthy that two thirds of this overseas investment has been deployed in the last five years (Figure 3). Over the past decade cross border activity has been on an upward trend. There have been notable spikes (Figure 3). The first in 2007 coincided with the peak in global investment activity. Since then we have also seen stronger levels of activity in 2010 and 2012. In 2010 most of the cross border investment was in Norway and to a lesser extent Germany. In 2012 Swedish investors took big leaps into the British and American markets. Purchasing activity only highlights half the story. Swedish investors have been active on the sell side as well. In the five year period 2004-2008, Swedish investors were typically net sellers abroad, with net sales totalling EUR1.5bn over the period (Figure 4). This was actually consistent with domestic activity, where Swedish investors were also net sellers at home by almost EUR13bn. In the wake of the financial crisis starting in 2008 we have seen growing activity from Swedish investors both at home and abroad. Sweden was not impacted by the financial crisis relative to other European nations. Also, in the years directly after the start of the financial crisis national institutional investors and private investors were able to ensure high liquidity in the major markets. This led to increasing activity with Swedish investors once again net buyers in their home markets each year since 2009. A similar trend has been seen overseas with Swedish net buying over the period 2009-13 reaching EUR0.7bn, and positive with the exception of 2012, which saw a significant sale in Norway of close to EUR1bn. This was more than enough to wipe-out the record EUR1.7bn of cross border acquisitions that year (Figure 4). Figure 2 Swedish capital invested EUR bn and % cross border Source: DTZ Research, Real Capital Analytics Figure 3 Swedish cross border investments 2004-12, EUR bn Source: DTZ Research, Real Capital Analytics Figure 4 Swedish cross border net investment, EUR bn Source: DTZ Research, Real Capital Analytics 0% 5% 10% 15% 20% 25% 0 2 4 6 8 10 12 2004 2005 2006 2007 2008 2009 2010 2011 2012 2013 Domestic Cross border % cross border (RHS) 0.0 0.5 1.0 1.5 2.0 2004 2005 2006 2007 2008 2009 2010 2011 2012 2013 EUR2.5bn EUR4.6bn -3 -2 -2 -1 -1 0 1 1 2 2 -2.5 -2.0 -1.5 -1.0 -0.5 0.0 0.5 1.0 1.5 2.0 2004 2005 2006 2007 2008 2009 2010 2011 2012 2013 Investments Sales Net
  • 3. Swedish cross border investment www.dtz.com Investment Market Update 3 Geographic focus As outlined earlier, the majority (close to 90%) of Swedish investment has been in Sweden itself. But the proportion of total investment going overseas has grown, averaging 14% of total investment in the last five years. This compares to 7% in the previous five year period. In terms of investments overseas, the main focus has been towards Europe (Figure 5), representing 84% of cross border investment over the last ten years. North America represents a further 13% of investment, with all capital deployed in the US. Asia Pacific is a new market for Swedish investors and its share is no more than 3%. Although relatively modest in a Global context, these flows highlight how some Swedish investors are taking the lead in investing far and wide. Focus on home region The majority of investment in Europe has been directed towards other Nordic countries - Denmark, Finland and Norway (Figure 6). This trend is not surprising, as investors focus on those markets closer to home and, ones they know best. Finland and Norway have been most favoured over Denmark in the last five years. The reduced activity in Denmark is not surprising, given this market has been more exposed to the banking crisis and problematic real estate loans relative to neighbouring markets. Outside the Nordic region, Swedish investors have preferred large, established markets including the UK and Germany. This has been the case both before and after the financial crisis. Emerging interest for the US and Asia Pacific More recently we have seen growing activity in the US which is the third most invested market outside Sweden in the last five years, with volumes totalling close to EUR0.8bn, and spread across a number of US cities but notably San Jose, Boston and Washington DC. The US is a large market, similar in size to the whole of Europe, which provides many investment opportunities. Pricing over recent years has also been attractive, with relatively high levels of liquidity to be found in major markets. Investment across Asia Pacific in the last five years has been entirely focussed on China. The investments in these markets have mainly been for occupational purposes as the Swedish retailer, IKEA, has expanded its operations in a number of key cities. Figure 5 Swedish capital invested in different continents, EUR bn Source: DTZ Research, Real Capital Analytics Figure 6 Country allocation 2004-2008 vs 2009-2013 Source: DTZ Research, Real Capital Analytics 0.0 0.5 1.0 1.5 2.0 2004 2005 2006 2007 2008 2009 2010 2011 2012 2013 Rest Europe North America Asia Pacific 0% 10% 20% 30% 40% 50% 60% 70% 80% 90% 100% 2004-08 2009-13 Norway Finland US UK Germany China Denmark Other
  • 4. Swedish cross border investment www.dtz.com Investment Market Update 4 Figure 7 Swedish cross border flows 2009-13 in key overseas markets Source: DTZ Research, Real Capital Analytics Stronger activity in neighbouring markets Over the last five years Norway and Finland have been key markets for Swedish investors with over EUR1bn invested in each market over this period. The close proximity to Sweden means Swedish investors are able to invest with relative ease. They are also markets where we have seen significant sales over the same period (Figure 7). Only in Denmark has investment been low. Higher net investment further afield The next significant markets are the US and UK, where over EUR0.7bn has been invested in each market. The US has also seen a relatively higher number of sales too, although both show strong levels of net investment. Other key investment markets have been China, the Czech Republic and Germany. With the exception of the latter, sales have been relatively low to date. Outside these markets investment have been relatively limited. €1,150m €70m €370m €15m €0m €1,000m €400m €300m €180m €1,600m €750m €760m €35m €60m €880m €100m €340m €0m €0m €200m
  • 5. Swedish cross border investment www.dtz.com Investment Market Update 5 Size of overseas investments When investing overseas, Swedish investors have typically focussed on larger lot sizes. The majority (over 80%) of overseas investments are for lots in excess of EUR200m (Figure 8). This is not surprising. Overseas investments are typically larger as investors seek to deploy as much money in fewer deals to reduce travel, due diligence and acquisition costs. On average deals have been EUR44m in the last five years. This compares to EUR25m at home. Preferred sectors Compared to activity overall, Swedish investors show greater diversity in the types of property they will invest in (Figure 9). Offices typically account for 50% of investment in Europe. Based on recent activity, offices account for just 30% of investment, with retail dominating at over 40%. Other sectors, notably healthcare are also a focus for investment, representing 15% of acquisitions over the last five years 1 . Even prior to 2009, Swedish investors were more diversified in their choice of investments with mixed use and other assets (mostly healthcare) in focus. Investor types When categorising the Swedish property investors into different groups, it is clear that that private property vehicles (unlisted funds) have been the most active cross border investor group, placing nearly EUR3bn in non- domestic markets. The second largest group is institutions with EUR855m invested abroad. Private property companies have also been active with EUR677m invested outside Sweden. When dividing the series into before and after the start of the financial crisis, some interesting patterns emerge (Figure 10). Institutions have grown their share abroad, while listed companies and private investors have been relatively less active. Private property vehicles were the largest cross border investor before the financial crisis. We have also see growing corporate activity, reflecting investments by IKEA as outlined earlier. 1 Note that residential and hotel property is not included in this study. Figure 8 Size of overseas investments Source: DTZ Research, Real Capital Analytics Figure 9 Sector allocation for Swedish cross border investments Source: DTZ Research, Real Capital Analytics Figure 10 Investor type Source: DTZ Research, Real Capital Analytics 0% 20% 40% 60% 80% 100% 2004-08 2009-13 Over EUR500m EUR200-500m EUR50-200m Under EUR50m 0% 20% 40% 60% 80% 100% 2004-08 2009-13 Office Retail Industrial Mixed use Other 0% 20% 40% 60% 80% 100% 2004-08 2009-13 Private Property Vehicle Institution Corporate Private investor/ Company Listed companies Other
  • 6. Swedish cross border investment www.dtz.com Investment Market Update 6 Other DTZ Research Reports Other research reports can be downloaded from www.dtz.com/research. These include: Occupier Perspective Updates on occupational markets from an occupier perspective, with commentary, analysis, charts and data. Global Occupancy Costs Offices Global Occupancy Costs Logistics Obligations of Occupation Americas Obligations of Occupation Asia Pacific Obligations of Occupation EMEA Global Office Review Regional Headquarters Asia Pacific- November 2013 Sweden - Computer Games developers – November 2013 India Office Demand and Trends Survey 2012-13 Poland Banking Sector - January 2013 Property Times Regular updates on occupational markets from a landlord perspective, with commentary, charts, data and forecasts. Coverage includes Asia Pacific, Bangkok, Beijing, Berlin, Brisbane, Bristol, Brussels, Budapest, Central London, Chengdu, Chongqing, Dalian, Edinburgh, Europe, Frankfurt, Glasgow, Guangzhou, Hangzhou, Ho Chi Minh City, Hong Kong, India, Jakarta, Japan, Kuala Lumpur, Luxembourg, Madrid, Manchester, Melbourne, Milan, Nanjing, Newcastle, Paris, Poland, Prague, Qingdao, Rome, Seoul, Shanghai, Shenyang, Shenzhen, Singapore, Stockholm, Sydney, Taipei, Tianjin, Ukraine, Warsaw, Wuhan, Xian. Investment Market Update Regular updates on investment market activity, with commentary, significant deals, charts, data and forecasts. Coverage includes Asia Pacific, Australia, Belgium, Czech Republic, Europe, France, Germany, Italy, Japan, Mainland China, South East Asia, Spain, Sweden, UK. Money into Property For more than 35 years, this has been DTZ's flagship research report, analysing invested stock and capital flows into real estate markets across the world. It measures the development and structure of the global investment market. Available for Global, Asia Pacific, Europe, North America and UK. Foresight Quarterly commentary, analysis and insight into our in- house data forecasts, including the DTZ Fair Value Index™. Available for Global, Asia Pacific, Europe and UK. In addition we publish an annual outlook report. Insight Thematic, ad hoc, topical and thought leading reports on areas and issues of specific interest and relevance to real estate markets. China Investment Market Sentiment Survey January 2014 China The Technology Sector January 2014 Insight Czech Republic Green buildings December 2013 Net Debt Funding Gap - November 2013 UK secondary market pricing - October 2013 German Open Ended Funds - October 2013 Great Wall of Money - October 2013 Quantitative Easing - UK Regions - September 2013 Singapore Government Land Sales - September 2013 UK lending market -September 2013 Quantitative Easing - August 2013 Property Investment Guide Asia Pacific 2013-2014 DTZ Research Data Services For more detailed data and information, the following are available for subscription. Please contact graham.bruty@dtz.com for more information.  Property Market Indicators Time series of commercial and industrial market data in Asia Pacific and Europe.  Real Estate Forecasts, including the DTZ Fair Value Index TM Five-year rolling forecasts of commercial and industrial markets in Asia Pacific, Europe and the USA.  Investment Transaction Database Aggregated overview of investment activity in Asia Pacific and Europe.  Money into Property DTZ’s flagship research product for over 35 years providing capital markets data covering capital flows, size, structure, ownership, developments and trends, and findings of annual investor and lender intention surveys.
  • 7. www.dtz.com Investment Market Update 7 DTZ Research DTZ Research Contacts Global Head of Research Hans Vrensen Phone: +44 (0)20 3296 2159 Email: hans.vrensen@dtz.com Head of Strategy Research Nigel Almond Phone: +44 (0)20 3296 2328 Email: nigel.almond@dtz.com Head of Research, Sweden Karin Witalis Phone: +46 (0)8 671 34 26 Email: karin.witalis@dtz.com Head of UK Research Global Head of Forecasting Fergus Hicks Phone: +44 (0)20 3296 2307 Email: fergus.hicks@dtz.com Head of CEMEA Research Magali Marton Phone: +33 1 49 64 49 54 Email: magali.marton@dtz.com DTZ Business Contacts Chief Executive, EMEA John Forrester Phone: +44 (0)20 3296 2002 Email: john.forrester@dtz.com Head of Capital Markets, Sweden Fredrik Lidjan Phone: +46 (0)8 671 34 76 Email: fredrik.lidjan@dtz.com Managing Director, Sweden Agneta Jacobsson Phone: +46 (0)8 671 34 55 Email: agneta.jacobsson@dtz.com Head of Valuation, Sweden Sven Erik Hugosson Phone: +46 (0)8 671 34 59 svenerik.hugosson@dtz.com DISCLAIMER This report should not be relied upon as a basis for entering into transactions without seeking specific, qualified, professional advice. Whilst facts have been rigorously checked, DTZ can take no responsibility for any damage or loss suffered as a result of any inadvertent inaccuracy within this report. Information contained herein should not, in whole or part, be published, reproduced or referred to without prior approval. Any such reproduction should be credited to DTZ. © DTZ March 2014