NFIB Small Business Optimism Index Dropped in March 2011
•Transferir como PPT, PDF•
0 gostou•584 visualizações

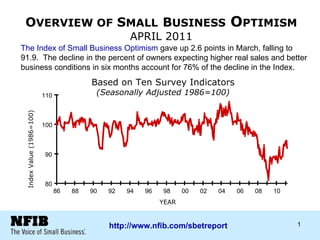
The Index of Small Business Optimism gave up 2.6 points in March, falling to 91.9. The decline in the percent of owners expecting higher real sales and better business conditions in six months account for 76% of the decline in the Index. http://www.nfib.com/sbetreport

Recomendados
Recomendados
Mais conteúdo relacionado
Mais de NFIB
Mais de NFIB (14)
Último
Último (13)
NFIB Small Business Optimism Index Dropped in March 2011
- 1. O VERVIEW OF S MALL B USINESS O PTIMISM APRIL 2011 Based on Ten Survey Indicators (Seasonally Adjusted 1986=100) 80 90 100 110 86 88 90 92 94 96 98 00 02 04 06 08 10 Index Value (1986=100) YEAR Index Value (1986=100) The Index of Small Business Optimism gave up 2.6 points in March, falling to 91.9. The decline in the percent of owners expecting higher real sales and better business conditions in six months account for 76% of the decline in the Index.
- 2. S MALL B USINESS O UTLOOK APRIL 2011 Good Time to Expand and Expected General Business Conditions January 1986 to March 2011 (Seasonally Adjusted) -40 -20 0 20 40 60 80 0 10 20 30 86 88 90 92 94 96 98 00 02 04 06 08 10 Percent "Good Time to Expand" (thick line) Percent "Better" Minus "Worse" Expected General Business Conditions (thin line) YEAR Percent “Good Time to Expand” Percent “Better” Minus “Worse” Expected General Business Conditions
- 3. Actual Last Three Months January 1986 to March 2011 (Seasonally Adjusted) S MALL B USINESS E ARNINGS APRIL 2011 Net Percent -50 -40 -30 -20 -10 0 86 88 90 92 94 96 98 00 02 04 06 08 10 Net Percent YEAR
- 4. S MALL B USINESS S ALES APRIL 2011 Actual (Prior Three Months) and Expected (Next Three Months) January 1986 to March 2011 (Seasonally Adjusted) Net Percent -40 -30 -20 -10 0 10 20 30 40 50 86 88 90 92 94 96 98 00 02 04 06 08 10 Expected Actual Net Percent YEAR
- 5. S MALL B USINESS P RICES APRIL 2011 Actual Last Three Months and Planned Next Three Months January 1986 to March 2011 (Seasonally Adjusted) Net Percent of Firms -30 -20 -10 0 10 20 30 40 86 88 90 92 94 96 98 00 02 04 06 08 10 Planned Actual Net Percent of Firms YEAR
- 6. S MALL B USINESS E MPLOYMENT APRIL 2011 Planned Next Three Months and Current Job Openings January 1986 to March 2011 (Seasonally Adjusted) Percent -10 0 10 20 30 40 86 88 90 92 94 96 98 00 02 04 06 08 10 Planned Job Openings YEAR Percent
- 7. S MALL B USINESS C OMPENSATION APRIL 2011 Actual Last Three Months and Planned Next Three Months January 1986 to March 2011 (Seasonally Adjusted) Net Percent -5 0 5 10 15 20 25 30 35 40 86 88 90 92 94 96 98 00 02 04 06 08 10 Net Percent YEAR Planned Higher Actual Higher
- 8. S MALL B USINESS P RICES & L ABOR C OMPENSATION APRIL 2011 Net Percent Increase and Net Percent Compensation (Seasonally Adjusted) -30 -20 -10 0 10 20 30 40 86 88 90 92 94 96 98 00 02 04 06 08 10 Actual Prices Actual Compensation YEAR
- 9. S MALL B USINESS C REDIT C ONDITIONS APRIL 2011 Loan Availability Compared to Three Months Ago ( For the population borrowing at least once every three months) January 1986 to March 2011 Net Percent of Firms -18 -16 -14 -12 -10 -8 -6 -4 -2 0 2 86 88 90 92 94 96 98 00 02 04 06 08 10 Net Percent of Firms YEAR