NDGeospatialSummit2019 - Using GIS and Machine-Learning to Recognize Subtle Landscape Features Associated with Glacial Lake Agassiz
•
1 gostou•127 visualizações

Presented during the 2019 North Dakota Geospatial Summit in Bismarck, ND, October 22-23.

Recomendados
Recomendados
Mais conteúdo relacionado
Mais procurados
Mais procurados (20)
Semelhante a NDGeospatialSummit2019 - Using GIS and Machine-Learning to Recognize Subtle Landscape Features Associated with Glacial Lake Agassiz
Semelhante a NDGeospatialSummit2019 - Using GIS and Machine-Learning to Recognize Subtle Landscape Features Associated with Glacial Lake Agassiz (20)
Mais de North Dakota GIS Hub
Mais de North Dakota GIS Hub (20)
Último
Último (20)
NDGeospatialSummit2019 - Using GIS and Machine-Learning to Recognize Subtle Landscape Features Associated with Glacial Lake Agassiz
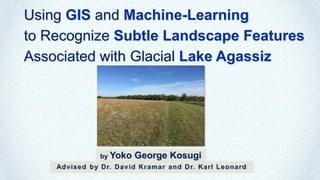
- 1. by Yoko George Kosugi Advised by Dr. David Kramar and Dr. Karl Leonard Using GIS and Machine-Learning to Recognize Subtle Landscape Features Associated with Glacial Lake Agassiz
- 2. Outline • Background • Objective • Location • Methodology • Results • Conclusion • Discussion - Red River Valley and Lake Agassiz - Recognizing Shoreline Complex of Lake Agassiz - Clay County, MN - DEM, ArcGIS, R, and Rattle - Shoreline complex are well separated - This model is useful to recognize subtle features - Further studies, comparisons
- 3. Background Red River Valley and Lake Agassiz • The Red River Valley is a lake plain formed by the ancient glacial lake Agassiz. • Transported silt and clay deposited in the bottom of the wide ancient lake, made a vast flat region near the center of the basin, which is considered to be one of the most productive agricultural regions in the world. • MN and ND falls onto the southernmost end of the lake. Figure 1 – The position of Lake Agassiz Partially from Teller, Boyd, Yang, et al. 2005, fig.1. The red lines are added by the author.
- 4. Red River Valley and Lake Agassiz • The water level of Lake Agassiz had changed in relation to the paleoclimate and position of ice blocks existed. The lake’s drainage course also changed into several directions through time due to the isostatic rebound in addition to the factors above. • Significant topography exists near basin margins where a series of shoreline complex (beach ridges and longshore bars) deposits are located. • Landscape features can be very subtle, especially minor ones, but they can have a significant influence on the evolution of landforms in the region. Figure 2 – Changes of the elevation of Lake Agassiz Partially from Liu, Fisher, et al, 2014, fig.2. Figure 3 – Waves and Offshore bars Partially from The Geographer Online Website Background
- 5. Objective Recognizing Shoreline Complex of Lake Agassiz To assist in the recognition of the features, this study is using GIS and machine-learning algorithms applied to the DEMs (digital elevation models) of the region. Lake Agassiz’s shoreline complex is: • Significant to explain the evolution of landscape in the region. The shorelines of Lake Agassiz had changed again and again through time, and it is closely related to the past climate transition. Subtle topographic highs led to the accumulation thick deposits of aeolian sand over weakly developed buried soil horizons which may preserve older artifacts of ancient people. • Useful to assist in the location of archeological sites. So, if we know where the shoreline features are, we are more likely to find well-preserved artifacts.
- 6. Study Area Clay County, Minnesota • Clay county lies in the middle-west of Minnesota. Its total area is 2730 km² (1053 mi²). • The Red River comprises its western boundary and divides MN and ND. • The Buffalo River, a tributary of the Red River, cuts through the middle of the county. • The Minnesota State University Moorhead Regional Science Center (RSC) is located in the middle of the county. • 400 acres (1.6 km², 0.6 mi²) of prairie, riparian forest habitat and river communities. • Some shoreline features of Lake Agassiz are in this area. MSUM Regional Science Center
- 7. • DEM (digital elevation model) data for Clay county was downloaded from MN web site (1m spatial resolution - UTM Zone 15N) Methodology (1) Creating Surfaces Focal Statistics (e.g. 3 x 3 sum) ESRI ArcGIS for Desktop Website hillshade effect Z = 5 DEM TPI 5 x 5 • Max, min, and mean DEM were created through focal statistics in neighborhood tool in ArcGIS 10.6.1. Focal stats calculates for each input cell location a statistic of the values within specified neighborhood around it. • TPI (topographic position index) was created from those DEMs. TPI is a measure of topographic roughness. It is calculated by the formula below. (mean DEM – min DEM) (max DEM – min DEM) • We compared (3 x 3), (5 x 5), (10 x 10) neighborhood and chose 5 x 5.
- 8. Methodology (2) Entire Area • After that, we created polygons. 95 polygons – likely to be shoreline features (value =1) 97 polygons – unlikely to be shoreline features (value = 0) • Both polygons were merged together into a new single layer. • Then, an additional 5 surfaces were created from the DEM: Slope, Aspect, Curvature, Curvature Profile, and Curvature Plan. Creating Surfaces CurvatureSlope Aspect DEM TPI
- 9. • Zonal statistics were collected for the polygons for each layer. Those values were merged as a csv file and joined to the polygon layer. • R v.3.5.2. and Rattle were used for statistical analysis (Random Forests) to identify landform metrics that are significantly related to the shoreline complex. • Statistics showed that: TPI, aspect, slope, and curvature – as significant Curvature plan – as not significant • 15 random points were generated within each polygon. Total 2880 points – either shoreline complex / non-shoreline 192 polygons *15 = 2880 points • We extracted the raster values for each of the landform metrics that was associated with the location of the random points. Methodology (3) identifying Factors
- 10. • MGET (Marine Geospatial Ecology Tool) plug-in tools for ArcGIS + Python 2.7 were used to develop a Random Forest model using four variables identified as significant (TPI, aspect, slope, and curvature) as factors. Statistics in Rattle indicated that the results became stable at around 250 trees. (Formula : factor(OSB) ~ Aspect + Curvature + Slope + TPI) • However, one raster layer for entire Clay county is 12 GB, and we needed 4 rasters. Large size of the dataset could not be run on a standard laptop computer. • Thus, we separated the study area into 7 smaller areas to facilitate data processing. • Even after doing so, one small-area layer was about 2 - 3 GB, which still took 8 - 11 hours to process. Total processing time was 8 -11 * 7. • Resulting small-area models were merged back together. (It was almost the limit for my laptop power and took fairly long time.) Methodology (4) Building a Model
- 11. Results (1) Created Random Forest Prediction Surface Entire Clay County Mid-Southern Part Upper part – a road is recognized as non-shorelines Lower part – faint features are detected
- 12. Northern Part Western Part Results (2) Comparison to the existing study The model fit well to known major shorelines Thinner lines are clearly visible. They run through the area in the similar directions. Mid-Northern Part Mid-Western Part Thinner lines are separated on the random forest model while they are difficult to find in DEM. Created Random Forest Prediction Surface
- 13. • The estimates of error rate is 31.6 %. The error rate for full model is 9.9 % More than 89 % of the features are correctly classified. • Those bar-graphs indicate the importance of factors. The upper left graph shows that if the factor is removed, how much the accuracy decreases. We can see slope is the most important factor. • The predicted vs observed values for the full model. The pseudo R-square is 0.71. • The ROC curve for the model AUC shows how well the model separates the data. AUC = 0.97 Significantly high. Results (3) Statistics for the model Rates Rates
- 14. Results (4) Statistics Comparison from Zonal Statistics data (mean) for the merged polygon layer from Random Points data ROC curves for each of the three models (Validation, Testing, Full) indicate excellent discrimination between shoreline complex and non- shoreline complex. The final graph of the full model showing predicted versus observed values supports this notion.
- 15. • We walked through the Norcross shoreline and the Herman longshore bars in the RSC. Major shorelines are visible and slightly higher, and longshore bars are more subtle. • We used a GPS unit and compared the coordinates for our model to field check these features. In addition, 4 hand auger samples were done and yielded the sediments (coarse sand and gravel) expected from these features. • Some points in the model recognized the features a little offset from the real ridges of the shorelines. The model may have picked up the transition zones where slope is changing rather than flat ridge tops. Results (5) - at Regional Science Center Norcross shoreline Herman longshore bar
- 16. • The random forest model works well to identify the cells that represent features of Lake Agassiz shoreline complex. • It is capable of detecting subtle features and discriminating them from roads. Conclusion • This model was well fit to the existing study of shorelines and off- shore bars of historic Lake Agassiz. • To evaluate the model more in detail, we are now planning additional field tests with soil and sediment samples.
- 17. Discussion (1) • The model occasionally detected rivers as shoreline features, though a-priori knowledge of the area allows us to discriminate these after model completion. It is likely that additional training would limit this issue. Since both of them are related to the flow of water, further learning is needed. • Additional processing using the “Regions”, “Set Null”, and “Nibble” tools would clean up some of the “salt and pepper” look. Additionally this would allow us to increase the contrast between shorelines and non-shoreline pixels. Possible Further Processes • Before we created this model, we compared three TPIs from different neighborhood focal statistics. We chose 5 x 5. Possibly 10 x 10 was a little better than 5 x 5, however, the results would not significantly different. • 3 x 3 was not significant. It seems that the smoothed areas are too narrow compared to the sizes of shoreline features. Focal Statistics Comparison
- 18. Discussion (2) • Since we focused on the landform metrics rather than the difference of elevation, we did not include the DEM layer in the factor of our model. However, elevation itself has significant importance, in part, due to the lack of topographic variation which results in off-shore bars and shorelines being associated with higher DEM values. • The statistics in Rattle including the DEM as a factor in addition to four factors we used are shown below. • Although every other layer was derived from the DEM, multicollinearity is not a problem for Random Forest. It is likely to improve our model if we use the DEM. The Importance of DEM
- 19. Discussion (3) Tracing the history of the Lake Agassiz is important not only for the development of the Red River valley, but also for the study of past climate change, ancient peoples after the end of the recent ice age. This model is useful to recognize its subtle features. • This model requires quite a high-performance computing environment and a large volume of disk space - not only data drive but also C drive for large-size temporally files. • Available field test is limited. We can visit and look at the spots in interest but cannot dig others’ properties. Limitations • We briefly looked at other machine-learning algorithms in Rattle. Other Machine-learning Algorithms “Tree” and “Neural Net” gave results that were not as robust. “Support Vector Machine” also did not perform as well as Random Forests. “Gradient Boosted Decision Trees” performed similarly to Random Forest and should be explored further. However, I believe Random Forest was suitable for this study since we were able to develop the model relatively easily using MGET tool in the ArcGIS.
- 20. Thank You & Questions? References [1] LiDAR Elevation data for Clay County (2008-2010). Retrieved from The Minnesota Geospatial Commons. https://gisdata.mn.gov/ [2] Zhu, X. (2016). GIS for Environmental Applications: A Practical Approach. Routledge. [3] Marshak, S. (2015). Earth; portrait of a planet, 5th ed. Norton & Company Ltd. [4] Busch, R. M., Tasa, D. (2015). Laboratory Manual in Physical Geology, 10th ed. Pearson. [5] Lepper, K., Buell, A. W., Fisher, T. G., and Lowell, T. V. 2013. A Chronology for Glacial Lake Agassiz along Upham's Namesake Transect. Quaternary Research. v.80, p. 88-98. [6] Teller, J T., Boyd, M., Yang, Z., et al. 2005. Alternative routing of Lake Agassiz overflow during the Younger Dryas: new dates, paleotopography, and a re-evaluation. Quaternary Science Reviews. 24 (2005) p.1890–1905. [7] Liu, X., Fisher, T. G., Lepper, K., Lowell, T. V. 2014. Geochemical characteristics of glacial Lake Agassiz sediments and new ages for the Moorhead Phase at Fargo, North Dakota, USA. Canadian Journal of Earth Sciences 51. pp 850–861. [8] The Geographer Online: 2. Interactions between Oceans and Coastal Places. Retrieved from https://www.thegeographeronline.net/2-interactions-between-oceans-and-coastal-places.html [9] ESRI ArcGIS for Desktop website - Tools - How Focal Statistics works. Retrieved from http://desktop.arcgis.com/en/arcmap/10.3/tools/spatial-analyst-toolbox/how-focal-statistics-works.htm [10] ESRI ArcGIS Blog Website - Understanding curvature rasters. Retrieved from https://www.esri.com/arcgis-blog/products/product/imagery/understanding-curvature-rasters/ Acknowledgements I would like to thank Dr. Karl Leonard and Dr. David Kramar for giving the opportunity to work on this project.