A snake, a planet, and a bear ditching spreadsheets for quick, reproducible report production with python, jupyter, and pandas
•
1 gostou•146 visualizações

Presenter: Andrew Kelly, Cataloging & E-Resources Librarian, Paul Smith's College This poster has two accompanying handouts: https://www.slideshare.net/NASIG/a-snake-a-planet-and-a-bear-ditching-spreadsheets-handout1 and https://www.slideshare.net/NASIG/a-snake-a-planet-and-a-bear-ditching-spreadsheets-handout2slides.
Recomendados

Recomendados
Mais conteúdo relacionado
Mais procurados
Mais procurados (20)
Semelhante a A snake, a planet, and a bear ditching spreadsheets for quick, reproducible report production with python, jupyter, and pandas
Semelhante a A snake, a planet, and a bear ditching spreadsheets for quick, reproducible report production with python, jupyter, and pandas (20)
Mais de NASIG
Mais de NASIG (20)
Último
Último (20)
A snake, a planet, and a bear ditching spreadsheets for quick, reproducible report production with python, jupyter, and pandas
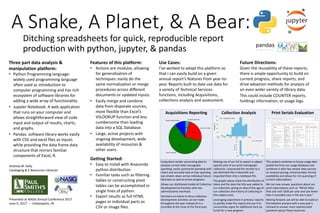
- 1. A Snake, A Planet, & A Bear: Ditching spreadsheets for quick, reproducible report production with python, jupyter, & pandas Features of this platform: • Actions are modular, allowing for generalization of techniques: easily do the same normalization or merge procedures across different documents or updated inputs. • Easily merge and combine data from disparate sources, more flexible than Excel’s VSLOOKUP function and less cumbersome than loading data into a SQL Database. • Large, active projects with ongoing development, wide availability of resources & other users. Three part data analysis & manipulation platform: • Python Programming language: widely used programming language often used as introduction to computer programming and has rich ecosystem of software libraries for adding a wide array of functionality. • Jupyter Notebook: A web application that runs on your computer and allows straightforward view of code input and output of results, charts, and graphs. • Pandas: software library works easily with CSV and excel files as inputs while providing the data frame data structure that mirrors familiar components of Excel, R. Use Cases: I’ve worked to adopt this platform so that I can easily build on a given annual report’s features from year-to- year. Reports built to date use data for a variety of Technical Services functions, including Acquisitions, collections analysis and assessment. Acquisitions Reporting Collection Analysis Print Serials Evaluation Using book vendor accounting data to analysis current total monograph spending, easily summarize spending with charts and annually look at how spending was broken down across individual liaison librarians as well as across programs. Allows our distributed model of Collection Development to function with low administrative overhead. Decisions on where to focus collection development activities can be made throughout the year instead of in a scramble at the close of the fiscal year. Making use of our ILS to export a subject specific part of our print monograph collection, I processed the records to a tab-delimited file in MarcEdit and imported them into a notebook file. The graphs above show the distribution of dates and the date the title was added to our collection, giving an idea of the age of our collection and history of collecting in this subject area. Leveraging experience in previous reports to quickly make this report and use it to successfully argue for additional start-up funds for a new program. This project combines in-house usage data pulled live from our usage database and combines it with two vendor data sources on renewal pricing, historical data, format availability and allows for rich querying of current subscriptions. We can now answer questions about our print subscriptions such as “Which titles that cost over $500 per year and saw fewer than 5 recorded uses in the last 5 year.” Moving forward, we will be able to build on this baseline analysis with a new year’s renewal to answer more sophisticated questions about these resources. Future Directions: Given the reusability of these reports, there is ample opportunity to build on current progress, share reports, and drive adoption methods for analysis of an even wider variety of library data. This could include COUNTER reports, holdings information, or usage logs. Andrew M. Kelly Cataloging & E-Resources Librarian Presented at NASIG Annual Conference 2017 June 9, 2017 -- Indianapolis, IN Getting Started: • Easy to install with Anaconda python distribution. • Familiar tasks such as filtering tables or constructing pivot tables can be accomplished in single lines of python. • Export results as full HTML pages or individual parts as CSV or image files.