SlideShare uma empresa Scribd logo
1 de 7
Bangladesh's RMG Export to World (FY08-09-FY11-12)
Million US$                                                   Woven                                                  Knit                                                            Total
Major EU Countries                     2008-09      2009-10      2010-11        2011-12       2008-09      2009-10      2010-11          2011-12      2008-09          2009-10           2010-11          2011-12
                            Austria          3.01         1.93           6.36        17.50         19.20        13.87            27.75        34.49         22.21            15.80              34.11           51.99
                           Belgium          95.02        87.78         162.93       238.61        157.52       155.79           299.74       320.46        252.54           243.57             462.67          559.07
                           Bulgaria          0.38         0.41           0.21         0.54          0.39         0.47             0.97         0.68             0.77             0.88              1.18             1.23
                          Denmark           23.94        33.51          50.43        86.80        131.23       178.24           256.32       318.72        155.17           211.75             306.75          405.51
                            Finland          6.10         5.47          11.22         7.85         15.52        15.59            28.73        29.25         21.62            21.06              39.95           37.10
                            France         264.11       260.92         405.98       416.72        705.69       692.00           999.71       855.18        969.80           952.92            1405.69         1271.90
                          Germany          801.40       717.31        1108.91      1,358.92     1334.40       1282.77       2022.05        2039.97        2135.80          2000.08            3130.97         3398.89
                            Greece           8.86         8.92           9.42         8.14         29.57        20.66            20.89        21.17         38.43            29.58              30.31           29.31
                               Italy       153.42       161.34         236.76       291.15        368.86       379.04           525.17       571.46        522.28           540.38             761.93          862.62
                            Ireland         41.89        54.14          54.28        63.03         52.16        80.16           105.59       123.92         94.05           134.30             159.87          186.95
                        Netherlands        393.82       388.79         374.13       226.76        513.98       528.57           591.07       325.28        907.80           917.36             965.20          552.04
                           Portugal          6.53         4.87           6.03         6.68         24.51        23.08            32.57        25.57         31.04            27.95              38.61           32.25
                           Romania           3.34         3.03           3.34         4.30          7.89         4.30             4.37         7.62         11.23                7.34              7.71         11.93
                             Spain         141.66       136.98         253.49       410.39        404.23       384.55           595.92       660.73        545.89           521.54             849.41         1071.12
                           Sweden           49.18        54.98          93.91       109.07        125.74       129.89           206.86       203.87        174.92           184.86             300.78          312.94
                               U.K.        502.34       534.29         768.90      1,026.77       720.58       725.74           990.98     1103.30        1222.92          1260.02            1759.87         2130.07
                            Cyprus           0.01         0.27           0.03         0.08          0.63         0.84             1.12         1.11             0.64             1.11              1.16             1.18
                     Czech Republic          1.84         1.24           4.31        37.99         15.66        14.59            23.98        25.77         17.50            15.83              28.29           63.75
                            Estonia          0.00         0.10           0.91         0.74          0.13         0.24             0.62         2.52             0.13             0.34              1.53             3.26
                           Hungary           0.00         0.31           0.29         0.21          0.00         9.98             7.01         2.14             0.00         10.28                 7.31             2.34
                             Latvia          0.07         0.04           0.14         0.29          0.16         0.30             0.34         1.22             0.23             0.33              0.48             1.51
                          Lithuania          0.00         0.07           0.00         0.18          0.05         0.04             0.62         0.98             0.05             0.11              0.62             1.16
                              Malta          0.04         0.00           0.00         0.02          0.66         0.12             0.32         0.45             0.70             0.12              0.32             0.47
                            Poland           5.57         6.03          38.34       112.77         43.49        44.56           123.33       209.96         49.06            50.59             161.67          322.74
                           Slovakia         14.80        15.56          19.01        20.31         26.22        24.29            39.59        36.54         41.02            39.84              58.61           56.85
                           Slovenia          0.37         0.24           0.77         1.04          2.08         2.57             4.08         6.33             2.45             2.81              4.85             7.37
Sub-Total (EU)                           2517.70      2478.54         3610.11      4446.87      4700.55       4712.21       6909.72        6928.69        7218.25          7190.75           10519.84        11375.56
EU % of World                               42.54        41.22          42.81        46.31         73.11        72.68            72.87        73.04         58.46            57.54              58.72           59.59
Growth%                                                  -1.56          45.65        23.18                       0.25            46.63         0.27                              -0.38          46.30               8.13
                               USA       2733.98      2736.44         3506.12      3515.45        959.42       891.61       1119.04        1013.95        3693.40          3628.05            4625.16         4529.40
% of USA                                    46.19        45.51          41.58        36.61         14.92        13.75            11.80        10.69         29.91            29.03              25.82           23.73
Growth%                                                      0.09      28.13        0.27               -7.07         25.51       -9.39                     -1.77       27.48      -2.07
                                 Canada        295.00      311.69     461.75    473.04      292.05    283.86        432.92      401.82     587.05         595.55      894.67     874.85
% of Canada                                      4.98        5.18       5.48        4.93      4.54      4.38            4.57      4.24       4.75           4.77        4.99       4.58
Growth%                                                      5.66      48.15        2.44               -2.80         52.51       -7.18                      1.45       50.23      -2.21
Non-Traditional Markets
                                Australia       13.49       25.15      49.82       94.83     35.80     60.41        143.08      212.72      49.29          85.56      192.90     307.54
                                   Brazil       11.14       11.84      32.60       50.45     28.43     33.33         62.04       77.33      39.57          45.17       94.64     127.78
                                    Chile        1.60        3.65       3.62        5.57      4.81      4.45            9.31     11.36       6.41           8.09       12.93      16.93
                                   China         4.11       10.44      26.60       57.83      5.37      8.51         26.21       46.69       9.49          18.95       52.81     104.52
                                    India        9.52        9.99      25.45       42.20      1.41      2.55         10.49       12.82      10.94          12.53       35.94      55.02
                                   Japan        52.34      120.26     153.68    239.99       21.99     53.06         93.83      163.65      74.33         173.32      247.51     403.65
                              Korea Rep.         4.24       15.36      34.46       61.27      1.19      7.00         12.75       18.75       5.42          22.36       47.21      80.01
                                  Mexico        41.43       25.53      30.34       36.74     40.45     35.88         50.83       61.91      81.88          61.41       81.16      98.65
                                  Russia         4.87        6.67       9.53       27.67     11.29     13.72         42.33       48.82      16.16          20.39       51.86      76.49
                             South Africa       22.92       21.36      28.09       29.31     19.59     14.90         20.35       26.45      42.51          36.26       48.43      55.76
                                  Turkey       108.43      123.76     245.79    231.20      131.11    182.52        272.52      124.73     239.54         306.27      518.32     355.93
                          Other Countries       97.73      112.78     214.93    290.92      175.80    179.28        276.64      336.68     273.54         292.06      491.57     627.60
Sub-Total (Non-Trad.)                          371.83      486.77     854.91   1167.98      477.24    595.61       1020.38     1141.90     849.07        1082.38     1875.28    2309.88
% of Non-Traditional                             6.28        8.09      10.14       12.16      7.42      9.19         10.76       12.04       6.88           8.66       10.47      12.10
%Growth of Non-Traditional                                  30.91      75.63       36.62               24.80         71.32       11.91                     27.48       73.26      23.17
              GRAND TOTAL                     5918.51     6013.44    8432.89   9603.34     6429.26   6483.29       9482.06     9486.35   12347.77       12496.72    17914.95   19089.69
                %Growth                                      1.60      40.23       13.88                0.84         46.25        0.05                      1.21       43.36       6.56
Source: EPB, Compiled by: RDTI Cell, BGMEA


                                                        COMPARATIVE STATEMENT ON EXPORT OF RMG AND TOTAL EXPORT OF BANGLADESH

                                              YEAR              EXPORT OF RMG                 TOTAL EXPORT OF BANGLADESH                            % OF RMG'S TO
                                                                (IN MILLION US$)                    (IN MILLION US$)                                TOTAL EXPORT

                                             1983-84                 31.57                                     811.00                                   3.89

                                             1984-85                 116.2                                     934.43                                   12.44
1985-86   131.48    819.21    16.05

1986-87   298.67    1076.61   27.74

1987-88   433.92    1231.2    35.24

1988-89   471.09    1291.56   36.47

1989-90   624.16    1923.70   32.45

1990-91   866.82    1717.55   50.47

1991-92   1182.57   1993.90   59.31

1992-93   1445.02   2382.89   60.64

1993-94   1555.79   2533.90   61.40

1994-95   2228.35   3472.56   64.17

1995-96   2547.13   3882.42   65.61

1996-97   3001.25   4418.28   67.93

1997-98   3781.94   5161.20   73.28

1998-99   4019.98   5312.86   75.67

1999-00   4349.41   5752.20   75.61

2000-01   4859.83   6467.30   75.14

2001-02   4583.75   5986.09   76.57

2002-03   4912.09   6548.44   75.01
2003-04             5686.09                          7602.99                        74.79

       2004-05             6417.67                          8654.52                        74.15

       2005-06             7900.80                          10526.16                       75.06

       2006-07             9211.23                          12177.86                       75.64

       2007-08             10699.80                         14110.80                       75.83

       2008-09             12347.77                         15565.19                       79.33


VALUE AND QUANTITY OF TOTAL APPAREL EXPORT

YEAR             TOTAL APPAREL EXPORT IN MN.US$                TOTAL APPAREL EXPORT IN MN.DZ

                 WOVEN     KNIT       SWEATER     TOTAL        WOVEN     KNIT      TOTAL

1995-96          1948.81   527.91     70.41       2547.13      48.82     23.18     72.00

1996-97          2237.95   566.7      196.60      3001.25      53.45     27.54     80.99

1997-98          2844.43   641.22     296.29      3781.94      65.59     32.60     98.19
1998-99      2984.96      763.32      271.70     4019.98   64.79      36.66        101.45

1999-2000    3081.19      943.15      325.07     4349.41   66.63      45.27        111.90

2000-2001    3364.32      1018.64     476.87     4859.83   71.48      52.54        124.02

2001-2002    3124.82      941.1       517.83     4583.75   77.05      63.39        140.44

2002-2003    3258.27      1075.45     578.37     4912.09   82.83      69.18        152.01

2003-2004    3538.07      1531.71     616.31     5686.09   90.48      91.60        182.08

2004-2005    3598.20      1926.35     893.12     6417.67   92.26      120.13       212.39

2005-2006    4083.82      2772.97     1044.01    7900.8    108.82     165.02       273.84

2006-2007    4657.63      3305.51     1248.09    9211.23   133.08     199.54       332.62

2007-2008    5167.28      4058.43     1474.09    10699.8   147.43     241.60       389.03

2008-2009    5918.51      4570.64     1858.62    12347.7   169.59     290.92       460.51


      MAIN APPAREL ITEMS EXPORTED FROM BANGLADESH (VALUE IN MN. US$)

      YEAR             SHIRTS       TROUSERS    JACKETS     T-SHIRT       SWEATER

      1995-96          807.66       112.02      171.73      366.36        70.41

      1996-97          759.57       230.98      309.21      391.21        196.60

      1997-98          961.13       333.28      467.19      388.50        296.29
1998-99      1043.11      394.85           393.44          471.88          271.70

1999-2000    1021.17      484.06           439.77          563.58          325.07

2000-2001    1073.59      656.33           573.74          597.42          476.87

2001-2002    871.21       636.61           412.34          546.28          517.83

2002-2003    1019.87      643.66           464.51          642.62          578.37

2003-2004    1116.57      1334.85          364.77          1062.10         616.31

2004-2005    1053.34      1667.72          430.28          1349.71         893.12

2005-2006    1056.69      2165.25          389.52          1781.51         1044.01

2006-2007    943.44       2201.32          1005.06         2208.9          1248.09

2007-2008    915.6        2512.74          1181.52         2765.56         1474.09

2008-2009    1000.16      3007.29          1299.74         3065.86         1858.62


            Major Product Export from Bangladesh (Value in Million US$ )

            Year          Product             Export        %

            2008-09       RMG                 12347.77   79.33

                          Frozen Food         454.53     2.92
Tea                12.29      0.08

Raw Jute           148.17     0.95

Chemical Product   421.58     2.71

Jute Goods         373.18     2.40

Leather            177.32     1.14

Agri Products      122.3      0.79

Others             1508.06    9.69

Total              15565.19   100.00

Mais conteúdo relacionado

Mais procurados

Fundamental Analysis & Analyst Recommendations- SX5E Index (Eurostoxx50) Memb...
Fundamental Analysis & Analyst Recommendations- SX5E Index (Eurostoxx50) Memb...Fundamental Analysis & Analyst Recommendations- SX5E Index (Eurostoxx50) Memb...
Fundamental Analysis & Analyst Recommendations- SX5E Index (Eurostoxx50) Memb...BCV
 
Table 7, mdg 7 ensure environmental sustainability
Table 7, mdg 7  ensure environmental sustainabilityTable 7, mdg 7  ensure environmental sustainability
Table 7, mdg 7 ensure environmental sustainabilityBread for the World
 
Population list of the world
Population list of the worldPopulation list of the world
Population list of the worldSusheel Mittal
 
Limites de control para gráficos xr xs
Limites de control para gráficos xr xsLimites de control para gráficos xr xs
Limites de control para gráficos xr xsMennys-SPC-UTT
 
Financial table
Financial tableFinancial table
Financial tabletumetr1
 
2009 Budget Preview
2009  Budget  Preview2009  Budget  Preview
2009 Budget Previewrprosch
 
Tvm table3
Tvm table3Tvm table3
Tvm table3divyaav
 
DATA MINING WITH WEKA
DATA MINING WITH WEKADATA MINING WITH WEKA
DATA MINING WITH WEKAShubham Gupta
 

Mais procurados (17)

Msrdc case study
Msrdc case studyMsrdc case study
Msrdc case study
 
Fundamental Analysis & Analyst Recommendations- SX5E Index (Eurostoxx50) Memb...
Fundamental Analysis & Analyst Recommendations- SX5E Index (Eurostoxx50) Memb...Fundamental Analysis & Analyst Recommendations- SX5E Index (Eurostoxx50) Memb...
Fundamental Analysis & Analyst Recommendations- SX5E Index (Eurostoxx50) Memb...
 
Table 7, mdg 7 ensure environmental sustainability
Table 7, mdg 7  ensure environmental sustainabilityTable 7, mdg 7  ensure environmental sustainability
Table 7, mdg 7 ensure environmental sustainability
 
Erlang table
Erlang tableErlang table
Erlang table
 
Absorptionratesapril
AbsorptionratesaprilAbsorptionratesapril
Absorptionratesapril
 
Population list of the world
Population list of the worldPopulation list of the world
Population list of the world
 
Oferta hídrica
Oferta hídricaOferta hídrica
Oferta hídrica
 
Limites de control para gráficos xr xs
Limites de control para gráficos xr xsLimites de control para gráficos xr xs
Limites de control para gráficos xr xs
 
30 July 2012, Lot Size & Daily Margins of F&O Scrips
30 July 2012, Lot Size & Daily Margins of F&O Scrips 30 July 2012, Lot Size & Daily Margins of F&O Scrips
30 July 2012, Lot Size & Daily Margins of F&O Scrips
 
Go Ahead for F&O Report 15 March 2013 Mansukh Investment and Trading Solution
Go Ahead for F&O Report 15 March 2013 Mansukh Investment and Trading SolutionGo Ahead for F&O Report 15 March 2013 Mansukh Investment and Trading Solution
Go Ahead for F&O Report 15 March 2013 Mansukh Investment and Trading Solution
 
Go Ahead for F&O Report 06 March 2013 Mansukh Investment and Trading Solution
Go Ahead for F&O Report 06 March 2013 Mansukh Investment and Trading SolutionGo Ahead for F&O Report 06 March 2013 Mansukh Investment and Trading Solution
Go Ahead for F&O Report 06 March 2013 Mansukh Investment and Trading Solution
 
Financial table
Financial tableFinancial table
Financial table
 
2009 Budget Preview
2009  Budget  Preview2009  Budget  Preview
2009 Budget Preview
 
Estratificacion(1) dane
Estratificacion(1) daneEstratificacion(1) dane
Estratificacion(1) dane
 
Tvm table3
Tvm table3Tvm table3
Tvm table3
 
DATA MINING WITH WEKA
DATA MINING WITH WEKADATA MINING WITH WEKA
DATA MINING WITH WEKA
 
Futurevaluetables
FuturevaluetablesFuturevaluetables
Futurevaluetables
 

Semelhante a Data

Semelhante a Data (20)

European mapping project
European mapping projectEuropean mapping project
European mapping project
 
Gsom1
Gsom1Gsom1
Gsom1
 
Pricing Predictions for Diesel/ Nominal
Pricing Predictions for Diesel/ NominalPricing Predictions for Diesel/ Nominal
Pricing Predictions for Diesel/ Nominal
 
FreakonomicsOfScrum spreadsheet
FreakonomicsOfScrum spreadsheetFreakonomicsOfScrum spreadsheet
FreakonomicsOfScrum spreadsheet
 
FreakonomicsOfScrum spreadsheet
FreakonomicsOfScrum spreadsheetFreakonomicsOfScrum spreadsheet
FreakonomicsOfScrum spreadsheet
 
Math ia
Math iaMath ia
Math ia
 
Useful engineering data
Useful engineering dataUseful engineering data
Useful engineering data
 
R qa1203 anx9a
R qa1203 anx9aR qa1203 anx9a
R qa1203 anx9a
 
SPICE MODEL of CR123A_RL=2.2(Ohm) in SPICE PARK
SPICE MODEL of CR123A_RL=2.2(Ohm) in SPICE PARKSPICE MODEL of CR123A_RL=2.2(Ohm) in SPICE PARK
SPICE MODEL of CR123A_RL=2.2(Ohm) in SPICE PARK
 
Book1
Book1Book1
Book1
 
US Department of Commerce Export
US Department of Commerce ExportUS Department of Commerce Export
US Department of Commerce Export
 
Esteban corvalán
Esteban corvalánEsteban corvalán
Esteban corvalán
 
EF - Indice de Libertad Economica 2006
EF - Indice de Libertad Economica 2006EF - Indice de Libertad Economica 2006
EF - Indice de Libertad Economica 2006
 
SPICE MODEL of CR123A_RL=10(Ohm) in SPICE PARK
SPICE MODEL of CR123A_RL=10(Ohm) in SPICE PARKSPICE MODEL of CR123A_RL=10(Ohm) in SPICE PARK
SPICE MODEL of CR123A_RL=10(Ohm) in SPICE PARK
 
SPICE MODEL of CR2_RL=4.7(Ohm) in SPICE PARK
SPICE MODEL of CR2_RL=4.7(Ohm) in SPICE PARKSPICE MODEL of CR2_RL=4.7(Ohm) in SPICE PARK
SPICE MODEL of CR2_RL=4.7(Ohm) in SPICE PARK
 
Sta iluu
Sta iluuSta iluu
Sta iluu
 
Situational Analysis annexure4
Situational Analysis annexure4Situational Analysis annexure4
Situational Analysis annexure4
 
Estoque, custos e margens
Estoque, custos e margensEstoque, custos e margens
Estoque, custos e margens
 
7
77
7
 
7
77
7
 

Último

SOC 101 Demonstration of Learning Presentation
SOC 101 Demonstration of Learning PresentationSOC 101 Demonstration of Learning Presentation
SOC 101 Demonstration of Learning Presentationcamerronhm
 
Application orientated numerical on hev.ppt
Application orientated numerical on hev.pptApplication orientated numerical on hev.ppt
Application orientated numerical on hev.pptRamjanShidvankar
 
Making communications land - Are they received and understood as intended? we...
Making communications land - Are they received and understood as intended? we...Making communications land - Are they received and understood as intended? we...
Making communications land - Are they received and understood as intended? we...Association for Project Management
 
Food safety_Challenges food safety laboratories_.pdf
Food safety_Challenges food safety laboratories_.pdfFood safety_Challenges food safety laboratories_.pdf
Food safety_Challenges food safety laboratories_.pdfSherif Taha
 
Basic Civil Engineering first year Notes- Chapter 4 Building.pptx
Basic Civil Engineering first year Notes- Chapter 4 Building.pptxBasic Civil Engineering first year Notes- Chapter 4 Building.pptx
Basic Civil Engineering first year Notes- Chapter 4 Building.pptxDenish Jangid
 
2024-NATIONAL-LEARNING-CAMP-AND-OTHER.pptx
2024-NATIONAL-LEARNING-CAMP-AND-OTHER.pptx2024-NATIONAL-LEARNING-CAMP-AND-OTHER.pptx
2024-NATIONAL-LEARNING-CAMP-AND-OTHER.pptxMaritesTamaniVerdade
 
General Principles of Intellectual Property: Concepts of Intellectual Proper...
General Principles of Intellectual Property: Concepts of Intellectual  Proper...General Principles of Intellectual Property: Concepts of Intellectual  Proper...
General Principles of Intellectual Property: Concepts of Intellectual Proper...Poonam Aher Patil
 
Explore beautiful and ugly buildings. Mathematics helps us create beautiful d...
Explore beautiful and ugly buildings. Mathematics helps us create beautiful d...Explore beautiful and ugly buildings. Mathematics helps us create beautiful d...
Explore beautiful and ugly buildings. Mathematics helps us create beautiful d...christianmathematics
 
1029-Danh muc Sach Giao Khoa khoi 6.pdf
1029-Danh muc Sach Giao Khoa khoi  6.pdf1029-Danh muc Sach Giao Khoa khoi  6.pdf
1029-Danh muc Sach Giao Khoa khoi 6.pdfQucHHunhnh
 
How to Manage Global Discount in Odoo 17 POS
How to Manage Global Discount in Odoo 17 POSHow to Manage Global Discount in Odoo 17 POS
How to Manage Global Discount in Odoo 17 POSCeline George
 
ICT Role in 21st Century Education & its Challenges.pptx
ICT Role in 21st Century Education & its Challenges.pptxICT Role in 21st Century Education & its Challenges.pptx
ICT Role in 21st Century Education & its Challenges.pptxAreebaZafar22
 
Python Notes for mca i year students osmania university.docx
Python Notes for mca i year students osmania university.docxPython Notes for mca i year students osmania university.docx
Python Notes for mca i year students osmania university.docxRamakrishna Reddy Bijjam
 
TỔNG ÔN TẬP THI VÀO LỚP 10 MÔN TIẾNG ANH NĂM HỌC 2023 - 2024 CÓ ĐÁP ÁN (NGỮ Â...
TỔNG ÔN TẬP THI VÀO LỚP 10 MÔN TIẾNG ANH NĂM HỌC 2023 - 2024 CÓ ĐÁP ÁN (NGỮ Â...TỔNG ÔN TẬP THI VÀO LỚP 10 MÔN TIẾNG ANH NĂM HỌC 2023 - 2024 CÓ ĐÁP ÁN (NGỮ Â...
TỔNG ÔN TẬP THI VÀO LỚP 10 MÔN TIẾNG ANH NĂM HỌC 2023 - 2024 CÓ ĐÁP ÁN (NGỮ Â...Nguyen Thanh Tu Collection
 
Mixin Classes in Odoo 17 How to Extend Models Using Mixin Classes
Mixin Classes in Odoo 17  How to Extend Models Using Mixin ClassesMixin Classes in Odoo 17  How to Extend Models Using Mixin Classes
Mixin Classes in Odoo 17 How to Extend Models Using Mixin ClassesCeline George
 
UGC NET Paper 1 Mathematical Reasoning & Aptitude.pdf
UGC NET Paper 1 Mathematical Reasoning & Aptitude.pdfUGC NET Paper 1 Mathematical Reasoning & Aptitude.pdf
UGC NET Paper 1 Mathematical Reasoning & Aptitude.pdfNirmal Dwivedi
 
Sociology 101 Demonstration of Learning Exhibit
Sociology 101 Demonstration of Learning ExhibitSociology 101 Demonstration of Learning Exhibit
Sociology 101 Demonstration of Learning Exhibitjbellavia9
 
The basics of sentences session 3pptx.pptx
The basics of sentences session 3pptx.pptxThe basics of sentences session 3pptx.pptx
The basics of sentences session 3pptx.pptxheathfieldcps1
 
Russian Escort Service in Delhi 11k Hotel Foreigner Russian Call Girls in Delhi
Russian Escort Service in Delhi 11k Hotel Foreigner Russian Call Girls in DelhiRussian Escort Service in Delhi 11k Hotel Foreigner Russian Call Girls in Delhi
Russian Escort Service in Delhi 11k Hotel Foreigner Russian Call Girls in Delhikauryashika82
 
SKILL OF INTRODUCING THE LESSON MICRO SKILLS.pptx
SKILL OF INTRODUCING THE LESSON MICRO SKILLS.pptxSKILL OF INTRODUCING THE LESSON MICRO SKILLS.pptx
SKILL OF INTRODUCING THE LESSON MICRO SKILLS.pptxAmanpreet Kaur
 

Último (20)

SOC 101 Demonstration of Learning Presentation
SOC 101 Demonstration of Learning PresentationSOC 101 Demonstration of Learning Presentation
SOC 101 Demonstration of Learning Presentation
 
Application orientated numerical on hev.ppt
Application orientated numerical on hev.pptApplication orientated numerical on hev.ppt
Application orientated numerical on hev.ppt
 
Making communications land - Are they received and understood as intended? we...
Making communications land - Are they received and understood as intended? we...Making communications land - Are they received and understood as intended? we...
Making communications land - Are they received and understood as intended? we...
 
Food safety_Challenges food safety laboratories_.pdf
Food safety_Challenges food safety laboratories_.pdfFood safety_Challenges food safety laboratories_.pdf
Food safety_Challenges food safety laboratories_.pdf
 
Basic Civil Engineering first year Notes- Chapter 4 Building.pptx
Basic Civil Engineering first year Notes- Chapter 4 Building.pptxBasic Civil Engineering first year Notes- Chapter 4 Building.pptx
Basic Civil Engineering first year Notes- Chapter 4 Building.pptx
 
2024-NATIONAL-LEARNING-CAMP-AND-OTHER.pptx
2024-NATIONAL-LEARNING-CAMP-AND-OTHER.pptx2024-NATIONAL-LEARNING-CAMP-AND-OTHER.pptx
2024-NATIONAL-LEARNING-CAMP-AND-OTHER.pptx
 
General Principles of Intellectual Property: Concepts of Intellectual Proper...
General Principles of Intellectual Property: Concepts of Intellectual  Proper...General Principles of Intellectual Property: Concepts of Intellectual  Proper...
General Principles of Intellectual Property: Concepts of Intellectual Proper...
 
Explore beautiful and ugly buildings. Mathematics helps us create beautiful d...
Explore beautiful and ugly buildings. Mathematics helps us create beautiful d...Explore beautiful and ugly buildings. Mathematics helps us create beautiful d...
Explore beautiful and ugly buildings. Mathematics helps us create beautiful d...
 
1029-Danh muc Sach Giao Khoa khoi 6.pdf
1029-Danh muc Sach Giao Khoa khoi  6.pdf1029-Danh muc Sach Giao Khoa khoi  6.pdf
1029-Danh muc Sach Giao Khoa khoi 6.pdf
 
How to Manage Global Discount in Odoo 17 POS
How to Manage Global Discount in Odoo 17 POSHow to Manage Global Discount in Odoo 17 POS
How to Manage Global Discount in Odoo 17 POS
 
ICT Role in 21st Century Education & its Challenges.pptx
ICT Role in 21st Century Education & its Challenges.pptxICT Role in 21st Century Education & its Challenges.pptx
ICT Role in 21st Century Education & its Challenges.pptx
 
Python Notes for mca i year students osmania university.docx
Python Notes for mca i year students osmania university.docxPython Notes for mca i year students osmania university.docx
Python Notes for mca i year students osmania university.docx
 
TỔNG ÔN TẬP THI VÀO LỚP 10 MÔN TIẾNG ANH NĂM HỌC 2023 - 2024 CÓ ĐÁP ÁN (NGỮ Â...
TỔNG ÔN TẬP THI VÀO LỚP 10 MÔN TIẾNG ANH NĂM HỌC 2023 - 2024 CÓ ĐÁP ÁN (NGỮ Â...TỔNG ÔN TẬP THI VÀO LỚP 10 MÔN TIẾNG ANH NĂM HỌC 2023 - 2024 CÓ ĐÁP ÁN (NGỮ Â...
TỔNG ÔN TẬP THI VÀO LỚP 10 MÔN TIẾNG ANH NĂM HỌC 2023 - 2024 CÓ ĐÁP ÁN (NGỮ Â...
 
Mixin Classes in Odoo 17 How to Extend Models Using Mixin Classes
Mixin Classes in Odoo 17  How to Extend Models Using Mixin ClassesMixin Classes in Odoo 17  How to Extend Models Using Mixin Classes
Mixin Classes in Odoo 17 How to Extend Models Using Mixin Classes
 
UGC NET Paper 1 Mathematical Reasoning & Aptitude.pdf
UGC NET Paper 1 Mathematical Reasoning & Aptitude.pdfUGC NET Paper 1 Mathematical Reasoning & Aptitude.pdf
UGC NET Paper 1 Mathematical Reasoning & Aptitude.pdf
 
Asian American Pacific Islander Month DDSD 2024.pptx
Asian American Pacific Islander Month DDSD 2024.pptxAsian American Pacific Islander Month DDSD 2024.pptx
Asian American Pacific Islander Month DDSD 2024.pptx
 
Sociology 101 Demonstration of Learning Exhibit
Sociology 101 Demonstration of Learning ExhibitSociology 101 Demonstration of Learning Exhibit
Sociology 101 Demonstration of Learning Exhibit
 
The basics of sentences session 3pptx.pptx
The basics of sentences session 3pptx.pptxThe basics of sentences session 3pptx.pptx
The basics of sentences session 3pptx.pptx
 
Russian Escort Service in Delhi 11k Hotel Foreigner Russian Call Girls in Delhi
Russian Escort Service in Delhi 11k Hotel Foreigner Russian Call Girls in DelhiRussian Escort Service in Delhi 11k Hotel Foreigner Russian Call Girls in Delhi
Russian Escort Service in Delhi 11k Hotel Foreigner Russian Call Girls in Delhi
 
SKILL OF INTRODUCING THE LESSON MICRO SKILLS.pptx
SKILL OF INTRODUCING THE LESSON MICRO SKILLS.pptxSKILL OF INTRODUCING THE LESSON MICRO SKILLS.pptx
SKILL OF INTRODUCING THE LESSON MICRO SKILLS.pptx
 

Data

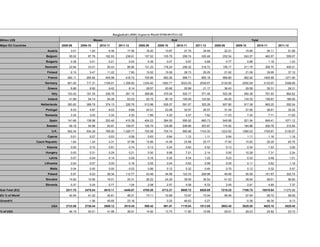
  • 1. Bangladesh's RMG Export to World (FY08-09-FY11-12) Million US$ Woven Knit Total Major EU Countries 2008-09 2009-10 2010-11 2011-12 2008-09 2009-10 2010-11 2011-12 2008-09 2009-10 2010-11 2011-12 Austria 3.01 1.93 6.36 17.50 19.20 13.87 27.75 34.49 22.21 15.80 34.11 51.99 Belgium 95.02 87.78 162.93 238.61 157.52 155.79 299.74 320.46 252.54 243.57 462.67 559.07 Bulgaria 0.38 0.41 0.21 0.54 0.39 0.47 0.97 0.68 0.77 0.88 1.18 1.23 Denmark 23.94 33.51 50.43 86.80 131.23 178.24 256.32 318.72 155.17 211.75 306.75 405.51 Finland 6.10 5.47 11.22 7.85 15.52 15.59 28.73 29.25 21.62 21.06 39.95 37.10 France 264.11 260.92 405.98 416.72 705.69 692.00 999.71 855.18 969.80 952.92 1405.69 1271.90 Germany 801.40 717.31 1108.91 1,358.92 1334.40 1282.77 2022.05 2039.97 2135.80 2000.08 3130.97 3398.89 Greece 8.86 8.92 9.42 8.14 29.57 20.66 20.89 21.17 38.43 29.58 30.31 29.31 Italy 153.42 161.34 236.76 291.15 368.86 379.04 525.17 571.46 522.28 540.38 761.93 862.62 Ireland 41.89 54.14 54.28 63.03 52.16 80.16 105.59 123.92 94.05 134.30 159.87 186.95 Netherlands 393.82 388.79 374.13 226.76 513.98 528.57 591.07 325.28 907.80 917.36 965.20 552.04 Portugal 6.53 4.87 6.03 6.68 24.51 23.08 32.57 25.57 31.04 27.95 38.61 32.25 Romania 3.34 3.03 3.34 4.30 7.89 4.30 4.37 7.62 11.23 7.34 7.71 11.93 Spain 141.66 136.98 253.49 410.39 404.23 384.55 595.92 660.73 545.89 521.54 849.41 1071.12 Sweden 49.18 54.98 93.91 109.07 125.74 129.89 206.86 203.87 174.92 184.86 300.78 312.94 U.K. 502.34 534.29 768.90 1,026.77 720.58 725.74 990.98 1103.30 1222.92 1260.02 1759.87 2130.07 Cyprus 0.01 0.27 0.03 0.08 0.63 0.84 1.12 1.11 0.64 1.11 1.16 1.18 Czech Republic 1.84 1.24 4.31 37.99 15.66 14.59 23.98 25.77 17.50 15.83 28.29 63.75 Estonia 0.00 0.10 0.91 0.74 0.13 0.24 0.62 2.52 0.13 0.34 1.53 3.26 Hungary 0.00 0.31 0.29 0.21 0.00 9.98 7.01 2.14 0.00 10.28 7.31 2.34 Latvia 0.07 0.04 0.14 0.29 0.16 0.30 0.34 1.22 0.23 0.33 0.48 1.51 Lithuania 0.00 0.07 0.00 0.18 0.05 0.04 0.62 0.98 0.05 0.11 0.62 1.16 Malta 0.04 0.00 0.00 0.02 0.66 0.12 0.32 0.45 0.70 0.12 0.32 0.47 Poland 5.57 6.03 38.34 112.77 43.49 44.56 123.33 209.96 49.06 50.59 161.67 322.74 Slovakia 14.80 15.56 19.01 20.31 26.22 24.29 39.59 36.54 41.02 39.84 58.61 56.85 Slovenia 0.37 0.24 0.77 1.04 2.08 2.57 4.08 6.33 2.45 2.81 4.85 7.37 Sub-Total (EU) 2517.70 2478.54 3610.11 4446.87 4700.55 4712.21 6909.72 6928.69 7218.25 7190.75 10519.84 11375.56 EU % of World 42.54 41.22 42.81 46.31 73.11 72.68 72.87 73.04 58.46 57.54 58.72 59.59 Growth% -1.56 45.65 23.18 0.25 46.63 0.27 -0.38 46.30 8.13 USA 2733.98 2736.44 3506.12 3515.45 959.42 891.61 1119.04 1013.95 3693.40 3628.05 4625.16 4529.40 % of USA 46.19 45.51 41.58 36.61 14.92 13.75 11.80 10.69 29.91 29.03 25.82 23.73
  • 2. Growth% 0.09 28.13 0.27 -7.07 25.51 -9.39 -1.77 27.48 -2.07 Canada 295.00 311.69 461.75 473.04 292.05 283.86 432.92 401.82 587.05 595.55 894.67 874.85 % of Canada 4.98 5.18 5.48 4.93 4.54 4.38 4.57 4.24 4.75 4.77 4.99 4.58 Growth% 5.66 48.15 2.44 -2.80 52.51 -7.18 1.45 50.23 -2.21 Non-Traditional Markets Australia 13.49 25.15 49.82 94.83 35.80 60.41 143.08 212.72 49.29 85.56 192.90 307.54 Brazil 11.14 11.84 32.60 50.45 28.43 33.33 62.04 77.33 39.57 45.17 94.64 127.78 Chile 1.60 3.65 3.62 5.57 4.81 4.45 9.31 11.36 6.41 8.09 12.93 16.93 China 4.11 10.44 26.60 57.83 5.37 8.51 26.21 46.69 9.49 18.95 52.81 104.52 India 9.52 9.99 25.45 42.20 1.41 2.55 10.49 12.82 10.94 12.53 35.94 55.02 Japan 52.34 120.26 153.68 239.99 21.99 53.06 93.83 163.65 74.33 173.32 247.51 403.65 Korea Rep. 4.24 15.36 34.46 61.27 1.19 7.00 12.75 18.75 5.42 22.36 47.21 80.01 Mexico 41.43 25.53 30.34 36.74 40.45 35.88 50.83 61.91 81.88 61.41 81.16 98.65 Russia 4.87 6.67 9.53 27.67 11.29 13.72 42.33 48.82 16.16 20.39 51.86 76.49 South Africa 22.92 21.36 28.09 29.31 19.59 14.90 20.35 26.45 42.51 36.26 48.43 55.76 Turkey 108.43 123.76 245.79 231.20 131.11 182.52 272.52 124.73 239.54 306.27 518.32 355.93 Other Countries 97.73 112.78 214.93 290.92 175.80 179.28 276.64 336.68 273.54 292.06 491.57 627.60 Sub-Total (Non-Trad.) 371.83 486.77 854.91 1167.98 477.24 595.61 1020.38 1141.90 849.07 1082.38 1875.28 2309.88 % of Non-Traditional 6.28 8.09 10.14 12.16 7.42 9.19 10.76 12.04 6.88 8.66 10.47 12.10 %Growth of Non-Traditional 30.91 75.63 36.62 24.80 71.32 11.91 27.48 73.26 23.17 GRAND TOTAL 5918.51 6013.44 8432.89 9603.34 6429.26 6483.29 9482.06 9486.35 12347.77 12496.72 17914.95 19089.69 %Growth 1.60 40.23 13.88 0.84 46.25 0.05 1.21 43.36 6.56 Source: EPB, Compiled by: RDTI Cell, BGMEA COMPARATIVE STATEMENT ON EXPORT OF RMG AND TOTAL EXPORT OF BANGLADESH YEAR EXPORT OF RMG TOTAL EXPORT OF BANGLADESH % OF RMG'S TO (IN MILLION US$) (IN MILLION US$) TOTAL EXPORT 1983-84 31.57 811.00 3.89 1984-85 116.2 934.43 12.44
  • 3. 1985-86 131.48 819.21 16.05 1986-87 298.67 1076.61 27.74 1987-88 433.92 1231.2 35.24 1988-89 471.09 1291.56 36.47 1989-90 624.16 1923.70 32.45 1990-91 866.82 1717.55 50.47 1991-92 1182.57 1993.90 59.31 1992-93 1445.02 2382.89 60.64 1993-94 1555.79 2533.90 61.40 1994-95 2228.35 3472.56 64.17 1995-96 2547.13 3882.42 65.61 1996-97 3001.25 4418.28 67.93 1997-98 3781.94 5161.20 73.28 1998-99 4019.98 5312.86 75.67 1999-00 4349.41 5752.20 75.61 2000-01 4859.83 6467.30 75.14 2001-02 4583.75 5986.09 76.57 2002-03 4912.09 6548.44 75.01
  • 4. 2003-04 5686.09 7602.99 74.79 2004-05 6417.67 8654.52 74.15 2005-06 7900.80 10526.16 75.06 2006-07 9211.23 12177.86 75.64 2007-08 10699.80 14110.80 75.83 2008-09 12347.77 15565.19 79.33 VALUE AND QUANTITY OF TOTAL APPAREL EXPORT YEAR TOTAL APPAREL EXPORT IN MN.US$ TOTAL APPAREL EXPORT IN MN.DZ WOVEN KNIT SWEATER TOTAL WOVEN KNIT TOTAL 1995-96 1948.81 527.91 70.41 2547.13 48.82 23.18 72.00 1996-97 2237.95 566.7 196.60 3001.25 53.45 27.54 80.99 1997-98 2844.43 641.22 296.29 3781.94 65.59 32.60 98.19
  • 5. 1998-99 2984.96 763.32 271.70 4019.98 64.79 36.66 101.45 1999-2000 3081.19 943.15 325.07 4349.41 66.63 45.27 111.90 2000-2001 3364.32 1018.64 476.87 4859.83 71.48 52.54 124.02 2001-2002 3124.82 941.1 517.83 4583.75 77.05 63.39 140.44 2002-2003 3258.27 1075.45 578.37 4912.09 82.83 69.18 152.01 2003-2004 3538.07 1531.71 616.31 5686.09 90.48 91.60 182.08 2004-2005 3598.20 1926.35 893.12 6417.67 92.26 120.13 212.39 2005-2006 4083.82 2772.97 1044.01 7900.8 108.82 165.02 273.84 2006-2007 4657.63 3305.51 1248.09 9211.23 133.08 199.54 332.62 2007-2008 5167.28 4058.43 1474.09 10699.8 147.43 241.60 389.03 2008-2009 5918.51 4570.64 1858.62 12347.7 169.59 290.92 460.51 MAIN APPAREL ITEMS EXPORTED FROM BANGLADESH (VALUE IN MN. US$) YEAR SHIRTS TROUSERS JACKETS T-SHIRT SWEATER 1995-96 807.66 112.02 171.73 366.36 70.41 1996-97 759.57 230.98 309.21 391.21 196.60 1997-98 961.13 333.28 467.19 388.50 296.29
  • 6. 1998-99 1043.11 394.85 393.44 471.88 271.70 1999-2000 1021.17 484.06 439.77 563.58 325.07 2000-2001 1073.59 656.33 573.74 597.42 476.87 2001-2002 871.21 636.61 412.34 546.28 517.83 2002-2003 1019.87 643.66 464.51 642.62 578.37 2003-2004 1116.57 1334.85 364.77 1062.10 616.31 2004-2005 1053.34 1667.72 430.28 1349.71 893.12 2005-2006 1056.69 2165.25 389.52 1781.51 1044.01 2006-2007 943.44 2201.32 1005.06 2208.9 1248.09 2007-2008 915.6 2512.74 1181.52 2765.56 1474.09 2008-2009 1000.16 3007.29 1299.74 3065.86 1858.62 Major Product Export from Bangladesh (Value in Million US$ ) Year Product Export % 2008-09 RMG 12347.77 79.33 Frozen Food 454.53 2.92
  • 7. Tea 12.29 0.08 Raw Jute 148.17 0.95 Chemical Product 421.58 2.71 Jute Goods 373.18 2.40 Leather 177.32 1.14 Agri Products 122.3 0.79 Others 1508.06 9.69 Total 15565.19 100.00