SlideShare uma empresa Scribd logo
1 de 17
Baixar para ler offline
Version 2, updated 14 November 2010


                                          GAS MARKET DYNAMICS
                       AND THE FUTURE PRICING OF SPOT LNG


                                                          To be presented at
                                     Plenary – Panel Discussion I: Energy Supply Security


                                           GASEX 2010 CONFERENCE
                                                             Taipei, Taiwan
                                                  Wednesday, 24 November 2010


                                                         Morten Frisch
                                                             Senior Partner
                                                       Morten Frisch Consulting


                                                       Morten Frisch Consulting
                                                           6 Holmwood Close
                                                              East Horsley
                                                            Surrey KT24 6SS
                                                            United Kingdom


                                                        Tel: +44-1483-284248
                                                        Fax: +44-1483-285099
                                                      Email: office@mfcgas.com
                                                       Web: www.mfcgas.com


Morten Frisch Consulting accepts no liability for commercial decisions based on the content of this paper. Although the paper is copyright of
Morten Frisch Consulting, quotes from the paper are permitted, provided full references to the paper and Morten Frisch Consulting are made.
Onward transmission or copying of the paper is allowed in its original form only.
Gas Market Dynamics And The Future Pricing Of Spot LNG, Morten Frisch, GASEX 2010


                                                                     Contents
About the Author .................................................................................................................................... 3
Abbreviations .......................................................................................................................................... 4
Executive Summary................................................................................................................................. 5
Causes of the LNG Surplus....................................................................................................................... 6
       a)      Unconventional Gas a Challenge for LNG .................................................................................. 6
       b)      World-wide Liquefaction Capacity Developments ....................................................................... 7
       c)      Uncontracted LNG Availability .................................................................................................. 8
       d)      Recession Impact on Gas Demand ........................................................................................... 9
LNG Spot and Short-term Trading ...........................................................................................................10
Commercial Model for Spot and Short-term Trading .................................................................................15


                                                                       Tables
Table 1: Projected Incremental LNG Availability ........................................................................................ 7
Table 2: Flexible LNG Sales as Percentage of Total LNG Exports ................................................................ 8
Table 3: Asia LNG Demand Q1-Q3 2010 ..................................................................................................10


                                                                       Figures
Figure 1: Spot and Short-Term LNG Exports ............................................................................................. 8
Figure 2: Interrelations of LNG Markets ...................................................................................................11
Figure 3: Relationship Between Henry Hub and NBP Prices .......................................................................11
Figure 4: Price Relationship between HH, NBP, BAFA and Japan LNG Import Prices....................................13
Figure 5: Current LNG Spot Price Dynamics (schematic) ...........................................................................13
Figure 6: Japanese DES Spot Prices Potential Range ................................................................................14


Keywords: 1. Gas Markets. 2. LNG Markets. 3. LNG Supply. 4. LNG Pricing. 5. Spot LNG. 6. LNG Trading.
7. LNG Price Benchmarks. 8. LNG Short-term Sales. 9. Platform-based LNG Trading. 10. Market-based LNG
Price Discovery. 11. US LNG Imports. 12. European Gas Market. 13. LNG Trade Routes. 14. Shale Gas.
15. Unconventional Gas.


© 2010 Morten Frisch Consulting
                                                                            2
Gas Market Dynamics And The Future Pricing Of Spot LNG, Morten Frisch, GASEX 2010


                                             About the Author

Morten Frisch, Senior Partner, Morten Frisch Consulting (MFC)
Morten Frisch’s career developed in parallel with the gas industry in his home country of Norway. He has
more than 35 years of hands-on experience addressing strategic, commercial and operational issues along
the entire value chain for LNG and pipeline gas. This experience stems from work for the Norwegian
Government, multinational oil companies and as a consultant since 1990.
The first time Morten Frisch led a gas sale negotiation was in 1976, the year his first dealings with LNG
receiving terminals (Everett and Cove Point terminals, USA) also took place. His first LNG marketing work
was conducted in 1980 (for the then Phillips Petroleum’s Bonny LNG project in Nigeria).
In 1977 as part of gas price indexation formulae design work, Morten Frisch was instrumental in the
development and drafting of the Norwegian and Swiss law Price Review and Price Re-opener clauses, now
universally used in long - term gas sales and purchase contracts for the supply of gas to Continental Europe.
In 1993 together with Freshfields solicitors in London he converted this language to English and New York
law. The resulting Price Review and Price Re-opener clauses are now commonly used in long term Atlantic
Basin LNG supply agreements.
Since 1990 Morten Frisch has conducted extensive work related to natural gas in the Middle East, Iran,
Russia, and Central and Western Europe. He has also provided consulting services to clients or projects in
North and West Africa, Japan, Australia and New Zealand. He is familiar with gas developments in North
America and has monitored and analysed unconventional gas developments for more than ten years.
Morten Frisch and MFC’s consulting practice deals with a variety of gas issues, with a high number of
assignments addressing gas pricing issues, commercial optimisation, risk mitigation strategies and methods
for operations in rapidly changing gas market environments. He has been called upon as an expert witness
in arbitrations and court cases dealing with gas contract related issues, particularly in disputes involving price
review/price re-opener clauses.
Morten Frisch has acted as a lead negotiator in gas sales and purchase negotiations for clients. In the past
he has also advised governments on international gas issues. He also advises clients on the organisational
structure and staffing of gas-related projects, and he has acted as a mentor for their novice commercial gas
staff. He is an established professional in the field of gas training.
Since 2007 Morten Frisch has been supporting clients in the development of a more transparent and reliable
way to establish gas market-based pricing of spot and short-term LNG sales.
Morten Frisch is a chartered engineer (Sivil Ingeniør) in his home country of Norway and an economist
(degrees from University of Newcastle upon Tyne, UK and Massachusetts Institute of Technology (MIT),
Mass., USA). He is a member of the Society of Petroleum Engineers (SPE) (since 1975), the International
Association of Energy Economics (IAEE), the British Institute of Energy Economics (BIEE) and a founding
member of the Norwegian Petroleum Society (NPF). He has published a number of articles addressing
strategic and commercial gas issues. He is frequently invited to give presentations at major international gas
and energy conferences and appears regularly as a guest on major TV stations’ business programmes.


© 2010 Morten Frisch Consulting
                                                        3
Gas Market Dynamics And The Future Pricing Of Spot LNG, Morten Frisch, GASEX 2010


                                              Abbreviations

BAFA = Bundesamt für Wirtschaft und Ausfuhrkontrolle is the name for the German Federal Office of
Economics and Export Control. Monthly average unit cost of imported natural gas across all border points is
published by this Federal Office on a monthly basis in €/TJ.
Bcm = Billion cubic meters (106).
CEGH = the Central European Gas Hub at Baumgarten, established by OMV Gas & Power GmbH. OMV and
Gazprom have recently signed a Cooperation Agreement to jointly develop the hub with the aim of it
becoming the largest trading platform in Continental Europe (Press Release of 25 January 2010)
DES = Delivered Ex Ship.
GASPOOL = joint company which operates the market area cooperation of DONG Energy Pipelines GmbH,
Gasunie Deutschland Transport Services GmbH, ONTRAS – VNG Gastransport GmbH and WINGAS
TRANSPORT GmbH & Co. KG.
Henry Hub (HH) = Henry Hub is the pricing point for natural gas futures contracts traded on the New York
Mercantile Exchange (NYMEX). It is also a physical point on the natural gas pipeline system in Erath,
Louisiana.
Mmbtu = Million British Thermal Units
Mtpa = million tonnes per annum.
NBP = the virtual National Balancing Point in the United Kingdom’s network of pipelines forming the national
gas transmission system and the hub in Europe with the largest trade volumes and the greatest trading
depth.
NCG/EGT = a joint company which operates the market area cooperation of Bayernets GmbH, Eni Gas
Transport Deutschland S.p.A., E.ON Gastransport GmbH, GRTgaz Deutschland GmbH, GVS Netz GmbH.
After its most recent expansion, it is now referred to as simply NCG (Net Connect Germany). In 2010 it
became the largest trading hub after TTF in Continental Europe.
PEG-Nord = the virtual trading point in the North of France, created in 2009 when the three zones (PEG
OUEST, PEG EST, PEG NORD) merged into one.
PSV = Punto di Scambio Virtuale, is the name of the Italian Virtual Trading Point established by Snam Rete
Gas.
Sm3 = a cubic meter of pipeline-quality gas at standard conditions with gross calorific value of 39 MJ.
TTF = the Title Transfer Facility, the virtual national balancing point in the Dutch pipeline network and in
2010 the largest trading hub in Continental Europe.
ZEE Hub = Physical gas trading hub at Zeebrugge which was the first major gas trading hub in Continental
Europe.


© 2010 Morten Frisch Consulting
                                                      4
Gas Market Dynamics And The Future Pricing Of Spot LNG, Morten Frisch, GASEX 2010


                                         Executive Summary

A world wide LNG surplus started developing in late 2008. This paper examines the causes of the surplus
and the changes the international LNG industry should adopt to address it.
The advent of unconventional gas and shale gas in particular has changed the North American gas scene
beyond recognition. Neither the USA nor Canada needs to import LNG on a regular basis and both countries
could before 2020 become exporters of domestically produced gas in the form of LNG from new liquefaction
facilities planned for the US Gulf coast and the west coast of Canada. The Lower 48 States of the USA
already re-export LNG by ocean going tankers from two Gulf Coast terminals. North American shale gas
exploration trends and developments are now being transferred to countries in other parts of the world.
A number of new liquefaction plants currently under construction will come on stream in the period to 2015.
Although some major players in the LNG liquefaction industry are suffering from serious feedgas problems
which will limit product availability from a number of existing plants, the industry’s liquefaction capacity is
likely to see more than a 50 per cent addition of operational production capacity before the end of 2014. A
large part of the additional liquefaction capacity which was originally destined for the US and Canadian
markets is now no longer required to supply these markets. The quantities of LNG sold in the flexible spot
and short term markets are predicted to increase substantially over the next 3 to 4 years as a result. They
could be more than double the 2009 observed levels.
Gas demand in US and Canada as well as Europe although improving, is still weak after the recession. Both
market regions are currently more than adequately supplied and as a result experience depressed gas prices.
The Asian LNG market on the other hand has come out of recession much faster and is now showing strong
demand growth and firming spot and short term prices.
International LNG trade routes have been changed as a result of the North American gas supply situation.
The UK National Balancing Point (NBP) has become the dominant trading hub for the pricing of spot and
flexible LNG supplies, since Henry Hub and the North American gas market have price-wise become isolated
from gas markets in Asia, Europe and South America. Russia’s Gazprom which has lost market share in
Europe due to inflexible oil-indexed gas pricing could be the international LNG industry’s wildcard. Should
the company start discounting gas prices towards the lower European hub prices, then this is likely to reduce
Europe’s attractiveness to LNG suppliers. If the current balance between LNG supply and demand is
disturbed in such a way that North American gas prices are no longer isolated from prices in other
international gas markets, then such a development would likely also have a major impact on the
international pricing of LNG.
The Asian market in general and the traditional markets of Japan, South Korea and Taiwan in particular, are
likely to remain the highest priced LNG markets also in the future and should be in a position over the next
five years, and likely beyond, to attract sufficient LNG supplies for their needs.
The current gas market environment has demonstrated how the traditionally used model for commercial LNG
operations can no longer deliver optimum utilisation of available product. This situation is now being
magnified as a result of a high number of new industry participants. Energy industry publishing houses and
major commodity brokers have recognised that the LNG industry needs better market and pricing
transparency as well as the development of screen-based LNG market data systems and trading tools which
should lead to proper market-based pricing of spot LNG and improved optimisation of LNG chain activities.


© 2010 Morten Frisch Consulting
                                                      5
Gas Market Dynamics And The Future Pricing Of Spot LNG, Morten Frisch, GASEX 2010


                                     Causes of the LNG Surplus

    a) Unconventional Gas a Challenge for LNG
Unconventional gas, meaning tight gas, shale gas and coal bed methane, has during the last 10 years played
a large and increasing role in the supply of gas to the Lower 48 States of the USA in particular, but also in
Canada. This development has been accelerated by advances in drilling and production techniques of shale
gas, advances that started becoming significant around 2006. Shale gas production has since this year
developed from being a relatively small source of gas to one that has changed US gas supply in a substantial
way. The “shale gas revolution”, now spreading throughout the North American continent, has led to a
situation where the region already today can be perceived to be self-sufficient in natural gas on an average
annual basis. Domestic production together with underground gas storage should also provide sufficient
capacity to meet peak gas demand during most periods of the year.
Unconventional gas, shale gas in particular, has not yet reached its full potential in North America.
Technological advances in shale production are now made on a continuous basis improving shale gas
economics in a substantial way. For example, after only a year of experimentation with flowing well
pressure modifications, it has been possible to increase expected ultimate recovery (EUR) of gas per well by
some 30 per cent in some of the major shale gas plays.
Moreover, many of the new shale gas producing areas still lack the necessary gas gathering, processing and
transmission infrastructure required for large scale commercial production and transportation of sales gas to
markets. These needs for infrastructure have been made more acute by the fact that many of the shale
plays in addition to dry gas also produce substantial quantities of natural gas liquids (NGLs) in particular and
also light crude oils. New producing areas such as the Marcellus Basin in the North East USA and Eagle Ford
in South West Texas should by 2015 have the necessary infrastructure in place to change gas flow patterns
and, therefore, change gas pricing along the Atlantic seaboard of the USA and Canada. All US and Canadian
LNG import terminals are located on this coast.
The prolific Marcellus Basin producing area in addition to serving the currently high-priced gas markets of
New England, will also supply gas to Canada further north and to markets bordering the Gulf of Mexico.
Marcellus gas will be flowing from the North East USA towards Henry Hub in Louisiana, the world’s largest
gas trading hub, likely resulting in excess gas supplies and in keeping Henry Hub gas prices low. This
development has already lead to soft gas price signals throughout the international gas industry.
With unconventional gas flowing into the domestic market, traditional price signals in the US can no longer
on their own reflect the economic potential of new reserves and their likely production growth. In fact,
despite soft Henry Hub prices currently rendering in many areas gas resources uneconomic, wells keep being
drilled and production from these is brought to the market. The significant margin producers receive from
the extraction of NGL and light oils means the gas coming out of these wells is becoming a by-product of the
liquids production. Moreover, in many cases, producers, bound by the strict terms of expensive acreage
lease agreements, are forced to drill for gas and complete wells for production, irrespective of market price
signals. As a result, a sustainably strong gas supply keeps market prices low, a situation exacerbated by the
absence of a counter-balancing strong demand. With total gas demand weak in the US for some time, small
increases mainly from the power generation fuel market have been unable to reverse the downward trend of
gas market price signals. Based on the latest gas demand forecast from the US Department of Energy’s
Energy Information Administration, US gas demand will remain relatively stable in the short to medium term
and unable to fully absorb all new sales gas production made available to the market.
Allegedly the practice of drilling long horizontal wells and the hydraulic fracturing of these in order to obtain
maximum gas production from shale deposits have resulted in environmental concerns, particularly related to
water management issues including claims of water table contaminations. It is not known that the latter has
been proved.
However, international oil and gas companies with proved “green” credentials, good technology and people
are now becoming increasingly involved in North American shale gas exploration and production operations.
These large and resourceful companies should be able to operate to new and more environmentally friendly
standards regarding drilling and hydraulic fracturing of wells, a situation which should correct perceived
mistakes made in the past by pioneering small independent companies.


© 2010 Morten Frisch Consulting
                                                       6
Gas Market Dynamics And The Future Pricing Of Spot LNG, Morten Frisch, GASEX 2010

The advent of unconventional gas and shale gas in particular has changed gas demand planning in North
America beyond recognition. As an example, as late as 2007 US Authorities projected an LNG import
requirement of some 55 mtpa (80 bcm of pipeline quality gas) to balance its gas markets in 2015 and a
further increase in imported LNG requirements was predicted in 2020. Only a small part if any of this LNG
import volume will now be required in the US and a similar situation is developing in Canada. As a result of
developing gas surpluses both the Lower 48 States of the USA and Canada could become exporters of LNG
produced from domestic feedgas before 2020. The US State of Alaska is currently a net exporter of LNG.
North American shale gas exploration trends and developments are being now transferred to countries like
Australia, China and India. In the future this will also be the case in Indonesia, South Africa, Jordan and
even Russia. These countries will likely all have substantial shale gas production in ten years time. Although
shale gas exploration has also started within European Union countries, the future shale gas production
levels in Western and Central Europe are likely to be more uncertain.

    b) World-wide Liquefaction Capacity Developments
In parallel with unconventional gas developments in North America, substantial new projects for LNG
liquefaction have been developed and are in the process of being brought to the market around the world.
The most recent major projects are located in Qatar, Sakhalin in Russia, Tangguh in Indonesia, Equatorial
Guinea, Yemen, Peru, Western Australia, Angola and Algeria. A large part of the capacity of these LNG
liquefaction projects was meant to supply the US, in particular, and also Canada. Now, the operators of
these projects have to re-direct supply towards Asian and European markets in particular, but also to new
“counter-seasonal” markets in South America and in the Arabian Gulf area.
Table 1 entitled “Projected Incremental LNG Availability” shows a projection of total anticipated new LNG
liquefaction capacity coming on stream between the beginning of 2008 and end 2014.

                                  Table 1: Projected Incremental LNG Availability

LNG expressed as bcm of pipeline quality gas per year         2008   2009   2010    2011   2012    2013    2014

Total anticipated additional LNG capacity               [1]   11.5   33.9   80.0   114.6   134.7   144.4   146.7
Reduction in LNG production due to feedgas problems     [2]   0.0    40.5   37.7   43.5     48.8   52.8     54.4

Anticipated incremental LNG availability                [3]   11.5   -6.7   42.3    71.1   85.9    91.6    92.2

Source: MFC estimates, updated 14 November 2010
[3]=[1]-[2]


A number of traditional LNG suppliers, notably Indonesia, Nigeria, Algeria, Egypt, Oman and Malaysia, to
mention the most important, have over the recent years experienced problems in securing adequate feedgas
supplies for their LNG liquefaction plants. Some of these feedgas problems are the result of competition for
gas supplies between domestic market requirements and export projects. This is an increasing problem in
many LNG producing countries. The inadequate feedgas supply in total represented a reduction in LNG
production of some 28 mtpa (40.5 bcm) in 2009 when compared to nameplate capacity. As shown in Table
1 these reductions have been projected to increase to some 37.5 mtpa (54.4 bcm) in 2014.
Among the existing liquefaction plants Nigeria LNG presents a major uncertainty due to disruptions to
feedgas supplies caused by insurrection in the gas producing area. In 2008 the company produced at only
65% of nameplate capacity, a number which fell to 51% in 2009. The company also experienced substantial
reductions in deliveries during the first half of 2010, a situation that appears to have been corrected for the
last months of the year. In Table 1 it has been assumed that Nigeria in future years will be able to produce
at 85 per cent of nameplate capacity, a normal annual operating level for the industry.
In 2009 the combined effect of delayed start-up of new liquefaction capacity and the reduction in LNG
production due to feedgas problems resulted in a reduction in LNG availability of 4.6 mtpa (6.7 bcm) when
compared to previously anticipated LNG availability based on nameplate capacities. However, overall
worldwide LNG production did increase by 9.6 mtpa (13.9 bcm) or 5.66 per cent to 179.1 mtpa (259.7 bcm)
in 2009 when compared to 2008.


© 2010 Morten Frisch Consulting
                                                        7
Gas Market Dynamics And The Future Pricing Of Spot LNG, Morten Frisch, GASEX 2010

Anticipated incremental LNG availability when using end 2007 capacity as a base and adjusting for reduction
in LNG production due to feedgas problems is forecasted to increase from 29.2 mtpa (42.3 bcm) in 2010 to
63.6 mtpa (92.2 bcm) in 2014.

    c) Uncontracted LNG Availability
Uncontracted LNG availability is product sold under spot and short-term sales arrangements. Spot and
short-term LNG exports or sales are understood to be sales of duration of up to 4 years. Such spot and
short-term sales are also referred to as “flexible” sales in the text below.

                                       Figure 1: Spot and Short-Term LNG Exports

                 35


                 30                Middle East/Africa/Europe
                                   Americas
                 25                Australasia
                                   Others
                 20
          Mtpa


                                   Total

                 15


                 10


                  5


                  0
                  1999      2000       2001      2002    2003    2004   2005    2006    2007   2008   2009

                      Source: GIIGNL

Figure 1 entitled “Spot and Short-term LNG Exports” shows the development of flexible LNG sales since
1999. There has been a marked increase in such sales since 2005. The major source of such sales have
been the Middle East, Africa and Europe, the latter being cargoes diverted from European destinations such
as Spain and France to the USA in 2005/06 and mainly to Asian markets thereafter. Since 2008 flexible sales
from the Americas (Trinidad and Tobago) and Australasia (mainly Sakhalin in Russia and Tangguh in
Indonesia) have increased due to diversion of cargoes originally destined for the USA.
Table 2 entitled “Flexible LNG Sales as Percentage of Total LNG Exports” shows that flexible LNG sales
peaked at 21 per cent of total exports in 2007. The comparable figure for 2009 was some 16 per cent or
29.3 mtpa (42.5 bcm) out of the 179.1 mtpa (259.7 bcm) total LNG production in the year. This figure is
expected to increase to above 20 per cent again in the time period 2010 – 2014 when a number of new
liquefaction projects which were originally meant to supply the US and Canadian markets come on stream.

                         Table 2: Flexible LNG Sales as Percentage of Total LNG Exports

                                                        LNG spot and short-term sales
                                                          Assessment of total exports

                                              2005                              15%
                                              2006                              17%
                                              2007                              21%
                                              2008                              19%
                                              2009                              16%

                                              Source: MFC estimates.


© 2010 Morten Frisch Consulting
                                                                 8
Gas Market Dynamics And The Future Pricing Of Spot LNG, Morten Frisch, GASEX 2010

Arabian Peninsula-based LNG sellers are likely to provide large quantities of product for flexible sales by the
end of 2011, when all plants being constructed at Ras Laffan in Qatar should have reached full production.
In addition to the availability of flexible LNG product, there is another industry development which may act
as a catalyst for LNG producers to sell into the flexible markets. This is the emergence of a high number of
energy and commodity trading houses as active players in the LNG market. These companies appear to be
in a position to offer higher prices for product than traditional buyers. However, new entrants to the LNG
market that do not have equity production or long-term supply contracts which include arrangements for
LNG tanker transportation, face a serious industry bottleneck. Shipping availability is an important hurdle.
About 80 per cent of the current LNG fleet is assigned to production projects. Of the remaining LNG tankers
some 80 per cent are controlled by the international oil and gas companies leaving only some 4 per cent of
the current fleet available for independent charter on a regular basis1. It has been observed that traders and
commodity trading houses have failed to secure cargoes due to the lack of acceptable LNG tankers.
An interesting case of a company which for some time directed all of its uncontracted LNG supply to the LNG
spot and short-term market is Algeria’s Sonatrach. Algeria’s marketing decisions during the period 2006-
2008 were based on the assumption that spot sales were sustainably more attractive than long-term contract
sales. During this period LNG volumes that had previously been delivered to Belgium and Spain under long-
term contracts, were released to the spot market by purposely not renewing the expiring contracts. During
the same period Sonatrach decided to construct the Skikda rebuild and Arzew 3/Gassi Touil plants without
long-term sales agreements. These two plants are expected to bring up to 9.2 mtpa of additional product to
the market when they both have reached full production capacity after a gradual build up during the period
2012 to 2015.
However, Sonatrach’s strategy ultimately proved to be unsustainable as the recession changed the
international LNG markets from the late 2008. Amidst softening prices and the absence of long-term
contracts for their under construction plants Sonatrach senior management started to realise that the
marketing decisions of the past were no longer viable. Such realisation is reflected in a statement of the then
Algerian Energy Minister, Dr. Chakib Khelil at the Gas Exporting Countries Forum (GECF) in April 2010. Dr.
Khelil urged member countries to reduce spot selling in order to boost gas prices2. His statement likely
heralded Algeria’s future selling strategy. In fact, the sharp reduction observed in Algerian LNG sales over
the past six months of 2010 could possibly, at least in part, be a conscious effort to boost price levels by
holding back product from the market.

       d) Recession Impact on Gas Demand
Under a) above we discussed the soft gas demand in the USA. Both Canada and the USA are still suffering
from the effect of the recession with reduced industrial and commercial activity. Persistent high levels of
unemployment are also likely to exert a downward pressure on domestic gas demand in North America.
Key European gas markets such as Germany experienced reduced gas demand due to demand destruction
already in 2007. Starting in the fourth quarter 2008, this development was magnified on a Europe-wide
basis by the onset of the recession. In 2009 the 25 European Union countries that consume natural gas
experienced a fall in consumption of 6.4 per cent compared to the level in 2008. This was the case despite
the fact the winter of 2009/10 was in many countries the coldest in 30 years. Industrial and feedstock
sectors saw in 2009 particularly large reductions in gas demand. Although these energy demand sectors
have experienced some improvements, their 2010 gas demand is expected to remain below historical levels.
In the case of the German gas market utilities are expecting total gas demand in 2010 to return to 2008
levels of some 85 bcm against a total demand of 92.8 bcm in 2006.
In spite of the negative market development in 2009 and part of 2010, LNG producers have managed to
make substantial inroads in European markets with new or expanded LNG terminal facilities such as in the
UK, Belgium and Italy. This has been at the expense of the traditional pipeline suppliers, Russia’s Gazprom
and Algeria’s Sonatrach, which to a large extent have failed to adapt to Continental Europe’s new two-tier


1
    New LNG Trading Players to challenge Old Guard, by Edward McAllister, Reuters, 12 August 2010.
2
    GECF Falls Short of Spot Sales Deal, article in the World Gas Intelligence, 21 April 2010, p.1


© 2010 Morten Frisch Consulting
                                                               9
Gas Market Dynamics And The Future Pricing Of Spot LNG, Morten Frisch, GASEX 2010

price system3. These two suppliers have as a result seen sharp declines in their gas exports to European
Union countries, while Qatar in particular but also Norway have increased their market shares.
In contrast to North American and European gas demand, gas consumption in the main Asian LNG importing
countries has increased very noticeably during the first six months of 2010 compared to the same period in
2009. This development has continued in third quarter 2010 as a result of increased industrial activity and
unusual warm weather in some of the key markets. Table 3 below entitled “Asia LNG Demand Q1-Q3 2010”
presents LNG import developments for Japan, South Korea, Taiwan, China and India. In the case of India
LNG imports have fallen in 2010 due to the start up of new domestic gas production.
Based on current trends in economic development with the shift in activity from North America and Europe
to Asian economies, energy demand including LNG is likely to continue showing healthy growth in Asia with
the possible exception of Japan. This will in turn create additional demand for flexible LNG supplies as well
as new long term LNG supply arrangements.
                                     Table 3: Asia LNG Demand Q1-Q3 2010


                                             2010      2009       Volume
                            ('000 tons)     Jan-Sep   Jan-Sep     change     % change

                            Japan            52,712    48,027        4,685     9.75%
                            South Korea      23,039    17,388        5,651    32.50%
                            Taiwan            8,478     6,695        1,783    26.62%
                            China             6,708     3,959        2,748    69.42%
                            India             6,589     7,285 -        696    -9.55%
                            Total            97,526    83,356      14,171     17.00%

                            Source:Customs data.


                                    LNG Spot and Short-term Trading

The LNG industry is increasingly becoming a global business. The three traditional main LNG consuming
markets have been interlinked through LNG trade as shown in Figure 2 entitled “Interrelations of LNG
Markets”. In this diagram the North American market is represented by Henry Hub, the main price-setting
gas trading hub on the continent. Europe has been split between Spain and Portugal, which together have
historically been the largest LNG importers in Europe, and the other European countries further north, mainly
due to inadequate gas pipeline connections between Spain and France. Of the European gas trading hubs
shown, the UK’s National Balancing Point or NBP is normally the price-setter in North West Europe.


3
  Current European Gas Pricing Problems: Solutions Based on Price-Review and Price-Re-opener Provisions, Morten
Frisch, Centre for Energy, Petroleum and Mineral Law and Policy, Dundee University, Working Research Paper Series
2010/03.


© 2010 Morten Frisch Consulting
                                                       10
Gas Market Dynamics And The Future Pricing Of Spot LNG, Morten Frisch, GASEX 2010

                                            Figure 2: Interrelations of LNG Markets


The price relationship between Henry Hub in the USA and NBP in the UK for the period from July 2009 is
shown in Figure 3 entitled “Relationship between Henry Hub and NBP Prices”. In the past these two price
curves have normally moved in parallel during periods of Atlantic Basin LNG supply surpluses. This
relationship appears to have come to an end at least temporarily starting in the spring of 2010. The likely
explanation for this is that the Atlantic Basin LNG price link has been broken with US imports staying low,
and mainly coming from Trinidad and Tobago under long-term contracts, while the UK has seen rapidly
increasing LNG import volumes. By far the largest supplier of LNG to the UK in 2009 and 2010 has been
Qatar. Qatar with its large LNG exports also to East Asian markets therefore connects the LNG markets of
Asia and Europe.

                                  Figure 3: Relationship Between Henry Hub and NBP Prices
                     8


                     7
                                      HH MA            NBP MA
          $/mmbtu


                     6


                     5


                     4


                     3
                         Jul-09    Sep-09   Nov-09   Jan-10   Mar-10   May-10   Jul-10   Sep-10   Nov-10


© 2010 Morten Frisch Consulting
                                                                11
Gas Market Dynamics And The Future Pricing Of Spot LNG, Morten Frisch, GASEX 2010

The view that the LNG based Henry Hub and NBP price link has been broken, is supported by the fact that
LNG spot prices delivered to North West European and Mediterranean destinations have been priced in
relation to NBP. The same has reportedly been the case for spot sales of LNG into East Asian markets4.
Although Henry Hub is no longer used as a benchmark for LNG sales into European and Asian markets,
Mexican Caribbean coast imports still use Henry Hub-based pricing. It is also understood that product out of
Peru LNG has been priced and sold on the basis of Henry Hub.

Referring back to Figure 3 above an important question for the international gas industry is: How stable is
the current LNG market situation in which the North American market in effect is isolated from gas markets
in Asia, Europe and South America? The market forces controlling this situation are dictated by a) the total
amount of spot or flexible LNG product available in the market in relation to global LNG demand, b) the
availability of receiving terminal capacity in North American markets and c) the availability of shipping to
serve North American demand, should the need re-emerge.

North America has under-utilised LNG receiving capacity due to a large and increasing unconventional gas
production together with a flat gas demand as discussed under section a). The LNG shipping fleet has been
developed to serve the North American gas market and a number of vessels in this fleet are today either idle
or being used partly loaded. Supply-demand dynamics in the global LNG market is the determining factor.
As outlined under section b) above the LNG producing industry will in the period to 2014 be in a position to
supply increasing volumes of flexible or spot LNG to the market, if it so wishes.

When Dr. Khelil requested that GECF member countries should refrain from spot selling of gas in April 2010,
it looked as if his request had fallen on deaf ears. The developments on the part of LNG producers since this
date might indicate that this may not have been the case. The future availability of flexible or spot LNG
could easily change the current relationship between Henry Hub and NBP gas prices and, therefore, the
pricing of LNG on a global basis5.

Figure 4 entitled “Price Relationship between HH, NBP, BAFA (Germany) and Japan LNG Import Prices”
shows the link between Henry Hub, NBP, BAFA representing average German gas import prices and the
average Japanese LNG import price. The Japanese LNG import price, which is the highest of the four prices
shown, is mainly priced off the Japanese Customs Cleared average crude oil price (JCC), although Japanese
prices based on other crudes such as Brent and Indonesian blends also exist. Until the end of 2008 the
German BAFA price reflected mainly the price under long-term oil-indexed gas import contracts. However,
after the emergence of a two-tier gas price system in Continental Europe, which resulted in the import of
increased volumes of hub priced gas, together with subsequent price renegotiations of long-term contracts,
the BAFA reported price has now been increasingly reflecting European hub prices linked to NBP. European
oil-indexed gas prices that have not yet been modified were in August 2010 some US$1.6/mmbtu above the
reported BAFA- average German gas import price for the same month.
In today’s North West European gas market environment it can be assumed that Continental European hub
prices will be at a level between NBP and BAFA reported prices provided that the pipeline systems linking the
UK and Continental European markets are fully operational. LNG landing in the UK would normally have a
DES price of NBP less terminal costs and UK gas transmission systems entry costs. During the third quarter
of 2010 typically this represented a price obtained by applying a discount of some 5 per cent to the NBP
price. This pricing system will under normal operating conditions make the UK DES LNG spot based price the
lowest DES LNG price in North West Europe. During the third quarter 2010 Mediterranean6 DES spot LNG
prices have also been at a premium to NBP.


4
    Heren Global LNG Markets, 17 September 2010
5
 The linkage of prices in the US and UK gas markets was addressed in a paper entitled “Price linkage between US and
UK Gas markets. The role of LNG. Can the Markets be de-linked again?” presented by Bjorn Brochmann of Point Carbon
at the 11th European IAEE conference in Vilnius, 25-28 of August, 2010 and published in the Conference Proceedings at
www.IAEE.org.
6
    By Mediterranean is meant Turkey, Greece, Italy, French Med terminals, Spain and Portugal.


© 2010 Morten Frisch Consulting
                                                            12
Gas Market Dynamics And The Future Pricing Of Spot LNG, Morten Frisch, GASEX 2010


               Figure 4: Price Relationship between HH, NBP, BAFA and Japan LNG Import Prices

               18

               16

               14

               12
     $/mmbtu


               10

                8

                6
                             Henry Hub Month Ahead
                4
                             NBP Month Ahead
                             BAFA (German) Import
                2
                             Japan LNG Import
                0
                    Feb-08   Jun-08     Oct-08       Feb-09   Jun-09   Oct-09   Feb-10   Jun-10   Oct-10

This relationship is demonstrated in Figure 5 entitled “Current LNG Spot Price Dynamics (schematic)”. East
Asian DES spot LNG prices are today reportedly referenced to NBP. This is because the Japanese mainly
JCC-benchmarked price is at a level allowing shipping differentials to be absorbed by Japanese buyers. The
same applies to spot LNG cargoes delivered on a DES basis to South Korea and Taiwanese buyers. China
and India have in the past also purchased cargoes based on such pricing.

                                Figure 5: Current LNG Spot Price Dynamics (schematic)


In the LNG Spot and Short-term Trading section it was discussed that North American gas markets are today
effectively isolated, price-wise, from gas markets in other parts of the world. Should available LNG product
increase to such a level that North American gas markets stop being isolated from gas markets in Asia,


© 2010 Morten Frisch Consulting
                                                                13
Gas Market Dynamics And The Future Pricing Of Spot LNG, Morten Frisch, GASEX 2010

Europe and South America, then such an LNG supply situation would likely lead to rapid gas price
developments in most international markets. The answer to how the available LNG product would increase
to such a critical level could very well lie in Gazprom’s future marketing strategy for Europe and its desire to
regain market share for its pipeline gas supplies.

Both Russia and Algeria, as mentioned under section d) above, have seen their sales of gas to European
Union countries decline as a result of inflexible pricing in an oversupplied gas market. Both countries have
lost market share in Europe. Russia in 2009 exported 142 bcm of pipeline gas to European countries and
had planned to increase such exports to 160 bcm in 2010. However, based on the latest gas export data
coming out of Moscow, the country will most likely export only some 140 bcm in 20107, even a decrease
compared to 2009. Reportedly, a number of Gazprom’s main gas customers claim they are still facing
serious difficulties with the pricing of Russian gas supplies and have demanded additional unscheduled price
renegotiations. Should Gazprom start discounting gas sales prices under long-term gas sales contracts, it is
thought this could have serious implications first of all for European LNG imports. As stated above, Russia in
the short term would like to export an additional 20 bcm of pipeline gas, equivalent to some 13.8 mtpa of
LNG product.

If Russian prices were to be lowered sufficiently to reflect Continental European hub prices, then Russian
supplies would increase sharply and potentially achieve the above pipeline gas export ambition. This would
have an immediate impact on LNG import levels in Italy, France and Turkey with secondary effects on
Belgium, the Netherlands, Germany and Austria. This would in turn result in increased imports of pipeline
gas to the UK and hence impact on NBP pricing. Such a development would be reflected in the value of
LNG imported into the UK. The value of NBP pricing used as a benchmark for East Asian spot DES sales
would be lowered under this scenario at the same time as LNG volumes directed towards East Asian markets
would increase and lower the price range for spot LNG deliveries to this region. In the current European gas
market environment Gazprom could, therefore, well be the wild card for the pricing of spot LNG sales first of
all to Europe and then to East Asian markets.

                              Figure 6: Japanese DES Spot Prices Potential Range

          18

                                                          Japan LNG Import Price
          16                                              NBP MA Spot
                                                          Japan LNG Import Forward
                                                          NBP Forward Curve
          14                                              NBP + 1.50 $/mmbtu
                                                          NBP + 2.00 $/mmbtu

          12
$/mmbtu


          10


           8


           6


           4


           2


           0
            Feb-08 May-08 Aug-08 Nov-08 Feb-09 May-09 Aug-09 Nov-09 Feb-10 May-10 Aug-10 Nov-10 Feb-11 May-11


7
    Netherlands, Denmark ask for more gas from Gazprom, article in RIA Novosti, 29 October 2010


© 2010 Morten Frisch Consulting
                                                           14
Gas Market Dynamics And The Future Pricing Of Spot LNG, Morten Frisch, GASEX 2010

Furthermore, under such a scenario where a) Europe becomes less attractive to LNG producers, b) additional
volume of LNG is directed to Asian Buyers and c) new seasonal markets in South America and the Arabian
Gulf area are unable to absorb all the volumes otherwise destined for Europe, there seems to be only one
other market for the surplus LNG product, should this continue to be produced: All surplus LNG, which could
not be absorbed in Asian, European and South American markets, would then find its way to the US and
Canada, with North America becoming the market of last resort. If this should happen, it would lead to a
downward pressure on prices for spot LNG in international markets potentially forcing LNG spot prices to
spiral down to levels again set by Henry Hub as benchmark. Russia could well hold the large international
gas price wild card.

Of course, on the other hand, should there be a combination of increased Asian LNG demand and a
persistent reduced availability of installed LNG liquefaction capacity, there could in the short to medium term
be a shortage of LNG in Asian markets. Under this scenario it appears that the traditional Japanese, South
Korean and Taiwanese buyers can outbid their European counterparts without much difficulty. Based on
market information these buyers in September appeared to be prepared to pay at least US$2.5/mmbtu more
than the highest long-term contract prices currently serving the German market, a contract price level
European gas importers today have great difficulties in passing on to their end consumers. In tight LNG
supply situations Japanese buyers have in the past been observed to pay DES prices well in excess of
US$20/mmbtu.

Figure 7 entitled “Japanese DES Spot Prices Potential Range” presents a comparison of the NBP month
ahead price with the Japanese average reported import price from Qatar for corresponding delivery months.
Based on forward curves for crude oils, the forward curve of the average Qatari price has been estimated.
This estimate is shown together with the forward relationship between the NBP month ahead price curve and
Japanese DES LNG spot price ranges and such price ranges relationship with the NBP curve, all observed
during the early part of November 2010. Figure 6 confirms the strength of Japan’s LNG purchasing power in
relation to that of European gas buyers both historically and during the first half of 2011.


                    Commercial Model for Spot and Short-term Trading

The 29.3 mtpa (42.5 bcm) of spot and short-term LNG trade recorded in 2009 was at a substantially lower
level than what the industry had expected. Section b) above discussed anticipated incremental LNG
availability, using end 2007 capacity as a base, which was projected to be 29.2 mtpa (42.3 bcm) in 2010
increasing to 63.6 mtpa (92.2 bcm) in 2014. A large proportion, probably more than half, of these
quantities, if they are produced, are likely to be sold in the spot and short term markets, increasing flexible
sales from the current level of some 30 mtpa (43.5 bcm) to in excess of 60 mtpa (87 bcm) by the end of
2014. This quantity of LNG represents a gas demand which exceeds the total demand of most national
markets. Furthermore, it will be sourced from an increasing number of liquefaction trains and producers
around the world at the same time as the number of LNG regasification terminals, both permanent
installations and ship-based units, is growing rapidly.
In addition to an increasing number of market players with access to LNG production and receiving
infrastructure, there are in November 2010 at least ten energy traders and commodity houses actively
participating in the commercial LNG market8. With increased availability of flexible LNG quantities it can be
assumed that the number of independent LNG traders in the near term will increase further. Even some of
the very conservative Japanese Utilities are now moving into LNG trading in order to optimise their fuel
supply portfolios.
The industry which supplies energy trading activities and energy market operators with data has understood
the increasing need for transparency and improved market data. A number of industry newsletters are now
publishing indicative DES spot prices for major LNG market areas such as; South East Asia normally
represented by Japan; North West Europe represented by the UK; and the Mediterranean represented by
Spain.


8
    Factbox – New Trading Players in the LNG Market, Reuters, 10 August 2010


© 2010 Morten Frisch Consulting
                                                          15
Gas Market Dynamics And The Future Pricing Of Spot LNG, Morten Frisch, GASEX 2010

The maturing of the LNG spot market is also evident by the increasing acceptance of LNG brokers in cargo
transactions. Tullett Prebon, an inter-dealer brokering house was the first to launch an LNG brokering desk
at the end of 2007, and is now operating from London and Singapore, signalling business is growing. UK
commodity house, Spectron has since followed suit. Tullett Prebon LNG brokered its first cargo within a year
of being set up and has since been involved in over 10 LNG cargo deals including options and deals for
regasified LNG.
The company launched in early 2010 the first online screen for advertising LNG cargoes and buying interest.
They state that this LNG screen-based service has been designed for fast communication of spot trade
interests among their clients and to meet a growing need for greater price transparency. Advocating market
transparency and to help its clients get the best possible understanding of LNG trade movements, Tullett
Prebon LNG has also launched vessel tracking data services, both on its own and in collaboration with Lloyd’s
List Intelligence.
The amount of detail and the accuracy of the Tullett Prebon screen-based LNG service are unverified,
however it is understood that over 100 market participants now have access to these services.
The Spectron Group in its turn launched in September 2010 a screen-based LNG Indices service used to
record indicative price levels for spot LNG cargoes to be delivered to East Asia, Mediterranean and North
West Europe in 30 and 60 days from the data of the entry date. The recorded LNG price data should,
therefore, correspond to the front month (M+1) and the front second month (M+2) in the forward gas
market.
The Spectron LNG Indices service, just like the publishing houses now also providing indicative LNG spot
prices, is based on assessments and reported data that has not necessarily been confirmed by trades.
It is hoped that these latest LNG market activities will develop into an Over-The-Counter physical market
(OTC market) for LNG and that such a move will ultimately result in deals for string cargoes being recorded
and a physical forward price curve starting to develop.
One thing can be certain of these analyses and screen-based developments: The traditionally used
commercial model for LNG is no longer adequate for an optimum operation of the LNG industry. Electronic
trading platforms have long been used to set up commodity exchanges for flexible products such as crude
oil, oil products and coal. Financial products developed from the electronic trading of crude oil and oil
products are today frequently used by LNG buyers and sellers to hedge their market positions. The LNG
industry is as a result becoming increasingly familiar with electronic trading operations and the benefits they
can provide. Thus while a credible LNG Index and swap market has yet to establish itself, this would be a
natural evolution of the market.
The development of electronic market tools for LNG would be very welcome to an increasing number of
buyers and sellers of LNG on an international scale. It can be expected that traders in addition to brokers
will take the lead in developing such tools as the LNG spot and short term market becomes more liquid in
the period to 2015. It is observed that the latest market developments already have increased LNG traders’
appetite for physical risk. In addition to sourcing LNG and trading cargoes of product on board LNG tankers
they are also entering into spot and long term LNG tanker charters and contracts for firm capacity at LNG
receiving and regasification terminals. Traders are today increasingly operating along the entire LNG chain:
hence the need for more sophisticated tools to control and minimise risk.
The development and use of transparent and reliable online trading services will lead to proper market-based
price discovery for spot or flexible LNG, meaning the discovery of an optimum price for LNG in the various
geographic regions in which the product is used on a regular basis. This price will be the direct result of
market trading and not based on the cost of fuel alternatives which are used as price benchmarks. It will be
primarily dependent upon the demand and supply forces of the underlying fuel with the addition of a
shipping differential and any other destination-specific costs. This price will be an accurate reflection of a
single market’s activity and/or the interrelations of activities in systems of markets, as demonstrated by the
currently observed link between NBP gas prices and the DES price for spot LNG in East Asia.
Price discovery tools will have positive consequences not only for buyers and sellers in the LNG industry but
also for participants in LNG - dependent industries such as shipping. By monitoring LNG tanker traffic
through the Suez Canal during the month of July 2010, it was observed that a total of 36 laden LNG carriers
made the voyage through the Canal; 32 sailed from East to West while 4 travelled from West to East. Most
of the west-bound cargoes came from Qatar while it is believed that up to 3 of 4 laden eastward transits


© 2010 Morten Frisch Consulting
                                                      16
Gas Market Dynamics And The Future Pricing Of Spot LNG, Morten Frisch, GASEX 2010

may have been delivered to Kuwait and, therefore, sailed past Ras Laffan where the Qatari tankers sailing in
the opposite direction had been loaded9. A market-based price discovery process for spot LNG will surely
lead over time to a reduction of all such non-optimal shipping flows and shipping routes. One thing that
could potentially hamper this development is the fact the LNG shipping fleet does not have the same
flexibility as the ocean going fleets for crude oil, petroleum products and dry bulk commodities.
It can not be disputed that market based pricing and price discovery will lead to the optimisation of
commercial operations and portfolio flows of both LNG suppliers and consumers. On a trading level, if
applied to LNG, market based pricing and price discovery would allow for direct, non-benchmark based use
of all pricing and hedging possibilities available to traders of other commodities in today’s increasingly
sophisticated markets.
Looking at history, both gas markets in the USA and UK were modernised and saw the introduction of
transparent gas trading systems based on which financial products could be developed, as a result of gas
oversupply caused by structural market changes. The combination of the recession, the large increase in
LNG supply and further regulatory changes are now driving a similar development in Continental Europe.
Only time will tell to what extent the influx of LNG, which is forecast to become available before 2015
without long-term contracts, will cause a similar development in the international LNG industry.


Morten Frisch Consulting accepts no liability for commercial decisions based on the content of this paper. Although the paper is
copyright of Morten Frisch Consulting, quotes from the paper are permitted, provided full references to the paper and Morten Frisch
Consulting are made. Onward transmission or copying of the paper is allowed in its original form only.


9
    Suez Canal LNG Traffic Surges in July, LNG World News, 23 August 2010


© 2010 Morten Frisch Consulting
                                                                17

Mais conteúdo relacionado

Semelhante a Morten Frisch Gasex 2010 Paper 14 November 2010

Curriculum Vitae
Curriculum VitaeCurriculum Vitae
Curriculum Vitae274816
 
2016 FPSO Europe Congress Brochure
2016 FPSO Europe Congress Brochure2016 FPSO Europe Congress Brochure
2016 FPSO Europe Congress BrochureAries Valkin Calonzo
 
Conteúdo local na Noruega e no Brasil
Conteúdo local na Noruega e no BrasilConteúdo local na Noruega e no Brasil
Conteúdo local na Noruega e no BrasilLuiz Carlos Azenha
 
Letter from 6 European Oil Companies to UN on Climate Change
Letter from 6 European Oil Companies to UN on Climate ChangeLetter from 6 European Oil Companies to UN on Climate Change
Letter from 6 European Oil Companies to UN on Climate ChangeMarcellus Drilling News
 
3311 Council FAC - Trade - Main Results
3311 Council FAC - Trade - Main Results3311 Council FAC - Trade - Main Results
3311 Council FAC - Trade - Main ResultsNotis Mitarachi
 
IGU Gas Price Report _2014
IGU Gas Price Report _2014IGU Gas Price Report _2014
IGU Gas Price Report _2014Anochi.com.
 
Rules Of Trade form World Energy Council
Rules Of Trade form World Energy CouncilRules Of Trade form World Energy Council
Rules Of Trade form World Energy CouncilGlenn Klith Andersen
 
Q1 2017-european-chemicals-update
Q1 2017-european-chemicals-updateQ1 2017-european-chemicals-update
Q1 2017-european-chemicals-updateDuff & Phelps
 
PetroSync - LNG & Gas Sales Contracts-Negotiation and Pricing Review
PetroSync - LNG & Gas Sales Contracts-Negotiation and Pricing ReviewPetroSync - LNG & Gas Sales Contracts-Negotiation and Pricing Review
PetroSync - LNG & Gas Sales Contracts-Negotiation and Pricing ReviewPetroSync
 
M&A - 2016 annual European dealbook
M&A - 2016 annual European dealbookM&A - 2016 annual European dealbook
M&A - 2016 annual European dealbookGrant Thornton
 
Bruursema, Astrid (2016) Defining the FM market, Advisory Report
Bruursema, Astrid (2016) Defining the FM market, Advisory ReportBruursema, Astrid (2016) Defining the FM market, Advisory Report
Bruursema, Astrid (2016) Defining the FM market, Advisory ReportAstrid Bruursema
 
Master Thesis - Reviving the European Union’s Emissions Trading System, Struc...
Master Thesis - Reviving the European Union’s Emissions Trading System, Struc...Master Thesis - Reviving the European Union’s Emissions Trading System, Struc...
Master Thesis - Reviving the European Union’s Emissions Trading System, Struc...Miles Knight
 
Miles Knight - Master Thesis - Reviving the European Union’s Emissions Tradin...
Miles Knight - Master Thesis - Reviving the European Union’s Emissions Tradin...Miles Knight - Master Thesis - Reviving the European Union’s Emissions Tradin...
Miles Knight - Master Thesis - Reviving the European Union’s Emissions Tradin...Miles Knight
 

Semelhante a Morten Frisch Gasex 2010 Paper 14 November 2010 (20)

Curriculum Vitae
Curriculum VitaeCurriculum Vitae
Curriculum Vitae
 
2016 FPSO Europe Congress Brochure
2016 FPSO Europe Congress Brochure2016 FPSO Europe Congress Brochure
2016 FPSO Europe Congress Brochure
 
Upei
UpeiUpei
Upei
 
Conteúdo local na Noruega e no Brasil
Conteúdo local na Noruega e no BrasilConteúdo local na Noruega e no Brasil
Conteúdo local na Noruega e no Brasil
 
Letter from 6 European Oil Companies to UN on Climate Change
Letter from 6 European Oil Companies to UN on Climate ChangeLetter from 6 European Oil Companies to UN on Climate Change
Letter from 6 European Oil Companies to UN on Climate Change
 
3311 Council FAC - Trade - Main Results
3311 Council FAC - Trade - Main Results3311 Council FAC - Trade - Main Results
3311 Council FAC - Trade - Main Results
 
FPSO RT-PDFW4
FPSO RT-PDFW4FPSO RT-PDFW4
FPSO RT-PDFW4
 
IGU Gas Price Report _2014
IGU Gas Price Report _2014IGU Gas Price Report _2014
IGU Gas Price Report _2014
 
Rules Of Trade form World Energy Council
Rules Of Trade form World Energy CouncilRules Of Trade form World Energy Council
Rules Of Trade form World Energy Council
 
Q1 2017-european-chemicals-update
Q1 2017-european-chemicals-updateQ1 2017-european-chemicals-update
Q1 2017-european-chemicals-update
 
PetroSync - LNG & Gas Sales Contracts-Negotiation and Pricing Review
PetroSync - LNG & Gas Sales Contracts-Negotiation and Pricing ReviewPetroSync - LNG & Gas Sales Contracts-Negotiation and Pricing Review
PetroSync - LNG & Gas Sales Contracts-Negotiation and Pricing Review
 
Eurogas
EurogasEurogas
Eurogas
 
M&A - 2016 annual European dealbook
M&A - 2016 annual European dealbookM&A - 2016 annual European dealbook
M&A - 2016 annual European dealbook
 
Bruursema, Astrid (2016) Defining the FM market, Advisory Report
Bruursema, Astrid (2016) Defining the FM market, Advisory ReportBruursema, Astrid (2016) Defining the FM market, Advisory Report
Bruursema, Astrid (2016) Defining the FM market, Advisory Report
 
CV Jonathan Grice
CV Jonathan GriceCV Jonathan Grice
CV Jonathan Grice
 
Master Thesis - Reviving the European Union’s Emissions Trading System, Struc...
Master Thesis - Reviving the European Union’s Emissions Trading System, Struc...Master Thesis - Reviving the European Union’s Emissions Trading System, Struc...
Master Thesis - Reviving the European Union’s Emissions Trading System, Struc...
 
Miles Knight - Master Thesis - Reviving the European Union’s Emissions Tradin...
Miles Knight - Master Thesis - Reviving the European Union’s Emissions Tradin...Miles Knight - Master Thesis - Reviving the European Union’s Emissions Tradin...
Miles Knight - Master Thesis - Reviving the European Union’s Emissions Tradin...
 
Netherlands
NetherlandsNetherlands
Netherlands
 
Dr Modak RESUME' 2
Dr Modak RESUME' 2Dr Modak RESUME' 2
Dr Modak RESUME' 2
 
OGJ Norway_06Feb_3
OGJ Norway_06Feb_3OGJ Norway_06Feb_3
OGJ Norway_06Feb_3
 

Último

APRIL2024_UKRAINE_xml_0000000000000 .pdf
APRIL2024_UKRAINE_xml_0000000000000 .pdfAPRIL2024_UKRAINE_xml_0000000000000 .pdf
APRIL2024_UKRAINE_xml_0000000000000 .pdfRbc Rbcua
 
Organizational Structure Running A Successful Business
Organizational Structure Running A Successful BusinessOrganizational Structure Running A Successful Business
Organizational Structure Running A Successful BusinessSeta Wicaksana
 
Future Of Sample Report 2024 | Redacted Version
Future Of Sample Report 2024 | Redacted VersionFuture Of Sample Report 2024 | Redacted Version
Future Of Sample Report 2024 | Redacted VersionMintel Group
 
2024 Numerator Consumer Study of Cannabis Usage
2024 Numerator Consumer Study of Cannabis Usage2024 Numerator Consumer Study of Cannabis Usage
2024 Numerator Consumer Study of Cannabis UsageNeil Kimberley
 
Digital Transformation in the PLM domain - distrib.pdf
Digital Transformation in the PLM domain - distrib.pdfDigital Transformation in the PLM domain - distrib.pdf
Digital Transformation in the PLM domain - distrib.pdfJos Voskuil
 
BEST Call Girls In Old Faridabad ✨ 9773824855 ✨ Escorts Service In Delhi Ncr,
BEST Call Girls In Old Faridabad ✨ 9773824855 ✨ Escorts Service In Delhi Ncr,BEST Call Girls In Old Faridabad ✨ 9773824855 ✨ Escorts Service In Delhi Ncr,
BEST Call Girls In Old Faridabad ✨ 9773824855 ✨ Escorts Service In Delhi Ncr,noida100girls
 
Islamabad Escorts | Call 03070433345 | Escort Service in Islamabad
Islamabad Escorts | Call 03070433345 | Escort Service in IslamabadIslamabad Escorts | Call 03070433345 | Escort Service in Islamabad
Islamabad Escorts | Call 03070433345 | Escort Service in IslamabadAyesha Khan
 
Cybersecurity Awareness Training Presentation v2024.03
Cybersecurity Awareness Training Presentation v2024.03Cybersecurity Awareness Training Presentation v2024.03
Cybersecurity Awareness Training Presentation v2024.03DallasHaselhorst
 
International Business Environments and Operations 16th Global Edition test b...
International Business Environments and Operations 16th Global Edition test b...International Business Environments and Operations 16th Global Edition test b...
International Business Environments and Operations 16th Global Edition test b...ssuserf63bd7
 
Global Scenario On Sustainable and Resilient Coconut Industry by Dr. Jelfina...
Global Scenario On Sustainable  and Resilient Coconut Industry by Dr. Jelfina...Global Scenario On Sustainable  and Resilient Coconut Industry by Dr. Jelfina...
Global Scenario On Sustainable and Resilient Coconut Industry by Dr. Jelfina...ictsugar
 
8447779800, Low rate Call girls in Uttam Nagar Delhi NCR
8447779800, Low rate Call girls in Uttam Nagar Delhi NCR8447779800, Low rate Call girls in Uttam Nagar Delhi NCR
8447779800, Low rate Call girls in Uttam Nagar Delhi NCRashishs7044
 
Call US-88OO1O2216 Call Girls In Mahipalpur Female Escort Service
Call US-88OO1O2216 Call Girls In Mahipalpur Female Escort ServiceCall US-88OO1O2216 Call Girls In Mahipalpur Female Escort Service
Call US-88OO1O2216 Call Girls In Mahipalpur Female Escort Servicecallgirls2057
 
NewBase 19 April 2024 Energy News issue - 1717 by Khaled Al Awadi.pdf
NewBase  19 April  2024  Energy News issue - 1717 by Khaled Al Awadi.pdfNewBase  19 April  2024  Energy News issue - 1717 by Khaled Al Awadi.pdf
NewBase 19 April 2024 Energy News issue - 1717 by Khaled Al Awadi.pdfKhaled Al Awadi
 
Call Girls In Sikandarpur Gurgaon ❤️8860477959_Russian 100% Genuine Escorts I...
Call Girls In Sikandarpur Gurgaon ❤️8860477959_Russian 100% Genuine Escorts I...Call Girls In Sikandarpur Gurgaon ❤️8860477959_Russian 100% Genuine Escorts I...
Call Girls In Sikandarpur Gurgaon ❤️8860477959_Russian 100% Genuine Escorts I...lizamodels9
 
8447779800, Low rate Call girls in Tughlakabad Delhi NCR
8447779800, Low rate Call girls in Tughlakabad Delhi NCR8447779800, Low rate Call girls in Tughlakabad Delhi NCR
8447779800, Low rate Call girls in Tughlakabad Delhi NCRashishs7044
 
8447779800, Low rate Call girls in New Ashok Nagar Delhi NCR
8447779800, Low rate Call girls in New Ashok Nagar Delhi NCR8447779800, Low rate Call girls in New Ashok Nagar Delhi NCR
8447779800, Low rate Call girls in New Ashok Nagar Delhi NCRashishs7044
 
BEST Call Girls In Greater Noida ✨ 9773824855 ✨ Escorts Service In Delhi Ncr,
BEST Call Girls In Greater Noida ✨ 9773824855 ✨ Escorts Service In Delhi Ncr,BEST Call Girls In Greater Noida ✨ 9773824855 ✨ Escorts Service In Delhi Ncr,
BEST Call Girls In Greater Noida ✨ 9773824855 ✨ Escorts Service In Delhi Ncr,noida100girls
 
Call Girls In Sikandarpur Gurgaon ❤️8860477959_Russian 100% Genuine Escorts I...
Call Girls In Sikandarpur Gurgaon ❤️8860477959_Russian 100% Genuine Escorts I...Call Girls In Sikandarpur Gurgaon ❤️8860477959_Russian 100% Genuine Escorts I...
Call Girls In Sikandarpur Gurgaon ❤️8860477959_Russian 100% Genuine Escorts I...lizamodels9
 
Buy gmail accounts.pdf Buy Old Gmail Accounts
Buy gmail accounts.pdf Buy Old Gmail AccountsBuy gmail accounts.pdf Buy Old Gmail Accounts
Buy gmail accounts.pdf Buy Old Gmail AccountsBuy Verified Accounts
 

Último (20)

APRIL2024_UKRAINE_xml_0000000000000 .pdf
APRIL2024_UKRAINE_xml_0000000000000 .pdfAPRIL2024_UKRAINE_xml_0000000000000 .pdf
APRIL2024_UKRAINE_xml_0000000000000 .pdf
 
Organizational Structure Running A Successful Business
Organizational Structure Running A Successful BusinessOrganizational Structure Running A Successful Business
Organizational Structure Running A Successful Business
 
Future Of Sample Report 2024 | Redacted Version
Future Of Sample Report 2024 | Redacted VersionFuture Of Sample Report 2024 | Redacted Version
Future Of Sample Report 2024 | Redacted Version
 
2024 Numerator Consumer Study of Cannabis Usage
2024 Numerator Consumer Study of Cannabis Usage2024 Numerator Consumer Study of Cannabis Usage
2024 Numerator Consumer Study of Cannabis Usage
 
Digital Transformation in the PLM domain - distrib.pdf
Digital Transformation in the PLM domain - distrib.pdfDigital Transformation in the PLM domain - distrib.pdf
Digital Transformation in the PLM domain - distrib.pdf
 
BEST Call Girls In Old Faridabad ✨ 9773824855 ✨ Escorts Service In Delhi Ncr,
BEST Call Girls In Old Faridabad ✨ 9773824855 ✨ Escorts Service In Delhi Ncr,BEST Call Girls In Old Faridabad ✨ 9773824855 ✨ Escorts Service In Delhi Ncr,
BEST Call Girls In Old Faridabad ✨ 9773824855 ✨ Escorts Service In Delhi Ncr,
 
Islamabad Escorts | Call 03070433345 | Escort Service in Islamabad
Islamabad Escorts | Call 03070433345 | Escort Service in IslamabadIslamabad Escorts | Call 03070433345 | Escort Service in Islamabad
Islamabad Escorts | Call 03070433345 | Escort Service in Islamabad
 
Cybersecurity Awareness Training Presentation v2024.03
Cybersecurity Awareness Training Presentation v2024.03Cybersecurity Awareness Training Presentation v2024.03
Cybersecurity Awareness Training Presentation v2024.03
 
International Business Environments and Operations 16th Global Edition test b...
International Business Environments and Operations 16th Global Edition test b...International Business Environments and Operations 16th Global Edition test b...
International Business Environments and Operations 16th Global Edition test b...
 
Global Scenario On Sustainable and Resilient Coconut Industry by Dr. Jelfina...
Global Scenario On Sustainable  and Resilient Coconut Industry by Dr. Jelfina...Global Scenario On Sustainable  and Resilient Coconut Industry by Dr. Jelfina...
Global Scenario On Sustainable and Resilient Coconut Industry by Dr. Jelfina...
 
8447779800, Low rate Call girls in Uttam Nagar Delhi NCR
8447779800, Low rate Call girls in Uttam Nagar Delhi NCR8447779800, Low rate Call girls in Uttam Nagar Delhi NCR
8447779800, Low rate Call girls in Uttam Nagar Delhi NCR
 
Call US-88OO1O2216 Call Girls In Mahipalpur Female Escort Service
Call US-88OO1O2216 Call Girls In Mahipalpur Female Escort ServiceCall US-88OO1O2216 Call Girls In Mahipalpur Female Escort Service
Call US-88OO1O2216 Call Girls In Mahipalpur Female Escort Service
 
NewBase 19 April 2024 Energy News issue - 1717 by Khaled Al Awadi.pdf
NewBase  19 April  2024  Energy News issue - 1717 by Khaled Al Awadi.pdfNewBase  19 April  2024  Energy News issue - 1717 by Khaled Al Awadi.pdf
NewBase 19 April 2024 Energy News issue - 1717 by Khaled Al Awadi.pdf
 
Call Girls In Sikandarpur Gurgaon ❤️8860477959_Russian 100% Genuine Escorts I...
Call Girls In Sikandarpur Gurgaon ❤️8860477959_Russian 100% Genuine Escorts I...Call Girls In Sikandarpur Gurgaon ❤️8860477959_Russian 100% Genuine Escorts I...
Call Girls In Sikandarpur Gurgaon ❤️8860477959_Russian 100% Genuine Escorts I...
 
8447779800, Low rate Call girls in Tughlakabad Delhi NCR
8447779800, Low rate Call girls in Tughlakabad Delhi NCR8447779800, Low rate Call girls in Tughlakabad Delhi NCR
8447779800, Low rate Call girls in Tughlakabad Delhi NCR
 
8447779800, Low rate Call girls in New Ashok Nagar Delhi NCR
8447779800, Low rate Call girls in New Ashok Nagar Delhi NCR8447779800, Low rate Call girls in New Ashok Nagar Delhi NCR
8447779800, Low rate Call girls in New Ashok Nagar Delhi NCR
 
BEST Call Girls In Greater Noida ✨ 9773824855 ✨ Escorts Service In Delhi Ncr,
BEST Call Girls In Greater Noida ✨ 9773824855 ✨ Escorts Service In Delhi Ncr,BEST Call Girls In Greater Noida ✨ 9773824855 ✨ Escorts Service In Delhi Ncr,
BEST Call Girls In Greater Noida ✨ 9773824855 ✨ Escorts Service In Delhi Ncr,
 
Call Girls In Sikandarpur Gurgaon ❤️8860477959_Russian 100% Genuine Escorts I...
Call Girls In Sikandarpur Gurgaon ❤️8860477959_Russian 100% Genuine Escorts I...Call Girls In Sikandarpur Gurgaon ❤️8860477959_Russian 100% Genuine Escorts I...
Call Girls In Sikandarpur Gurgaon ❤️8860477959_Russian 100% Genuine Escorts I...
 
Japan IT Week 2024 Brochure by 47Billion (English)
Japan IT Week 2024 Brochure by 47Billion (English)Japan IT Week 2024 Brochure by 47Billion (English)
Japan IT Week 2024 Brochure by 47Billion (English)
 
Buy gmail accounts.pdf Buy Old Gmail Accounts
Buy gmail accounts.pdf Buy Old Gmail AccountsBuy gmail accounts.pdf Buy Old Gmail Accounts
Buy gmail accounts.pdf Buy Old Gmail Accounts
 

Morten Frisch Gasex 2010 Paper 14 November 2010

  • 1. Version 2, updated 14 November 2010 GAS MARKET DYNAMICS AND THE FUTURE PRICING OF SPOT LNG To be presented at Plenary – Panel Discussion I: Energy Supply Security GASEX 2010 CONFERENCE Taipei, Taiwan Wednesday, 24 November 2010 Morten Frisch Senior Partner Morten Frisch Consulting Morten Frisch Consulting 6 Holmwood Close East Horsley Surrey KT24 6SS United Kingdom Tel: +44-1483-284248 Fax: +44-1483-285099 Email: office@mfcgas.com Web: www.mfcgas.com Morten Frisch Consulting accepts no liability for commercial decisions based on the content of this paper. Although the paper is copyright of Morten Frisch Consulting, quotes from the paper are permitted, provided full references to the paper and Morten Frisch Consulting are made. Onward transmission or copying of the paper is allowed in its original form only.
  • 2. Gas Market Dynamics And The Future Pricing Of Spot LNG, Morten Frisch, GASEX 2010 Contents About the Author .................................................................................................................................... 3 Abbreviations .......................................................................................................................................... 4 Executive Summary................................................................................................................................. 5 Causes of the LNG Surplus....................................................................................................................... 6 a) Unconventional Gas a Challenge for LNG .................................................................................. 6 b) World-wide Liquefaction Capacity Developments ....................................................................... 7 c) Uncontracted LNG Availability .................................................................................................. 8 d) Recession Impact on Gas Demand ........................................................................................... 9 LNG Spot and Short-term Trading ...........................................................................................................10 Commercial Model for Spot and Short-term Trading .................................................................................15 Tables Table 1: Projected Incremental LNG Availability ........................................................................................ 7 Table 2: Flexible LNG Sales as Percentage of Total LNG Exports ................................................................ 8 Table 3: Asia LNG Demand Q1-Q3 2010 ..................................................................................................10 Figures Figure 1: Spot and Short-Term LNG Exports ............................................................................................. 8 Figure 2: Interrelations of LNG Markets ...................................................................................................11 Figure 3: Relationship Between Henry Hub and NBP Prices .......................................................................11 Figure 4: Price Relationship between HH, NBP, BAFA and Japan LNG Import Prices....................................13 Figure 5: Current LNG Spot Price Dynamics (schematic) ...........................................................................13 Figure 6: Japanese DES Spot Prices Potential Range ................................................................................14 Keywords: 1. Gas Markets. 2. LNG Markets. 3. LNG Supply. 4. LNG Pricing. 5. Spot LNG. 6. LNG Trading. 7. LNG Price Benchmarks. 8. LNG Short-term Sales. 9. Platform-based LNG Trading. 10. Market-based LNG Price Discovery. 11. US LNG Imports. 12. European Gas Market. 13. LNG Trade Routes. 14. Shale Gas. 15. Unconventional Gas. © 2010 Morten Frisch Consulting 2
  • 3. Gas Market Dynamics And The Future Pricing Of Spot LNG, Morten Frisch, GASEX 2010 About the Author Morten Frisch, Senior Partner, Morten Frisch Consulting (MFC) Morten Frisch’s career developed in parallel with the gas industry in his home country of Norway. He has more than 35 years of hands-on experience addressing strategic, commercial and operational issues along the entire value chain for LNG and pipeline gas. This experience stems from work for the Norwegian Government, multinational oil companies and as a consultant since 1990. The first time Morten Frisch led a gas sale negotiation was in 1976, the year his first dealings with LNG receiving terminals (Everett and Cove Point terminals, USA) also took place. His first LNG marketing work was conducted in 1980 (for the then Phillips Petroleum’s Bonny LNG project in Nigeria). In 1977 as part of gas price indexation formulae design work, Morten Frisch was instrumental in the development and drafting of the Norwegian and Swiss law Price Review and Price Re-opener clauses, now universally used in long - term gas sales and purchase contracts for the supply of gas to Continental Europe. In 1993 together with Freshfields solicitors in London he converted this language to English and New York law. The resulting Price Review and Price Re-opener clauses are now commonly used in long term Atlantic Basin LNG supply agreements. Since 1990 Morten Frisch has conducted extensive work related to natural gas in the Middle East, Iran, Russia, and Central and Western Europe. He has also provided consulting services to clients or projects in North and West Africa, Japan, Australia and New Zealand. He is familiar with gas developments in North America and has monitored and analysed unconventional gas developments for more than ten years. Morten Frisch and MFC’s consulting practice deals with a variety of gas issues, with a high number of assignments addressing gas pricing issues, commercial optimisation, risk mitigation strategies and methods for operations in rapidly changing gas market environments. He has been called upon as an expert witness in arbitrations and court cases dealing with gas contract related issues, particularly in disputes involving price review/price re-opener clauses. Morten Frisch has acted as a lead negotiator in gas sales and purchase negotiations for clients. In the past he has also advised governments on international gas issues. He also advises clients on the organisational structure and staffing of gas-related projects, and he has acted as a mentor for their novice commercial gas staff. He is an established professional in the field of gas training. Since 2007 Morten Frisch has been supporting clients in the development of a more transparent and reliable way to establish gas market-based pricing of spot and short-term LNG sales. Morten Frisch is a chartered engineer (Sivil Ingeniør) in his home country of Norway and an economist (degrees from University of Newcastle upon Tyne, UK and Massachusetts Institute of Technology (MIT), Mass., USA). He is a member of the Society of Petroleum Engineers (SPE) (since 1975), the International Association of Energy Economics (IAEE), the British Institute of Energy Economics (BIEE) and a founding member of the Norwegian Petroleum Society (NPF). He has published a number of articles addressing strategic and commercial gas issues. He is frequently invited to give presentations at major international gas and energy conferences and appears regularly as a guest on major TV stations’ business programmes. © 2010 Morten Frisch Consulting 3
  • 4. Gas Market Dynamics And The Future Pricing Of Spot LNG, Morten Frisch, GASEX 2010 Abbreviations BAFA = Bundesamt für Wirtschaft und Ausfuhrkontrolle is the name for the German Federal Office of Economics and Export Control. Monthly average unit cost of imported natural gas across all border points is published by this Federal Office on a monthly basis in €/TJ. Bcm = Billion cubic meters (106). CEGH = the Central European Gas Hub at Baumgarten, established by OMV Gas & Power GmbH. OMV and Gazprom have recently signed a Cooperation Agreement to jointly develop the hub with the aim of it becoming the largest trading platform in Continental Europe (Press Release of 25 January 2010) DES = Delivered Ex Ship. GASPOOL = joint company which operates the market area cooperation of DONG Energy Pipelines GmbH, Gasunie Deutschland Transport Services GmbH, ONTRAS – VNG Gastransport GmbH and WINGAS TRANSPORT GmbH & Co. KG. Henry Hub (HH) = Henry Hub is the pricing point for natural gas futures contracts traded on the New York Mercantile Exchange (NYMEX). It is also a physical point on the natural gas pipeline system in Erath, Louisiana. Mmbtu = Million British Thermal Units Mtpa = million tonnes per annum. NBP = the virtual National Balancing Point in the United Kingdom’s network of pipelines forming the national gas transmission system and the hub in Europe with the largest trade volumes and the greatest trading depth. NCG/EGT = a joint company which operates the market area cooperation of Bayernets GmbH, Eni Gas Transport Deutschland S.p.A., E.ON Gastransport GmbH, GRTgaz Deutschland GmbH, GVS Netz GmbH. After its most recent expansion, it is now referred to as simply NCG (Net Connect Germany). In 2010 it became the largest trading hub after TTF in Continental Europe. PEG-Nord = the virtual trading point in the North of France, created in 2009 when the three zones (PEG OUEST, PEG EST, PEG NORD) merged into one. PSV = Punto di Scambio Virtuale, is the name of the Italian Virtual Trading Point established by Snam Rete Gas. Sm3 = a cubic meter of pipeline-quality gas at standard conditions with gross calorific value of 39 MJ. TTF = the Title Transfer Facility, the virtual national balancing point in the Dutch pipeline network and in 2010 the largest trading hub in Continental Europe. ZEE Hub = Physical gas trading hub at Zeebrugge which was the first major gas trading hub in Continental Europe. © 2010 Morten Frisch Consulting 4
  • 5. Gas Market Dynamics And The Future Pricing Of Spot LNG, Morten Frisch, GASEX 2010 Executive Summary A world wide LNG surplus started developing in late 2008. This paper examines the causes of the surplus and the changes the international LNG industry should adopt to address it. The advent of unconventional gas and shale gas in particular has changed the North American gas scene beyond recognition. Neither the USA nor Canada needs to import LNG on a regular basis and both countries could before 2020 become exporters of domestically produced gas in the form of LNG from new liquefaction facilities planned for the US Gulf coast and the west coast of Canada. The Lower 48 States of the USA already re-export LNG by ocean going tankers from two Gulf Coast terminals. North American shale gas exploration trends and developments are now being transferred to countries in other parts of the world. A number of new liquefaction plants currently under construction will come on stream in the period to 2015. Although some major players in the LNG liquefaction industry are suffering from serious feedgas problems which will limit product availability from a number of existing plants, the industry’s liquefaction capacity is likely to see more than a 50 per cent addition of operational production capacity before the end of 2014. A large part of the additional liquefaction capacity which was originally destined for the US and Canadian markets is now no longer required to supply these markets. The quantities of LNG sold in the flexible spot and short term markets are predicted to increase substantially over the next 3 to 4 years as a result. They could be more than double the 2009 observed levels. Gas demand in US and Canada as well as Europe although improving, is still weak after the recession. Both market regions are currently more than adequately supplied and as a result experience depressed gas prices. The Asian LNG market on the other hand has come out of recession much faster and is now showing strong demand growth and firming spot and short term prices. International LNG trade routes have been changed as a result of the North American gas supply situation. The UK National Balancing Point (NBP) has become the dominant trading hub for the pricing of spot and flexible LNG supplies, since Henry Hub and the North American gas market have price-wise become isolated from gas markets in Asia, Europe and South America. Russia’s Gazprom which has lost market share in Europe due to inflexible oil-indexed gas pricing could be the international LNG industry’s wildcard. Should the company start discounting gas prices towards the lower European hub prices, then this is likely to reduce Europe’s attractiveness to LNG suppliers. If the current balance between LNG supply and demand is disturbed in such a way that North American gas prices are no longer isolated from prices in other international gas markets, then such a development would likely also have a major impact on the international pricing of LNG. The Asian market in general and the traditional markets of Japan, South Korea and Taiwan in particular, are likely to remain the highest priced LNG markets also in the future and should be in a position over the next five years, and likely beyond, to attract sufficient LNG supplies for their needs. The current gas market environment has demonstrated how the traditionally used model for commercial LNG operations can no longer deliver optimum utilisation of available product. This situation is now being magnified as a result of a high number of new industry participants. Energy industry publishing houses and major commodity brokers have recognised that the LNG industry needs better market and pricing transparency as well as the development of screen-based LNG market data systems and trading tools which should lead to proper market-based pricing of spot LNG and improved optimisation of LNG chain activities. © 2010 Morten Frisch Consulting 5
  • 6. Gas Market Dynamics And The Future Pricing Of Spot LNG, Morten Frisch, GASEX 2010 Causes of the LNG Surplus a) Unconventional Gas a Challenge for LNG Unconventional gas, meaning tight gas, shale gas and coal bed methane, has during the last 10 years played a large and increasing role in the supply of gas to the Lower 48 States of the USA in particular, but also in Canada. This development has been accelerated by advances in drilling and production techniques of shale gas, advances that started becoming significant around 2006. Shale gas production has since this year developed from being a relatively small source of gas to one that has changed US gas supply in a substantial way. The “shale gas revolution”, now spreading throughout the North American continent, has led to a situation where the region already today can be perceived to be self-sufficient in natural gas on an average annual basis. Domestic production together with underground gas storage should also provide sufficient capacity to meet peak gas demand during most periods of the year. Unconventional gas, shale gas in particular, has not yet reached its full potential in North America. Technological advances in shale production are now made on a continuous basis improving shale gas economics in a substantial way. For example, after only a year of experimentation with flowing well pressure modifications, it has been possible to increase expected ultimate recovery (EUR) of gas per well by some 30 per cent in some of the major shale gas plays. Moreover, many of the new shale gas producing areas still lack the necessary gas gathering, processing and transmission infrastructure required for large scale commercial production and transportation of sales gas to markets. These needs for infrastructure have been made more acute by the fact that many of the shale plays in addition to dry gas also produce substantial quantities of natural gas liquids (NGLs) in particular and also light crude oils. New producing areas such as the Marcellus Basin in the North East USA and Eagle Ford in South West Texas should by 2015 have the necessary infrastructure in place to change gas flow patterns and, therefore, change gas pricing along the Atlantic seaboard of the USA and Canada. All US and Canadian LNG import terminals are located on this coast. The prolific Marcellus Basin producing area in addition to serving the currently high-priced gas markets of New England, will also supply gas to Canada further north and to markets bordering the Gulf of Mexico. Marcellus gas will be flowing from the North East USA towards Henry Hub in Louisiana, the world’s largest gas trading hub, likely resulting in excess gas supplies and in keeping Henry Hub gas prices low. This development has already lead to soft gas price signals throughout the international gas industry. With unconventional gas flowing into the domestic market, traditional price signals in the US can no longer on their own reflect the economic potential of new reserves and their likely production growth. In fact, despite soft Henry Hub prices currently rendering in many areas gas resources uneconomic, wells keep being drilled and production from these is brought to the market. The significant margin producers receive from the extraction of NGL and light oils means the gas coming out of these wells is becoming a by-product of the liquids production. Moreover, in many cases, producers, bound by the strict terms of expensive acreage lease agreements, are forced to drill for gas and complete wells for production, irrespective of market price signals. As a result, a sustainably strong gas supply keeps market prices low, a situation exacerbated by the absence of a counter-balancing strong demand. With total gas demand weak in the US for some time, small increases mainly from the power generation fuel market have been unable to reverse the downward trend of gas market price signals. Based on the latest gas demand forecast from the US Department of Energy’s Energy Information Administration, US gas demand will remain relatively stable in the short to medium term and unable to fully absorb all new sales gas production made available to the market. Allegedly the practice of drilling long horizontal wells and the hydraulic fracturing of these in order to obtain maximum gas production from shale deposits have resulted in environmental concerns, particularly related to water management issues including claims of water table contaminations. It is not known that the latter has been proved. However, international oil and gas companies with proved “green” credentials, good technology and people are now becoming increasingly involved in North American shale gas exploration and production operations. These large and resourceful companies should be able to operate to new and more environmentally friendly standards regarding drilling and hydraulic fracturing of wells, a situation which should correct perceived mistakes made in the past by pioneering small independent companies. © 2010 Morten Frisch Consulting 6
  • 7. Gas Market Dynamics And The Future Pricing Of Spot LNG, Morten Frisch, GASEX 2010 The advent of unconventional gas and shale gas in particular has changed gas demand planning in North America beyond recognition. As an example, as late as 2007 US Authorities projected an LNG import requirement of some 55 mtpa (80 bcm of pipeline quality gas) to balance its gas markets in 2015 and a further increase in imported LNG requirements was predicted in 2020. Only a small part if any of this LNG import volume will now be required in the US and a similar situation is developing in Canada. As a result of developing gas surpluses both the Lower 48 States of the USA and Canada could become exporters of LNG produced from domestic feedgas before 2020. The US State of Alaska is currently a net exporter of LNG. North American shale gas exploration trends and developments are being now transferred to countries like Australia, China and India. In the future this will also be the case in Indonesia, South Africa, Jordan and even Russia. These countries will likely all have substantial shale gas production in ten years time. Although shale gas exploration has also started within European Union countries, the future shale gas production levels in Western and Central Europe are likely to be more uncertain. b) World-wide Liquefaction Capacity Developments In parallel with unconventional gas developments in North America, substantial new projects for LNG liquefaction have been developed and are in the process of being brought to the market around the world. The most recent major projects are located in Qatar, Sakhalin in Russia, Tangguh in Indonesia, Equatorial Guinea, Yemen, Peru, Western Australia, Angola and Algeria. A large part of the capacity of these LNG liquefaction projects was meant to supply the US, in particular, and also Canada. Now, the operators of these projects have to re-direct supply towards Asian and European markets in particular, but also to new “counter-seasonal” markets in South America and in the Arabian Gulf area. Table 1 entitled “Projected Incremental LNG Availability” shows a projection of total anticipated new LNG liquefaction capacity coming on stream between the beginning of 2008 and end 2014. Table 1: Projected Incremental LNG Availability LNG expressed as bcm of pipeline quality gas per year 2008 2009 2010 2011 2012 2013 2014 Total anticipated additional LNG capacity [1] 11.5 33.9 80.0 114.6 134.7 144.4 146.7 Reduction in LNG production due to feedgas problems [2] 0.0 40.5 37.7 43.5 48.8 52.8 54.4 Anticipated incremental LNG availability [3] 11.5 -6.7 42.3 71.1 85.9 91.6 92.2 Source: MFC estimates, updated 14 November 2010 [3]=[1]-[2] A number of traditional LNG suppliers, notably Indonesia, Nigeria, Algeria, Egypt, Oman and Malaysia, to mention the most important, have over the recent years experienced problems in securing adequate feedgas supplies for their LNG liquefaction plants. Some of these feedgas problems are the result of competition for gas supplies between domestic market requirements and export projects. This is an increasing problem in many LNG producing countries. The inadequate feedgas supply in total represented a reduction in LNG production of some 28 mtpa (40.5 bcm) in 2009 when compared to nameplate capacity. As shown in Table 1 these reductions have been projected to increase to some 37.5 mtpa (54.4 bcm) in 2014. Among the existing liquefaction plants Nigeria LNG presents a major uncertainty due to disruptions to feedgas supplies caused by insurrection in the gas producing area. In 2008 the company produced at only 65% of nameplate capacity, a number which fell to 51% in 2009. The company also experienced substantial reductions in deliveries during the first half of 2010, a situation that appears to have been corrected for the last months of the year. In Table 1 it has been assumed that Nigeria in future years will be able to produce at 85 per cent of nameplate capacity, a normal annual operating level for the industry. In 2009 the combined effect of delayed start-up of new liquefaction capacity and the reduction in LNG production due to feedgas problems resulted in a reduction in LNG availability of 4.6 mtpa (6.7 bcm) when compared to previously anticipated LNG availability based on nameplate capacities. However, overall worldwide LNG production did increase by 9.6 mtpa (13.9 bcm) or 5.66 per cent to 179.1 mtpa (259.7 bcm) in 2009 when compared to 2008. © 2010 Morten Frisch Consulting 7
  • 8. Gas Market Dynamics And The Future Pricing Of Spot LNG, Morten Frisch, GASEX 2010 Anticipated incremental LNG availability when using end 2007 capacity as a base and adjusting for reduction in LNG production due to feedgas problems is forecasted to increase from 29.2 mtpa (42.3 bcm) in 2010 to 63.6 mtpa (92.2 bcm) in 2014. c) Uncontracted LNG Availability Uncontracted LNG availability is product sold under spot and short-term sales arrangements. Spot and short-term LNG exports or sales are understood to be sales of duration of up to 4 years. Such spot and short-term sales are also referred to as “flexible” sales in the text below. Figure 1: Spot and Short-Term LNG Exports 35 30 Middle East/Africa/Europe Americas 25 Australasia Others 20 Mtpa Total 15 10 5 0 1999 2000 2001 2002 2003 2004 2005 2006 2007 2008 2009 Source: GIIGNL Figure 1 entitled “Spot and Short-term LNG Exports” shows the development of flexible LNG sales since 1999. There has been a marked increase in such sales since 2005. The major source of such sales have been the Middle East, Africa and Europe, the latter being cargoes diverted from European destinations such as Spain and France to the USA in 2005/06 and mainly to Asian markets thereafter. Since 2008 flexible sales from the Americas (Trinidad and Tobago) and Australasia (mainly Sakhalin in Russia and Tangguh in Indonesia) have increased due to diversion of cargoes originally destined for the USA. Table 2 entitled “Flexible LNG Sales as Percentage of Total LNG Exports” shows that flexible LNG sales peaked at 21 per cent of total exports in 2007. The comparable figure for 2009 was some 16 per cent or 29.3 mtpa (42.5 bcm) out of the 179.1 mtpa (259.7 bcm) total LNG production in the year. This figure is expected to increase to above 20 per cent again in the time period 2010 – 2014 when a number of new liquefaction projects which were originally meant to supply the US and Canadian markets come on stream. Table 2: Flexible LNG Sales as Percentage of Total LNG Exports LNG spot and short-term sales Assessment of total exports 2005 15% 2006 17% 2007 21% 2008 19% 2009 16% Source: MFC estimates. © 2010 Morten Frisch Consulting 8
  • 9. Gas Market Dynamics And The Future Pricing Of Spot LNG, Morten Frisch, GASEX 2010 Arabian Peninsula-based LNG sellers are likely to provide large quantities of product for flexible sales by the end of 2011, when all plants being constructed at Ras Laffan in Qatar should have reached full production. In addition to the availability of flexible LNG product, there is another industry development which may act as a catalyst for LNG producers to sell into the flexible markets. This is the emergence of a high number of energy and commodity trading houses as active players in the LNG market. These companies appear to be in a position to offer higher prices for product than traditional buyers. However, new entrants to the LNG market that do not have equity production or long-term supply contracts which include arrangements for LNG tanker transportation, face a serious industry bottleneck. Shipping availability is an important hurdle. About 80 per cent of the current LNG fleet is assigned to production projects. Of the remaining LNG tankers some 80 per cent are controlled by the international oil and gas companies leaving only some 4 per cent of the current fleet available for independent charter on a regular basis1. It has been observed that traders and commodity trading houses have failed to secure cargoes due to the lack of acceptable LNG tankers. An interesting case of a company which for some time directed all of its uncontracted LNG supply to the LNG spot and short-term market is Algeria’s Sonatrach. Algeria’s marketing decisions during the period 2006- 2008 were based on the assumption that spot sales were sustainably more attractive than long-term contract sales. During this period LNG volumes that had previously been delivered to Belgium and Spain under long- term contracts, were released to the spot market by purposely not renewing the expiring contracts. During the same period Sonatrach decided to construct the Skikda rebuild and Arzew 3/Gassi Touil plants without long-term sales agreements. These two plants are expected to bring up to 9.2 mtpa of additional product to the market when they both have reached full production capacity after a gradual build up during the period 2012 to 2015. However, Sonatrach’s strategy ultimately proved to be unsustainable as the recession changed the international LNG markets from the late 2008. Amidst softening prices and the absence of long-term contracts for their under construction plants Sonatrach senior management started to realise that the marketing decisions of the past were no longer viable. Such realisation is reflected in a statement of the then Algerian Energy Minister, Dr. Chakib Khelil at the Gas Exporting Countries Forum (GECF) in April 2010. Dr. Khelil urged member countries to reduce spot selling in order to boost gas prices2. His statement likely heralded Algeria’s future selling strategy. In fact, the sharp reduction observed in Algerian LNG sales over the past six months of 2010 could possibly, at least in part, be a conscious effort to boost price levels by holding back product from the market. d) Recession Impact on Gas Demand Under a) above we discussed the soft gas demand in the USA. Both Canada and the USA are still suffering from the effect of the recession with reduced industrial and commercial activity. Persistent high levels of unemployment are also likely to exert a downward pressure on domestic gas demand in North America. Key European gas markets such as Germany experienced reduced gas demand due to demand destruction already in 2007. Starting in the fourth quarter 2008, this development was magnified on a Europe-wide basis by the onset of the recession. In 2009 the 25 European Union countries that consume natural gas experienced a fall in consumption of 6.4 per cent compared to the level in 2008. This was the case despite the fact the winter of 2009/10 was in many countries the coldest in 30 years. Industrial and feedstock sectors saw in 2009 particularly large reductions in gas demand. Although these energy demand sectors have experienced some improvements, their 2010 gas demand is expected to remain below historical levels. In the case of the German gas market utilities are expecting total gas demand in 2010 to return to 2008 levels of some 85 bcm against a total demand of 92.8 bcm in 2006. In spite of the negative market development in 2009 and part of 2010, LNG producers have managed to make substantial inroads in European markets with new or expanded LNG terminal facilities such as in the UK, Belgium and Italy. This has been at the expense of the traditional pipeline suppliers, Russia’s Gazprom and Algeria’s Sonatrach, which to a large extent have failed to adapt to Continental Europe’s new two-tier 1 New LNG Trading Players to challenge Old Guard, by Edward McAllister, Reuters, 12 August 2010. 2 GECF Falls Short of Spot Sales Deal, article in the World Gas Intelligence, 21 April 2010, p.1 © 2010 Morten Frisch Consulting 9
  • 10. Gas Market Dynamics And The Future Pricing Of Spot LNG, Morten Frisch, GASEX 2010 price system3. These two suppliers have as a result seen sharp declines in their gas exports to European Union countries, while Qatar in particular but also Norway have increased their market shares. In contrast to North American and European gas demand, gas consumption in the main Asian LNG importing countries has increased very noticeably during the first six months of 2010 compared to the same period in 2009. This development has continued in third quarter 2010 as a result of increased industrial activity and unusual warm weather in some of the key markets. Table 3 below entitled “Asia LNG Demand Q1-Q3 2010” presents LNG import developments for Japan, South Korea, Taiwan, China and India. In the case of India LNG imports have fallen in 2010 due to the start up of new domestic gas production. Based on current trends in economic development with the shift in activity from North America and Europe to Asian economies, energy demand including LNG is likely to continue showing healthy growth in Asia with the possible exception of Japan. This will in turn create additional demand for flexible LNG supplies as well as new long term LNG supply arrangements. Table 3: Asia LNG Demand Q1-Q3 2010 2010 2009 Volume ('000 tons) Jan-Sep Jan-Sep change % change Japan 52,712 48,027 4,685 9.75% South Korea 23,039 17,388 5,651 32.50% Taiwan 8,478 6,695 1,783 26.62% China 6,708 3,959 2,748 69.42% India 6,589 7,285 - 696 -9.55% Total 97,526 83,356 14,171 17.00% Source:Customs data. LNG Spot and Short-term Trading The LNG industry is increasingly becoming a global business. The three traditional main LNG consuming markets have been interlinked through LNG trade as shown in Figure 2 entitled “Interrelations of LNG Markets”. In this diagram the North American market is represented by Henry Hub, the main price-setting gas trading hub on the continent. Europe has been split between Spain and Portugal, which together have historically been the largest LNG importers in Europe, and the other European countries further north, mainly due to inadequate gas pipeline connections between Spain and France. Of the European gas trading hubs shown, the UK’s National Balancing Point or NBP is normally the price-setter in North West Europe. 3 Current European Gas Pricing Problems: Solutions Based on Price-Review and Price-Re-opener Provisions, Morten Frisch, Centre for Energy, Petroleum and Mineral Law and Policy, Dundee University, Working Research Paper Series 2010/03. © 2010 Morten Frisch Consulting 10
  • 11. Gas Market Dynamics And The Future Pricing Of Spot LNG, Morten Frisch, GASEX 2010 Figure 2: Interrelations of LNG Markets The price relationship between Henry Hub in the USA and NBP in the UK for the period from July 2009 is shown in Figure 3 entitled “Relationship between Henry Hub and NBP Prices”. In the past these two price curves have normally moved in parallel during periods of Atlantic Basin LNG supply surpluses. This relationship appears to have come to an end at least temporarily starting in the spring of 2010. The likely explanation for this is that the Atlantic Basin LNG price link has been broken with US imports staying low, and mainly coming from Trinidad and Tobago under long-term contracts, while the UK has seen rapidly increasing LNG import volumes. By far the largest supplier of LNG to the UK in 2009 and 2010 has been Qatar. Qatar with its large LNG exports also to East Asian markets therefore connects the LNG markets of Asia and Europe. Figure 3: Relationship Between Henry Hub and NBP Prices 8 7 HH MA NBP MA $/mmbtu 6 5 4 3 Jul-09 Sep-09 Nov-09 Jan-10 Mar-10 May-10 Jul-10 Sep-10 Nov-10 © 2010 Morten Frisch Consulting 11
  • 12. Gas Market Dynamics And The Future Pricing Of Spot LNG, Morten Frisch, GASEX 2010 The view that the LNG based Henry Hub and NBP price link has been broken, is supported by the fact that LNG spot prices delivered to North West European and Mediterranean destinations have been priced in relation to NBP. The same has reportedly been the case for spot sales of LNG into East Asian markets4. Although Henry Hub is no longer used as a benchmark for LNG sales into European and Asian markets, Mexican Caribbean coast imports still use Henry Hub-based pricing. It is also understood that product out of Peru LNG has been priced and sold on the basis of Henry Hub. Referring back to Figure 3 above an important question for the international gas industry is: How stable is the current LNG market situation in which the North American market in effect is isolated from gas markets in Asia, Europe and South America? The market forces controlling this situation are dictated by a) the total amount of spot or flexible LNG product available in the market in relation to global LNG demand, b) the availability of receiving terminal capacity in North American markets and c) the availability of shipping to serve North American demand, should the need re-emerge. North America has under-utilised LNG receiving capacity due to a large and increasing unconventional gas production together with a flat gas demand as discussed under section a). The LNG shipping fleet has been developed to serve the North American gas market and a number of vessels in this fleet are today either idle or being used partly loaded. Supply-demand dynamics in the global LNG market is the determining factor. As outlined under section b) above the LNG producing industry will in the period to 2014 be in a position to supply increasing volumes of flexible or spot LNG to the market, if it so wishes. When Dr. Khelil requested that GECF member countries should refrain from spot selling of gas in April 2010, it looked as if his request had fallen on deaf ears. The developments on the part of LNG producers since this date might indicate that this may not have been the case. The future availability of flexible or spot LNG could easily change the current relationship between Henry Hub and NBP gas prices and, therefore, the pricing of LNG on a global basis5. Figure 4 entitled “Price Relationship between HH, NBP, BAFA (Germany) and Japan LNG Import Prices” shows the link between Henry Hub, NBP, BAFA representing average German gas import prices and the average Japanese LNG import price. The Japanese LNG import price, which is the highest of the four prices shown, is mainly priced off the Japanese Customs Cleared average crude oil price (JCC), although Japanese prices based on other crudes such as Brent and Indonesian blends also exist. Until the end of 2008 the German BAFA price reflected mainly the price under long-term oil-indexed gas import contracts. However, after the emergence of a two-tier gas price system in Continental Europe, which resulted in the import of increased volumes of hub priced gas, together with subsequent price renegotiations of long-term contracts, the BAFA reported price has now been increasingly reflecting European hub prices linked to NBP. European oil-indexed gas prices that have not yet been modified were in August 2010 some US$1.6/mmbtu above the reported BAFA- average German gas import price for the same month. In today’s North West European gas market environment it can be assumed that Continental European hub prices will be at a level between NBP and BAFA reported prices provided that the pipeline systems linking the UK and Continental European markets are fully operational. LNG landing in the UK would normally have a DES price of NBP less terminal costs and UK gas transmission systems entry costs. During the third quarter of 2010 typically this represented a price obtained by applying a discount of some 5 per cent to the NBP price. This pricing system will under normal operating conditions make the UK DES LNG spot based price the lowest DES LNG price in North West Europe. During the third quarter 2010 Mediterranean6 DES spot LNG prices have also been at a premium to NBP. 4 Heren Global LNG Markets, 17 September 2010 5 The linkage of prices in the US and UK gas markets was addressed in a paper entitled “Price linkage between US and UK Gas markets. The role of LNG. Can the Markets be de-linked again?” presented by Bjorn Brochmann of Point Carbon at the 11th European IAEE conference in Vilnius, 25-28 of August, 2010 and published in the Conference Proceedings at www.IAEE.org. 6 By Mediterranean is meant Turkey, Greece, Italy, French Med terminals, Spain and Portugal. © 2010 Morten Frisch Consulting 12
  • 13. Gas Market Dynamics And The Future Pricing Of Spot LNG, Morten Frisch, GASEX 2010 Figure 4: Price Relationship between HH, NBP, BAFA and Japan LNG Import Prices 18 16 14 12 $/mmbtu 10 8 6 Henry Hub Month Ahead 4 NBP Month Ahead BAFA (German) Import 2 Japan LNG Import 0 Feb-08 Jun-08 Oct-08 Feb-09 Jun-09 Oct-09 Feb-10 Jun-10 Oct-10 This relationship is demonstrated in Figure 5 entitled “Current LNG Spot Price Dynamics (schematic)”. East Asian DES spot LNG prices are today reportedly referenced to NBP. This is because the Japanese mainly JCC-benchmarked price is at a level allowing shipping differentials to be absorbed by Japanese buyers. The same applies to spot LNG cargoes delivered on a DES basis to South Korea and Taiwanese buyers. China and India have in the past also purchased cargoes based on such pricing. Figure 5: Current LNG Spot Price Dynamics (schematic) In the LNG Spot and Short-term Trading section it was discussed that North American gas markets are today effectively isolated, price-wise, from gas markets in other parts of the world. Should available LNG product increase to such a level that North American gas markets stop being isolated from gas markets in Asia, © 2010 Morten Frisch Consulting 13
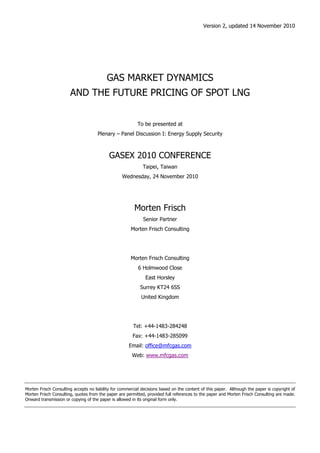
  • 14. Gas Market Dynamics And The Future Pricing Of Spot LNG, Morten Frisch, GASEX 2010 Europe and South America, then such an LNG supply situation would likely lead to rapid gas price developments in most international markets. The answer to how the available LNG product would increase to such a critical level could very well lie in Gazprom’s future marketing strategy for Europe and its desire to regain market share for its pipeline gas supplies. Both Russia and Algeria, as mentioned under section d) above, have seen their sales of gas to European Union countries decline as a result of inflexible pricing in an oversupplied gas market. Both countries have lost market share in Europe. Russia in 2009 exported 142 bcm of pipeline gas to European countries and had planned to increase such exports to 160 bcm in 2010. However, based on the latest gas export data coming out of Moscow, the country will most likely export only some 140 bcm in 20107, even a decrease compared to 2009. Reportedly, a number of Gazprom’s main gas customers claim they are still facing serious difficulties with the pricing of Russian gas supplies and have demanded additional unscheduled price renegotiations. Should Gazprom start discounting gas sales prices under long-term gas sales contracts, it is thought this could have serious implications first of all for European LNG imports. As stated above, Russia in the short term would like to export an additional 20 bcm of pipeline gas, equivalent to some 13.8 mtpa of LNG product. If Russian prices were to be lowered sufficiently to reflect Continental European hub prices, then Russian supplies would increase sharply and potentially achieve the above pipeline gas export ambition. This would have an immediate impact on LNG import levels in Italy, France and Turkey with secondary effects on Belgium, the Netherlands, Germany and Austria. This would in turn result in increased imports of pipeline gas to the UK and hence impact on NBP pricing. Such a development would be reflected in the value of LNG imported into the UK. The value of NBP pricing used as a benchmark for East Asian spot DES sales would be lowered under this scenario at the same time as LNG volumes directed towards East Asian markets would increase and lower the price range for spot LNG deliveries to this region. In the current European gas market environment Gazprom could, therefore, well be the wild card for the pricing of spot LNG sales first of all to Europe and then to East Asian markets. Figure 6: Japanese DES Spot Prices Potential Range 18 Japan LNG Import Price 16 NBP MA Spot Japan LNG Import Forward NBP Forward Curve 14 NBP + 1.50 $/mmbtu NBP + 2.00 $/mmbtu 12 $/mmbtu 10 8 6 4 2 0 Feb-08 May-08 Aug-08 Nov-08 Feb-09 May-09 Aug-09 Nov-09 Feb-10 May-10 Aug-10 Nov-10 Feb-11 May-11 7 Netherlands, Denmark ask for more gas from Gazprom, article in RIA Novosti, 29 October 2010 © 2010 Morten Frisch Consulting 14
  • 15. Gas Market Dynamics And The Future Pricing Of Spot LNG, Morten Frisch, GASEX 2010 Furthermore, under such a scenario where a) Europe becomes less attractive to LNG producers, b) additional volume of LNG is directed to Asian Buyers and c) new seasonal markets in South America and the Arabian Gulf area are unable to absorb all the volumes otherwise destined for Europe, there seems to be only one other market for the surplus LNG product, should this continue to be produced: All surplus LNG, which could not be absorbed in Asian, European and South American markets, would then find its way to the US and Canada, with North America becoming the market of last resort. If this should happen, it would lead to a downward pressure on prices for spot LNG in international markets potentially forcing LNG spot prices to spiral down to levels again set by Henry Hub as benchmark. Russia could well hold the large international gas price wild card. Of course, on the other hand, should there be a combination of increased Asian LNG demand and a persistent reduced availability of installed LNG liquefaction capacity, there could in the short to medium term be a shortage of LNG in Asian markets. Under this scenario it appears that the traditional Japanese, South Korean and Taiwanese buyers can outbid their European counterparts without much difficulty. Based on market information these buyers in September appeared to be prepared to pay at least US$2.5/mmbtu more than the highest long-term contract prices currently serving the German market, a contract price level European gas importers today have great difficulties in passing on to their end consumers. In tight LNG supply situations Japanese buyers have in the past been observed to pay DES prices well in excess of US$20/mmbtu. Figure 7 entitled “Japanese DES Spot Prices Potential Range” presents a comparison of the NBP month ahead price with the Japanese average reported import price from Qatar for corresponding delivery months. Based on forward curves for crude oils, the forward curve of the average Qatari price has been estimated. This estimate is shown together with the forward relationship between the NBP month ahead price curve and Japanese DES LNG spot price ranges and such price ranges relationship with the NBP curve, all observed during the early part of November 2010. Figure 6 confirms the strength of Japan’s LNG purchasing power in relation to that of European gas buyers both historically and during the first half of 2011. Commercial Model for Spot and Short-term Trading The 29.3 mtpa (42.5 bcm) of spot and short-term LNG trade recorded in 2009 was at a substantially lower level than what the industry had expected. Section b) above discussed anticipated incremental LNG availability, using end 2007 capacity as a base, which was projected to be 29.2 mtpa (42.3 bcm) in 2010 increasing to 63.6 mtpa (92.2 bcm) in 2014. A large proportion, probably more than half, of these quantities, if they are produced, are likely to be sold in the spot and short term markets, increasing flexible sales from the current level of some 30 mtpa (43.5 bcm) to in excess of 60 mtpa (87 bcm) by the end of 2014. This quantity of LNG represents a gas demand which exceeds the total demand of most national markets. Furthermore, it will be sourced from an increasing number of liquefaction trains and producers around the world at the same time as the number of LNG regasification terminals, both permanent installations and ship-based units, is growing rapidly. In addition to an increasing number of market players with access to LNG production and receiving infrastructure, there are in November 2010 at least ten energy traders and commodity houses actively participating in the commercial LNG market8. With increased availability of flexible LNG quantities it can be assumed that the number of independent LNG traders in the near term will increase further. Even some of the very conservative Japanese Utilities are now moving into LNG trading in order to optimise their fuel supply portfolios. The industry which supplies energy trading activities and energy market operators with data has understood the increasing need for transparency and improved market data. A number of industry newsletters are now publishing indicative DES spot prices for major LNG market areas such as; South East Asia normally represented by Japan; North West Europe represented by the UK; and the Mediterranean represented by Spain. 8 Factbox – New Trading Players in the LNG Market, Reuters, 10 August 2010 © 2010 Morten Frisch Consulting 15
  • 16. Gas Market Dynamics And The Future Pricing Of Spot LNG, Morten Frisch, GASEX 2010 The maturing of the LNG spot market is also evident by the increasing acceptance of LNG brokers in cargo transactions. Tullett Prebon, an inter-dealer brokering house was the first to launch an LNG brokering desk at the end of 2007, and is now operating from London and Singapore, signalling business is growing. UK commodity house, Spectron has since followed suit. Tullett Prebon LNG brokered its first cargo within a year of being set up and has since been involved in over 10 LNG cargo deals including options and deals for regasified LNG. The company launched in early 2010 the first online screen for advertising LNG cargoes and buying interest. They state that this LNG screen-based service has been designed for fast communication of spot trade interests among their clients and to meet a growing need for greater price transparency. Advocating market transparency and to help its clients get the best possible understanding of LNG trade movements, Tullett Prebon LNG has also launched vessel tracking data services, both on its own and in collaboration with Lloyd’s List Intelligence. The amount of detail and the accuracy of the Tullett Prebon screen-based LNG service are unverified, however it is understood that over 100 market participants now have access to these services. The Spectron Group in its turn launched in September 2010 a screen-based LNG Indices service used to record indicative price levels for spot LNG cargoes to be delivered to East Asia, Mediterranean and North West Europe in 30 and 60 days from the data of the entry date. The recorded LNG price data should, therefore, correspond to the front month (M+1) and the front second month (M+2) in the forward gas market. The Spectron LNG Indices service, just like the publishing houses now also providing indicative LNG spot prices, is based on assessments and reported data that has not necessarily been confirmed by trades. It is hoped that these latest LNG market activities will develop into an Over-The-Counter physical market (OTC market) for LNG and that such a move will ultimately result in deals for string cargoes being recorded and a physical forward price curve starting to develop. One thing can be certain of these analyses and screen-based developments: The traditionally used commercial model for LNG is no longer adequate for an optimum operation of the LNG industry. Electronic trading platforms have long been used to set up commodity exchanges for flexible products such as crude oil, oil products and coal. Financial products developed from the electronic trading of crude oil and oil products are today frequently used by LNG buyers and sellers to hedge their market positions. The LNG industry is as a result becoming increasingly familiar with electronic trading operations and the benefits they can provide. Thus while a credible LNG Index and swap market has yet to establish itself, this would be a natural evolution of the market. The development of electronic market tools for LNG would be very welcome to an increasing number of buyers and sellers of LNG on an international scale. It can be expected that traders in addition to brokers will take the lead in developing such tools as the LNG spot and short term market becomes more liquid in the period to 2015. It is observed that the latest market developments already have increased LNG traders’ appetite for physical risk. In addition to sourcing LNG and trading cargoes of product on board LNG tankers they are also entering into spot and long term LNG tanker charters and contracts for firm capacity at LNG receiving and regasification terminals. Traders are today increasingly operating along the entire LNG chain: hence the need for more sophisticated tools to control and minimise risk. The development and use of transparent and reliable online trading services will lead to proper market-based price discovery for spot or flexible LNG, meaning the discovery of an optimum price for LNG in the various geographic regions in which the product is used on a regular basis. This price will be the direct result of market trading and not based on the cost of fuel alternatives which are used as price benchmarks. It will be primarily dependent upon the demand and supply forces of the underlying fuel with the addition of a shipping differential and any other destination-specific costs. This price will be an accurate reflection of a single market’s activity and/or the interrelations of activities in systems of markets, as demonstrated by the currently observed link between NBP gas prices and the DES price for spot LNG in East Asia. Price discovery tools will have positive consequences not only for buyers and sellers in the LNG industry but also for participants in LNG - dependent industries such as shipping. By monitoring LNG tanker traffic through the Suez Canal during the month of July 2010, it was observed that a total of 36 laden LNG carriers made the voyage through the Canal; 32 sailed from East to West while 4 travelled from West to East. Most of the west-bound cargoes came from Qatar while it is believed that up to 3 of 4 laden eastward transits © 2010 Morten Frisch Consulting 16
  • 17. Gas Market Dynamics And The Future Pricing Of Spot LNG, Morten Frisch, GASEX 2010 may have been delivered to Kuwait and, therefore, sailed past Ras Laffan where the Qatari tankers sailing in the opposite direction had been loaded9. A market-based price discovery process for spot LNG will surely lead over time to a reduction of all such non-optimal shipping flows and shipping routes. One thing that could potentially hamper this development is the fact the LNG shipping fleet does not have the same flexibility as the ocean going fleets for crude oil, petroleum products and dry bulk commodities. It can not be disputed that market based pricing and price discovery will lead to the optimisation of commercial operations and portfolio flows of both LNG suppliers and consumers. On a trading level, if applied to LNG, market based pricing and price discovery would allow for direct, non-benchmark based use of all pricing and hedging possibilities available to traders of other commodities in today’s increasingly sophisticated markets. Looking at history, both gas markets in the USA and UK were modernised and saw the introduction of transparent gas trading systems based on which financial products could be developed, as a result of gas oversupply caused by structural market changes. The combination of the recession, the large increase in LNG supply and further regulatory changes are now driving a similar development in Continental Europe. Only time will tell to what extent the influx of LNG, which is forecast to become available before 2015 without long-term contracts, will cause a similar development in the international LNG industry. Morten Frisch Consulting accepts no liability for commercial decisions based on the content of this paper. Although the paper is copyright of Morten Frisch Consulting, quotes from the paper are permitted, provided full references to the paper and Morten Frisch Consulting are made. Onward transmission or copying of the paper is allowed in its original form only. 9 Suez Canal LNG Traffic Surges in July, LNG World News, 23 August 2010 © 2010 Morten Frisch Consulting 17