SlideShare uma empresa Scribd logo
1 de 5
Baixar para ler offline
DATA
 Table 1–Baseline Blood Pressure

        Systolic pressure          Diastolic pressure              Mean arterial pressure
            (mm Hg)                             (mm Hg)                        (mm Hg)

               121                               64                               78


     Table 2–Blood Pressure
        Response to Cold

        Systolic pressure             Diastolic pressure           Mean arterial pressure
            (mm Hg)                            (mm Hg)                         (mm Hg)

               137                               68                               83


             Table 3

            Condition                         Heart rate                         Time
                                               (bpm)                              (s)

   Resting heart rate                           72.01

   Maximum heart rate                           80.32                           60.07

   Rebound heart rate                           72.01                         20 seconds


Data Analysis
1.     Describe the trends that occurred in the systolic pressure, diastolic pressure, mean arterial
pressure, and heart rate with cold stimulus. How might these responses be useful in a “fight or
flight” situation?

When the cold stimulus was added the systolic pressure, diastolic pressure, mean arterial
pressure, and heart rate went up. In addition to the emotional discomfort we feel when faced with
a stressful situation or introduced to an uncomfortable stimulus, our bodies react by releasing
stress hormones (adrenaline and cortisol) into the blood. These hormones prepare the body for
the "fight or flight response" by increasing the heart rate and blood pressure.
2. As a vital sign, blood pressure is an indicator of general health. A high blood pressure
(140/90 or higher) increases the risk of cardiovascular disease and strokes. Collect the systolic
and diastolic pressures for the class and calculate the average for each. Rate the class average
blood pressure using the follow scale:
                Blood Pressure                                      Category

                 140/90 or higher                                      High

                 120–139/80–89                                   Pre-hypertension

                 119/79 or below                                      Normal


114/69 - on average our class’s blood pressure is normal


3. How long after immersion did your heart rate reach its maximum value? Explain the
physiologic mechanism that led to this change in heart rate.

After about 20 seconds of submerging her foot into the ice water, Anna Lee’s heart rate reached
its maximum value of 80.32 bpm. The physiologic mechanism that led to this change in heart
rate was when her foot was submerged into the water there was decrease circulation to her foot,
which caused stress.

4. Describe the changes in heart rate that occurred after the maximum value. How can you
explain the minimum heart rate value? How would you explain the heart rate variations seen in
the remainder of the experiment?

After Anna Lee’s foot was submerged into the ice water her heart rate reached its maximum at
20 seconds. Her heart rate when resting, before submerging her foot, was 72.01 bpm. This
would explain why 20 seconds after reaching her maximum heart rate it returned to 72.01 bpm.


5. How long after the maximum heart rate did it take to arrive at your rebound heart rate? What
can you say about the relative speed of physiologic response to a stimulus vs. the speed of
mechanisms that are designed to maintain homeostasis?

After reaching the maximum heart rate was reached it took about 20 seconds to arrive at the
rebound heart rate.

6. If the heart rate is too slow there is inadequate blood pressure to maintain perfusion to the
brain. This can lead to loss of consciousness (fainting). Keeping in mind the autonomic nervous
system responses that you observed in this experiment, explain the sequence of events that
results in a severely frightened person fainting.
DATA:
 Table 1–Baseline Blood
        Pressure

    Systolic pressure       Diastolic pressure    Mean arterial pressure            Pulse
        (mm Hg)                 (mm Hg)                (mm Hg)                      (bpm)

          119                      65                      75                        76


 Table 2–Blood Pressure
      After Exercise

    Systolic pressure       Diastolic pressure    Mean arterial pressure            Pulse
        (mm Hg)                 (mm Hg)                (mm Hg)                      (bpm)

          137                      73                      94                       115


             Table 3–Heart Rate

                    Condition

Resting heart rate (bpm)                                                    97.01

Maximum heart rate (bpm)                                                    154.8

Recovery time (s)                                                              35


DATA ANALYSIS
1. Describe the trends that occurred in the systolic pressure, diastolic pressure, mean arterial
pressure and pulse with exercise. Assume that the stroke volume increased from 75 mL/beat to
100 mL/beat. Use this information and the change in pulse with exercise to calculate the change
in cardiac output (stroke volume × heart rate) that occurred per minute.

--       The systolic pressure was higher than the diastolic pressure, mean arterial pressure,
and pulse. The diastolic pressure and mean arterial pressure was around the same numbers.
But the pulse became higher that it originally was on the baseline.
The change in cardiac output is 5,800.
2. Pulse pressure is the difference between systolic pressure (peak pressure during active
contraction of the ventricles) and diastolic pressure (the pressure that is maintained even while
the left ventricle is relaxing). Describe the change in pulse pressure seen with exercise. Which
component of the blood pressure is most responsible for this change?

- your pulse pressure rises during exercise because your heart rate increases and you begin to
breath harder. Cardiology is the component of the blood pressure that is the most responsible
for the change of someone’s pulse pressure with exercise.

3. A change in pulse pressure can be seen in a variety of medical conditions. What would you
expect to happen to the pulse pressure in the following examples?
       (a) In atherosclerosis there is a hardening of the arterial walls.
   - your pulse pressure widens.


        (b) A damaged aortic valve does not seal properly and allows blood to flow back into the
ventricle during diastole.
- Pulse pressure begins to fall when there is aortic valve insufficiency.

4. Normal resting heart rates range from 55−100 beats per minute. What was your/the
subject’s resting heart rate? How much did your/the subject’s heart rate increase above resting
rate with exercise? What percent increase was this?

- The subjects resting heart rate was 76 bpm. The subjects heart rate increased by 39 bpm
with exercise. The heart rate increased by 51%.


5. How does your/the subject’s maximum heart rate compare with other students in your
group/class? Is this what you expected?

Other students heart rates were pretty close to our subjects heart rate. I expected them to
be about the same because all the subjects are the same age and were testing heart rate
under the same conditions.


6. Recovery time has been shown to correlate with degree of physical fitness. How does
your/the subject’s recovery rate compare to that of your classmates? Is this what you expected?
-Our subjects’ recovery rate was slightly shorter than other groups because our subject is a
softball player; therefor she is in better shape. This is the result that I expected because she
works out more often than the subject in other groups.

7. Congestive heart failure is a condition in which the strength of contraction with each beat
may be significantly reduced. For example, the ventricle may pump only half the usual volume of
blood with each beat. Would you expect a person with congestive heart failure to have a faster or
slower heart rate at rest? With exercise?

-I would expect someone with congestive heart failure to have a faster heart rate both at rest and
when exercising, because the muscle is not as powerful so the heart will have to pump more
quickly to compensate for the loss in pressure.

8. Medications are available which can slow the heart or speed it up. If a patient complains of
feeling poorly and has a heart rate of 120 beats per minute, should you administer a medicine to
slow the rate?

-Yes, you should attempt to slow the patients’ heart rate, because a normal heart rate should be
between 50 and 100 at rest and the patients heart rate is at 120.

Mais conteúdo relacionado

Mais procurados

Surviving Sepsis Campaign 2021.pptx.pdf
Surviving Sepsis Campaign 2021.pptx.pdfSurviving Sepsis Campaign 2021.pptx.pdf
Surviving Sepsis Campaign 2021.pptx.pdfAkmalFahrezzy1
 
Coronary Blood Flow
Coronary Blood FlowCoronary Blood Flow
Coronary Blood FlowAdamBilski2
 
Cardiac action potential
Cardiac action potentialCardiac action potential
Cardiac action potentialNikhil Vaishnav
 
Role of raas inhibition in management of hypertension
Role of raas inhibition in management of hypertensionRole of raas inhibition in management of hypertension
Role of raas inhibition in management of hypertensionKyaw Win
 
Ppt recording on ecocardiogram
Ppt recording on ecocardiogramPpt recording on ecocardiogram
Ppt recording on ecocardiogramRekha kumari
 
Fluid responsiveness in critically ill patients
Fluid responsiveness in critically ill patientsFluid responsiveness in critically ill patients
Fluid responsiveness in critically ill patientsUbaidur Rahaman
 
Ambulatory blood pressure monitoring [abpm]
Ambulatory blood pressure monitoring [abpm]Ambulatory blood pressure monitoring [abpm]
Ambulatory blood pressure monitoring [abpm]drvasudev007
 
Fishing for Insights from Single-Lead and Multi-Lead ECG of Live Adult Zebrafish
Fishing for Insights from Single-Lead and Multi-Lead ECG of Live Adult ZebrafishFishing for Insights from Single-Lead and Multi-Lead ECG of Live Adult Zebrafish
Fishing for Insights from Single-Lead and Multi-Lead ECG of Live Adult ZebrafishInsideScientific
 
Pulse wave analysis
Pulse wave analysisPulse wave analysis
Pulse wave analysisJAFAR ALSAID
 
Ekg Tutorial
Ekg TutorialEkg Tutorial
Ekg Tutorialwfrumkin
 
Streptokinase anaphylaxis
Streptokinase anaphylaxisStreptokinase anaphylaxis
Streptokinase anaphylaxisJoey Tabula
 
Electrocardiography
ElectrocardiographyElectrocardiography
ElectrocardiographyIshaShripad
 

Mais procurados (20)

Surviving Sepsis Campaign 2021.pptx.pdf
Surviving Sepsis Campaign 2021.pptx.pdfSurviving Sepsis Campaign 2021.pptx.pdf
Surviving Sepsis Campaign 2021.pptx.pdf
 
Coronary Blood Flow
Coronary Blood FlowCoronary Blood Flow
Coronary Blood Flow
 
TELMISARTAN.pptx
TELMISARTAN.pptxTELMISARTAN.pptx
TELMISARTAN.pptx
 
Cardiac action potential
Cardiac action potentialCardiac action potential
Cardiac action potential
 
Role of raas inhibition in management of hypertension
Role of raas inhibition in management of hypertensionRole of raas inhibition in management of hypertension
Role of raas inhibition in management of hypertension
 
Ppt recording on ecocardiogram
Ppt recording on ecocardiogramPpt recording on ecocardiogram
Ppt recording on ecocardiogram
 
ABPM-AMBULATORY BP MONITORING
ABPM-AMBULATORY BP MONITORINGABPM-AMBULATORY BP MONITORING
ABPM-AMBULATORY BP MONITORING
 
Sepsis guideline 2021.pptx
Sepsis guideline 2021.pptxSepsis guideline 2021.pptx
Sepsis guideline 2021.pptx
 
ecg 3.pptx
ecg 3.pptxecg 3.pptx
ecg 3.pptx
 
Arrhythmia.pdf
Arrhythmia.pdfArrhythmia.pdf
Arrhythmia.pdf
 
The funny current
The funny currentThe funny current
The funny current
 
Respiration by dr. mudassar
Respiration by dr. mudassarRespiration by dr. mudassar
Respiration by dr. mudassar
 
Fluid responsiveness in critically ill patients
Fluid responsiveness in critically ill patientsFluid responsiveness in critically ill patients
Fluid responsiveness in critically ill patients
 
Ambulatory blood pressure monitoring [abpm]
Ambulatory blood pressure monitoring [abpm]Ambulatory blood pressure monitoring [abpm]
Ambulatory blood pressure monitoring [abpm]
 
Fishing for Insights from Single-Lead and Multi-Lead ECG of Live Adult Zebrafish
Fishing for Insights from Single-Lead and Multi-Lead ECG of Live Adult ZebrafishFishing for Insights from Single-Lead and Multi-Lead ECG of Live Adult Zebrafish
Fishing for Insights from Single-Lead and Multi-Lead ECG of Live Adult Zebrafish
 
Pulse wave analysis
Pulse wave analysisPulse wave analysis
Pulse wave analysis
 
Ekg Tutorial
Ekg TutorialEkg Tutorial
Ekg Tutorial
 
Streptokinase anaphylaxis
Streptokinase anaphylaxisStreptokinase anaphylaxis
Streptokinase anaphylaxis
 
Cardiac arrythmias
Cardiac arrythmiasCardiac arrythmias
Cardiac arrythmias
 
Electrocardiography
ElectrocardiographyElectrocardiography
Electrocardiography
 

Semelhante a Experiment 1 and 2

Experiment 1 and 2
Experiment 1 and 2Experiment 1 and 2
Experiment 1 and 2Monkey_Toes
 
Experiments
ExperimentsExperiments
ExperimentsAshley
 
Ice exercise experiment2
Ice exercise experiment2Ice exercise experiment2
Ice exercise experiment2Monkey_Toes
 
Artifact 1 experiment 1 google drive
Artifact 1 experiment 1   google driveArtifact 1 experiment 1   google drive
Artifact 1 experiment 1 google driveMonkey_Toes
 
Experiment 1 and 2
Experiment 1 and 2Experiment 1 and 2
Experiment 1 and 2Monkey_Toes
 
Experiment 2 google drive
Experiment 2   google driveExperiment 2   google drive
Experiment 2 google driveMonkey_Toes
 
Experiment 2 google drive
Experiment 2   google driveExperiment 2   google drive
Experiment 2 google driveMonkey_Toes
 
Experiments 1 and 2
Experiments 1 and 2Experiments 1 and 2
Experiments 1 and 2hb0809
 
Experiments 1 and 2
Experiments 1 and 2Experiments 1 and 2
Experiments 1 and 2hb0809
 
Heart Rate Labs
Heart Rate LabsHeart Rate Labs
Heart Rate Labstabsaba
 
Experiemtn12 information
Experiemtn12 informationExperiemtn12 information
Experiemtn12 informationks0477bn
 
Experiemtn12 information
Experiemtn12 informationExperiemtn12 information
Experiemtn12 informationks0477bn
 
Experiment 1 & 2
Experiment 1 & 2Experiment 1 & 2
Experiment 1 & 2777notw777
 
Experiment 2
Experiment 2Experiment 2
Experiment 2ns0646bn
 
Hr.bp. exercise (1)
Hr.bp. exercise (1)Hr.bp. exercise (1)
Hr.bp. exercise (1)Shardae18
 
Experiment 2
Experiment 2Experiment 2
Experiment 2ns0646bn
 
Experiment 2
Experiment 2Experiment 2
Experiment 2Myikaa
 

Semelhante a Experiment 1 and 2 (20)

Experiment 1 and 2
Experiment 1 and 2Experiment 1 and 2
Experiment 1 and 2
 
Experiments
ExperimentsExperiments
Experiments
 
Ice exercise experiment2
Ice exercise experiment2Ice exercise experiment2
Ice exercise experiment2
 
Artifact 1 experiment 1 google drive
Artifact 1 experiment 1   google driveArtifact 1 experiment 1   google drive
Artifact 1 experiment 1 google drive
 
Experiment 1 and 2
Experiment 1 and 2Experiment 1 and 2
Experiment 1 and 2
 
Experiment 2 google drive
Experiment 2   google driveExperiment 2   google drive
Experiment 2 google drive
 
Experiment 2 google drive
Experiment 2   google driveExperiment 2   google drive
Experiment 2 google drive
 
Experiments 1 and 2
Experiments 1 and 2Experiments 1 and 2
Experiments 1 and 2
 
Experiments 1 and 2
Experiments 1 and 2Experiments 1 and 2
Experiments 1 and 2
 
Heart Rate Labs
Heart Rate LabsHeart Rate Labs
Heart Rate Labs
 
Experiemtn12 information
Experiemtn12 informationExperiemtn12 information
Experiemtn12 information
 
Experiemtn12 information
Experiemtn12 informationExperiemtn12 information
Experiemtn12 information
 
Experiment 1 & 2
Experiment 1 & 2Experiment 1 & 2
Experiment 1 & 2
 
Experiment 2
Experiment 2Experiment 2
Experiment 2
 
Exp 2
Exp 2Exp 2
Exp 2
 
Hr.bp. exercise (1)
Hr.bp. exercise (1)Hr.bp. exercise (1)
Hr.bp. exercise (1)
 
Experiment 2
Experiment 2Experiment 2
Experiment 2
 
Experiment 2
Experiment 2Experiment 2
Experiment 2
 
cardiac output
 cardiac output cardiac output
cardiac output
 
Cardiac output
Cardiac outputCardiac output
Cardiac output
 

Mais de Monkey_Toes

Lung volumes and_capacities
Lung volumes and_capacitiesLung volumes and_capacities
Lung volumes and_capacitiesMonkey_Toes
 
Lung volumes and_capacities
Lung volumes and_capacitiesLung volumes and_capacities
Lung volumes and_capacitiesMonkey_Toes
 
Ekg experiment 3
Ekg experiment 3Ekg experiment 3
Ekg experiment 3Monkey_Toes
 
Experiment 1 and 2
Experiment 1 and 2Experiment 1 and 2
Experiment 1 and 2Monkey_Toes
 
Did i do that artifact1
Did i do that artifact1Did i do that artifact1
Did i do that artifact1Monkey_Toes
 
Did i do that artifact1
Did i do that artifact1Did i do that artifact1
Did i do that artifact1Monkey_Toes
 
Numbers5to9 artifact
Numbers5to9 artifactNumbers5to9 artifact
Numbers5to9 artifactMonkey_Toes
 
What makes me nervous new
What makes me nervous newWhat makes me nervous new
What makes me nervous newMonkey_Toes
 
What makes me nervous 2
What makes me nervous 2What makes me nervous 2
What makes me nervous 2Monkey_Toes
 
What makes me nervous artifact
What makes me nervous artifactWhat makes me nervous artifact
What makes me nervous artifactMonkey_Toes
 
Whereisitartifact
WhereisitartifactWhereisitartifact
WhereisitartifactMonkey_Toes
 

Mais de Monkey_Toes (18)

Lung volumes and_capacities
Lung volumes and_capacitiesLung volumes and_capacities
Lung volumes and_capacities
 
Lung volumes and_capacities
Lung volumes and_capacitiesLung volumes and_capacities
Lung volumes and_capacities
 
Ekg lab
Ekg labEkg lab
Ekg lab
 
Ekg lab
Ekg labEkg lab
Ekg lab
 
Ekg experiment 3
Ekg experiment 3Ekg experiment 3
Ekg experiment 3
 
Blood typing
Blood typingBlood typing
Blood typing
 
Ekg lab 3
Ekg  lab 3Ekg  lab 3
Ekg lab 3
 
Experiment 1 and 2
Experiment 1 and 2Experiment 1 and 2
Experiment 1 and 2
 
Skelphysll
SkelphysllSkelphysll
Skelphysll
 
Skelphysll
SkelphysllSkelphysll
Skelphysll
 
Did i do that artifact1
Did i do that artifact1Did i do that artifact1
Did i do that artifact1
 
Did i do that artifact1
Did i do that artifact1Did i do that artifact1
Did i do that artifact1
 
Numbers5to9 artifact
Numbers5to9 artifactNumbers5to9 artifact
Numbers5to9 artifact
 
What makes me nervous new
What makes me nervous newWhat makes me nervous new
What makes me nervous new
 
What makes me nervous 2
What makes me nervous 2What makes me nervous 2
What makes me nervous 2
 
What makes me nervous artifact
What makes me nervous artifactWhat makes me nervous artifact
What makes me nervous artifact
 
Artifact 4
Artifact 4Artifact 4
Artifact 4
 
Whereisitartifact
WhereisitartifactWhereisitartifact
Whereisitartifact
 

Experiment 1 and 2

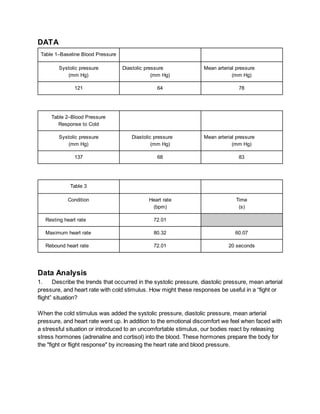
  • 1. DATA Table 1–Baseline Blood Pressure Systolic pressure Diastolic pressure Mean arterial pressure (mm Hg) (mm Hg) (mm Hg) 121 64 78 Table 2–Blood Pressure Response to Cold Systolic pressure Diastolic pressure Mean arterial pressure (mm Hg) (mm Hg) (mm Hg) 137 68 83 Table 3 Condition Heart rate Time (bpm) (s) Resting heart rate 72.01 Maximum heart rate 80.32 60.07 Rebound heart rate 72.01 20 seconds Data Analysis 1. Describe the trends that occurred in the systolic pressure, diastolic pressure, mean arterial pressure, and heart rate with cold stimulus. How might these responses be useful in a “fight or flight” situation? When the cold stimulus was added the systolic pressure, diastolic pressure, mean arterial pressure, and heart rate went up. In addition to the emotional discomfort we feel when faced with a stressful situation or introduced to an uncomfortable stimulus, our bodies react by releasing stress hormones (adrenaline and cortisol) into the blood. These hormones prepare the body for the "fight or flight response" by increasing the heart rate and blood pressure.
  • 2. 2. As a vital sign, blood pressure is an indicator of general health. A high blood pressure (140/90 or higher) increases the risk of cardiovascular disease and strokes. Collect the systolic and diastolic pressures for the class and calculate the average for each. Rate the class average blood pressure using the follow scale: Blood Pressure Category 140/90 or higher High 120–139/80–89 Pre-hypertension 119/79 or below Normal 114/69 - on average our class’s blood pressure is normal 3. How long after immersion did your heart rate reach its maximum value? Explain the physiologic mechanism that led to this change in heart rate. After about 20 seconds of submerging her foot into the ice water, Anna Lee’s heart rate reached its maximum value of 80.32 bpm. The physiologic mechanism that led to this change in heart rate was when her foot was submerged into the water there was decrease circulation to her foot, which caused stress. 4. Describe the changes in heart rate that occurred after the maximum value. How can you explain the minimum heart rate value? How would you explain the heart rate variations seen in the remainder of the experiment? After Anna Lee’s foot was submerged into the ice water her heart rate reached its maximum at 20 seconds. Her heart rate when resting, before submerging her foot, was 72.01 bpm. This would explain why 20 seconds after reaching her maximum heart rate it returned to 72.01 bpm. 5. How long after the maximum heart rate did it take to arrive at your rebound heart rate? What can you say about the relative speed of physiologic response to a stimulus vs. the speed of mechanisms that are designed to maintain homeostasis? After reaching the maximum heart rate was reached it took about 20 seconds to arrive at the rebound heart rate. 6. If the heart rate is too slow there is inadequate blood pressure to maintain perfusion to the brain. This can lead to loss of consciousness (fainting). Keeping in mind the autonomic nervous system responses that you observed in this experiment, explain the sequence of events that results in a severely frightened person fainting.
  • 3. DATA: Table 1–Baseline Blood Pressure Systolic pressure Diastolic pressure Mean arterial pressure Pulse (mm Hg) (mm Hg) (mm Hg) (bpm) 119 65 75 76 Table 2–Blood Pressure After Exercise Systolic pressure Diastolic pressure Mean arterial pressure Pulse (mm Hg) (mm Hg) (mm Hg) (bpm) 137 73 94 115 Table 3–Heart Rate Condition Resting heart rate (bpm) 97.01 Maximum heart rate (bpm) 154.8 Recovery time (s) 35 DATA ANALYSIS 1. Describe the trends that occurred in the systolic pressure, diastolic pressure, mean arterial pressure and pulse with exercise. Assume that the stroke volume increased from 75 mL/beat to 100 mL/beat. Use this information and the change in pulse with exercise to calculate the change in cardiac output (stroke volume × heart rate) that occurred per minute. -- The systolic pressure was higher than the diastolic pressure, mean arterial pressure, and pulse. The diastolic pressure and mean arterial pressure was around the same numbers. But the pulse became higher that it originally was on the baseline. The change in cardiac output is 5,800.
  • 4. 2. Pulse pressure is the difference between systolic pressure (peak pressure during active contraction of the ventricles) and diastolic pressure (the pressure that is maintained even while the left ventricle is relaxing). Describe the change in pulse pressure seen with exercise. Which component of the blood pressure is most responsible for this change? - your pulse pressure rises during exercise because your heart rate increases and you begin to breath harder. Cardiology is the component of the blood pressure that is the most responsible for the change of someone’s pulse pressure with exercise. 3. A change in pulse pressure can be seen in a variety of medical conditions. What would you expect to happen to the pulse pressure in the following examples? (a) In atherosclerosis there is a hardening of the arterial walls. - your pulse pressure widens. (b) A damaged aortic valve does not seal properly and allows blood to flow back into the ventricle during diastole. - Pulse pressure begins to fall when there is aortic valve insufficiency. 4. Normal resting heart rates range from 55−100 beats per minute. What was your/the subject’s resting heart rate? How much did your/the subject’s heart rate increase above resting rate with exercise? What percent increase was this? - The subjects resting heart rate was 76 bpm. The subjects heart rate increased by 39 bpm with exercise. The heart rate increased by 51%. 5. How does your/the subject’s maximum heart rate compare with other students in your group/class? Is this what you expected? Other students heart rates were pretty close to our subjects heart rate. I expected them to be about the same because all the subjects are the same age and were testing heart rate under the same conditions. 6. Recovery time has been shown to correlate with degree of physical fitness. How does your/the subject’s recovery rate compare to that of your classmates? Is this what you expected?
  • 5. -Our subjects’ recovery rate was slightly shorter than other groups because our subject is a softball player; therefor she is in better shape. This is the result that I expected because she works out more often than the subject in other groups. 7. Congestive heart failure is a condition in which the strength of contraction with each beat may be significantly reduced. For example, the ventricle may pump only half the usual volume of blood with each beat. Would you expect a person with congestive heart failure to have a faster or slower heart rate at rest? With exercise? -I would expect someone with congestive heart failure to have a faster heart rate both at rest and when exercising, because the muscle is not as powerful so the heart will have to pump more quickly to compensate for the loss in pressure. 8. Medications are available which can slow the heart or speed it up. If a patient complains of feeling poorly and has a heart rate of 120 beats per minute, should you administer a medicine to slow the rate? -Yes, you should attempt to slow the patients’ heart rate, because a normal heart rate should be between 50 and 100 at rest and the patients heart rate is at 120.