6Sigma
•
5 gostaram•1,334 visualizações

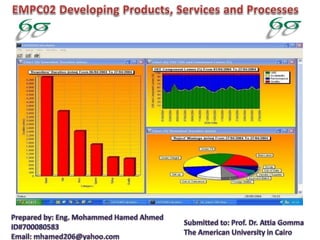
The document contains reliability data for various pieces of equipment from January to June. It shows the unplanned downtime, number of failures, total working hours, and calculated reliability percentage for each month. Additional charts show the unplanned maintenance downtime and downtime ratio for each month, with calculations to determine control limits. Root cause analysis was performed for main failures on a fan, identifying bearing issues as the primary cause. Recommendations are provided to shift to a more preventive maintenance approach through techniques like TPM to improve reliability.

Recomendados
Mais conteúdo relacionado
Mais procurados
Mais procurados (20)
Destaque
Destaque (20)
Semelhante a 6Sigma
Semelhante a 6Sigma (20)
Mais de Mohammed Hamed Ahmed Soliman
Mais de Mohammed Hamed Ahmed Soliman (20)
6Sigma
- 5. Month Unplanned Maintenance Downtime (hrs) No of failures Total working hrs Reliability % Jan-09 215 70 660 68.25 Feb-09 215.5 52 660 68.17 March-09 182.3 60 660 73.26 April-09 195 72 660 71.31 May-09 192 68 660 71.77 June-09 188.8 100 660 72.26 • Process Reliability=Available Time/Planned Time= total Working time-total downtime/total Working time-planned downtime. • Planned Downtime=8hrs/monthly.
- 6. Month Unplanned Maintenance Downtime (hr/month) Downtime ratio % Jan-09 215 32.57 Feb-09 217 32.87 March-09 181.3 27.46 April-09 194.5 29.64 May-09 192 29.09 June-09 188.8 28.60 Total 1188.6 (Range 27-33%) Average 198.1 30.03 Downtime Ratio=Total Downtime/Total Working Time
- 7. UCL = X’+3 sigma= 30.03+ 3x2.2 =36.63% LCL = X’ +3 sigma=30.03 - 3x2.2 =23.43% Lower Control Limit Upper Control Limit 27 28 29 30 31 32 33 34 0 1 2 3 4 5 6 7 DowntimeRatio% Months 36.63% 23.43% Standard Deviation σ = √∑(X-Mean)2 / n-1 =2.2 Mean (x’)= ∑X/n =30.03% 30.03%
- 8. Zone A Zone B Zone C X’ LCL UCL Zone C Eng. Mohammed Hamed X’+3σ X’+2σ X’+1σ X’-1σ X’-2σ X’-3σ 36.63 32.23 30.03% 27.83 25.63 23.43 34.43
- 10. Downtime Analysis Equip Code Problem Average Monthly Downtime (hr) Failure Frequency Weight % Classification 304K1 Centrifugal Fan 54.9 18 27% A 304T1 Bucket Elevator 38.5 22 19% A 304Z2 Granulator Drum 35 22 17% A 304WG1 Feed Belt Conveyor 27 15 13.5 B 304N3 Recycle Belt Conveyor 13.75 26 6.8% B 304F1 Bag Filter 12.95 11 6.4% B 304U1 Burner 6.5 7 3.2% C 304N7 Belt Conveyor 3.75 3 1.8% D 304N4 Belt Conveyor 3.5 3 1.7% D 304T2 Bucket Elevator 2.25 2 1.2% D Total 198.1 100%
- 11. ROOT CAUSE ANALYSIS for Main Failures
- 12. Level1 Level 2 Level 3 Level 4 Level 5 Level 6 Level 7 Level 8 Equip Fan K1 failure crack in the foundation bolts looseness poor maint Poor maint high vibration unbalance Process problem operation desgin poor maint misalignment Poor maint foundation supports problem poor maint high Vibration unbalance Process problem operation design Poor maint bearing noise Bearing wear bearing cocked high vibration misalignment Poor maint unbalance Process problem operation design Poor maint Sealing damage Spare parts reliability Poor maint B.housing problem Spare parts reliability Poor maint Lubrication problem Poor maint Incorrect lubricant Poor maint Insufficient lubricant Poor maint
- 13. Fan failure cause No of failures % of total Criticality MTBF (hrs) Bearing 10 55.5 A 66 High noise 4 22.2 B 180 Foundation cracks 2 11.11 B 360 B.housing 1 5.5 C 720 Sealing 1 5.5 C 270 MTBF=Total working time/total no of failures
- 14. Main Cause Priority Weight % Root Cause Vibration 70 Unbalance 40% Process 20% High Temp 15 Bad PM 10% Insufficient lubricant 5% Others 10 Training Greasing 5 Routine Maintenance 2.5% Bad lubricant type 2.5% What cause defect? High Temp Others VibrationGreasing Unbalance Eng. Mohammed Hamed Routine Maintenance Bad lubricant type Process
- 16. Failure mode Failure cause Source of failure Root cause Failure characteristics Failure Effect Maintenance System Fan operate with high vibration level Bearing fails Bearing seized Poor Maint Wear in&out High maintenance cost Unexpected plant shutdown Housing wear Deterioration Poor Maint Wear in&out High maintenance cost Unexpected plant shutdown Unbalance fan blade Shaft wear Poor Maint Wear in&out High maintenance cost Unexpected plant shutdown Looseness in foundation Poor Maint Wear in&out High maintenance cost Unexpected plant shutdown Shaft wear Deterioration Poor Maint Wear in&out High maintenance cost Unexpected plant shutdown
- 17. The Fan Equip is Critical Grade A….why? Company’s priorities Fan Equip
- 19. Inspection Sheet Sample: Check Sheet for PM Maintenance Sector (C) Part has been adjusted and working fine )Ф(Part is working but with problem (O)Part working good (X( part require maintenance or change فحصه المراد البند تاريخ وساعه الفحص 1May 2May 3May 4May 5May 6May Fan K1 Check vibration Check Temp Check Grease Level Check all bolts & nuts Clean the fan blade Grease the bearing Visual inspection (noise, leakage..etc) Notes Signature
- 20. Routine Maintenance Checklists Cleaning Visual Inspection Tighten Bolts & Nuts Adjusting Greasing & Oiling Overall Equipment Test
- 21. Advantages of Checklists Checklists or routine maintenance planning: Policy Routine Maintenance Level Duration (hr) Required Labor Routine Maintenance Check Vibration Daily 1 2 Check Temp Check Grease Level Check all bolts & nuts Clean the fan blade Visual inspect (check for noise, leakage, seals condition…etc To be done during the daily shutdown
- 22. What is Preventive Maintenance (PM)? Perform maintenance in a specific part of the equipment whether the equipment need it or not in a specific time period.
- 23. TPM Maximize your resources usage. Make all feel about the importance of the maintenance. Reduce gap between production & maintenance teams. TPM Benefits:
- 24. Total Productive Maintenance (TPM) is the maintenance sub- system of Lean Manufacturing. TPM improves manufacturing performance by reducing cost, improving quality and increasing productivity.
- 27. A useful 5S tools to be used with maintenance & production Red Tag Can be Used as a useful tool to apply the 5S in maintenance Illustrate equip status illustrate what type of maintenance done today Red Tag is Called the Silent Talker
- 28. 1) Check the job description and the organization chart. 2) Check the working procedures in place. 3) Calibration process( as the auditee to explain the calibration process). 4) Check if there is calibration procedure in place. 5) Check the equipment calibration list. 6) Ask the auditee about the input and out put of the calibration process. 7) Check if there is a system for ensuring the competency of maintenance personnel. 8) Check if the maintenance personnel will be provided with special training. 9) Ask the auditee to describe the process of the preventive maintenance. 10)Check if there is a preventive maintenance plan.
- 29. 11)Check the bases for determining the extent and frequency of maintenance tasks. 12)Ask the planner to describe the process of planning. 13)Check who is responsible for planning of the preventive maintenance works. 14)Check the code structure of the work orders.
- 30. Maintenance Policy Ideal Asfour Now Reactive 10% 50% Preventive 25-35% 50% Predictive 45-55% 0% Proactive Balance 0% “Reliability Magazines Report” Worse Maintenance Policy “fix when it broke down” Eng. Mohammed Hamed Target should be reducing reactive & increase planned maintenance
- 32. Japan called it Fire Fighting FF JAPAN Consider it the worst maintenance policy in the world!!
- 33. More than 50% of Maintenance work is considered as Reactive. Reactive or corrective maintenance has negative effect on the system, resources, and equipments.
- 34. Best case Performance Analysis
- 35. Mean Time Between Failure Best Condition (Manufacturer) MTBF Reliable Bearing 2160 Worst Condition MTBF Current Bearing 66 If we managed to achieve the manufacturer rate this will reduce the downtime average to 170.65hrs instead of 198.1
- 36. Zone A Zone B Zone C X’ LCL UCL Zone C Eng. Mohammed Hamed X’+3σ X’+2σ X’+1σ X’-1σ X’-2σ X’-3σ 36.63 32.23 30.03% 27.83 25.63 23.43 34.43 170/660= 25.75% (In the Excellent Area).
- 37. Change Management Changing the maintenance team & production labor’s culture from reactive to preventive & proactive policies. Give training to the maintenance technicians & to the operators. Applying the TPM will reduce the resources required to do the routine maintenance.
- 38. RECOMMENDATIONS
- 39. A POWERFUL FACTORY Prepared by: Eng. Mohammed Hamed Email: mhamed206@yahoo.com