SlideShare uma empresa Scribd logo
1 de 10
1
TIME SERIES ANALYSIS
Time series analysis is a specific way of analysing a sequence of data points collected
over an interval of time. In time series analysis, analysts record data points at consistent
intervals over a set period of time rather than just recording the data points intermittently or
randomly. However, this type of analysis is not merely the act of collecting data over time.
What sets time series data apart from other data is that the analysis can show how
variables change over time. In other words, time is a crucial variable because it shows how the
data adjusts over the course of the data points as well as the final results. It provides an
additional source of information and a set order of dependencies between the data.
Time series analysis typically requires a large number of data points to ensure
consistency and reliability. An extensive data set ensures you have a representative sample size
and that analysis can cut through noisy data. It also ensures that any trends or patterns
discovered are not outliers and can account for seasonal variance. Additionally, time series data
can be used for forecasting—predicting future data based on historical data.
Time series analysis helps organizations understand the underlying causes of trends or
systemic patterns over time. Using data visualizations, business users can see seasonal trends
and dig deeper into why these trends occur. With modern analytics platforms, these
visualizations can go far beyond line graphs.
When organizations analyze data over consistent intervals, they can also use time series
forecasting to predict the likelihood of future events. Time series forecasting is part
of predictive analytics. It can show likely changes in the data, like seasonality or cyclic
behaviour, which provides a better understanding of data variables and helps forecast better.
For example, Des Moines Public Schools analyzed five years of student achievement
data to identify at-risk students and track progress over time. Today’s technology allows us to
collect massive amounts of data every day and it’s easier than ever to gather enough consistent
data for comprehensive analysis.
2
Time series analysis is used for non-stationary data—things that are constantly
fluctuating over time or are affected by time.
Industries like finance, retail, and economics frequently use time series analysis because
currency and sales are always changing. Stock market analysis is an excellent example of time
series analysis in action, especially with automated trading algorithms. Likewise, time series
analysis is ideal for forecasting weather changes, helping meteorologists predict everything
from tomorrow’s weather report to future years of climate change. Examples of time series
analysis in action include:
 Weather data
 Rainfall measurements
 Temperature readings
 Heart rate monitoring (EKG)
 Brain monitoring (EEG)
 Quarterly sales
 Stock prices
 Automated stock trading
 Industry forecasts
3
BASIC OBJECTIVES OF TIME SERIES ANALYSIS
The basic objective usually is to determine a model that describes the pattern of the time
series. Uses for such a model are:
1. To describe the important features of the time series pattern.
2. To explain how the past affects the future or how two time series can “interact”.
3. To forecast future values of the series.
4. To possibly serve as a control standard for a variable that measures the quality of
product in some manufacturing situations.
IMPORTANT CHARACTERISTICS TO CONSIDER
Some important questions to first consider when first looking at a time series are:
 Is there a trend, meaning that, on average, the measurements tend to increase (or
decrease) over time?
 Is there seasonality, meaning that there is a regularly repeating pattern of highs and
lows related to calendar time such as seasons, quarters, months, days of the week, and
so on?
 Are there outliers? In regression, outliers are far away from your line. With time series
data, your outliers are far away from your other data.
 Is there a long-run cycle or period unrelated to seasonality factors?
 Is there constant variance over time, or is the variance non-constant?
 Are there any abrupt changes to either the level of the series or the variance?
TIME SERIES ANALYSIS TYPES
Because time series analysis includes many categories or variations of data, analysts sometimes
must make complex models. However, analysts can’t account for all variances, and they can’t
generalize a specific model to every sample. Models that are too complex or that try to do too
many things can lead to a lack of fit. Lack of fit or overfitting models lead to those models not
distinguishing between random error and true relationships, leaving analysis skewed and
forecasts incorrect.
4
Models of time series analysis include:
 Classification: Identifies and assigns categories to the data.
 Curve fitting: Plots the data along a curve to study the relationships of variables within
the data.
 Descriptive analysis: Identifies patterns in time series data, like trends, cycles, or
seasonal variation.
 Explanative analysis: Attempts to understand the data and the relationships within it,
as well as cause and effect.
 Exploratory analysis: Highlights the main characteristics of the time series data,
usually in a visual format.
 Forecasting: Predicts future data. This type is based on historical trends. It uses the
historical data as a model for future data, predicting scenarios that could happen along
future plot points.
 Intervention analysis: Studies how an event can change the data.
 Segmentation: Splits the data into segments to show the underlying properties of the
source information.
DATA CLASSIFICATION
Further, time series data can be classified into two main categories:
 Stock time series data means measuring attributes at a certain point in time, like a
static snapshot of the information as it was.
 Flow time series data means measuring the activity of the attributes over a certain
period, which is generally part of the total whole and makes up a portion of the results.
5
DATA VARIATIONS
In time series data, variations can occur sporadically throughout the data:
 Functional analysis can pick out the patterns and relationships within the data to
identify notable events.
 Trend analysis means determining consistent movement in a certain direction. There
are two types of trends: deterministic, where we can find the underlying cause, and
stochastic, which is random and unexplainable.
 Seasonal variation describes events that occur at specific and regular intervals during
the course of a year. Serial dependence occurs when data points close together in time
tend to be related.
Time series analysis and forecasting models must define the types of data relevant to
answering the business question. Once analysts have chosen the relevant data they want to
analyse, they choose what types of analysis and techniques are the best fit.
IMPORTANT CONSIDERATIONS FOR TIME SERIES ANALYSIS
While time series data is data collected over time, there are different types of data that
describe how and when that time data was recorded. For example:
 Time series data is data that is recorded over consistent intervals of time.
 Cross-sectional data consists of several variables recorded at the same time.
 Pooled data is a combination of both time series data and cross-sectional data.
TIME SERIES DATA DEFINITION
Time series data is a collection of observations (behaviour) for a single
subject (entity) at different time intervals (generally equally spaced as in the case of metrics,
or unequally spaced as in the case of events).
6
For example: Max Temperature, Humidity and Wind (all three behaviours) in New
York City (single entity) collected on First day of every year (multiple intervals of time) The
relevance of time as an axis makes time series data distinct from other types of data.
CROSS-SECTIONAL DATA DEFINITION
Cross-sectional data is a collection of observations (behaviour) for multiple
subjects (entities such as different individuals or groups) at a single point in time. For
example: Max Temperature, Humidity and Wind (all three behaviours) in New York City,
SFO, Boston, Chicago (multiple entities) on 1/1/2015 (single instance)
In cross-sectional studies, there is no natural ordering of the observations (e.g.,
explaining people’s wages by reference to their respective education levels, where the
individuals’ data could be entered in any order). For example: the closing price of a group of
50 stocks at a given moment in time, an inventory of a given product in stock at a specific store,
and a list of grades obtained by a class of students on a given exam.
PANEL DATA (LONGITUDINAL DATA) DEFINITION
Panel data is usually called as cross-sectional time series data as it is a combination of the
above- mentioned types (i.e., collection of observations for multiple subjects at multiple
instances).
Panel data or longitudinal data is multi-dimensional data involving measurements over time.
Panel data contains observations of multiple phenomena obtained over multiple time periods
for the same firms or individuals. A study that uses panel data is called a longitudinal study or
panel study.
For example: Max Temperature, Humidity and Wind (all three behaviours) in New York City,
SFO, Boston, Chicago (multiple entities) on the first day of every year (multiple intervals of
time).
DIFFERENCES BETWEEN THE THREE DATA TYPES
Based on the above definitions and examples, let’s recap the differences between the three data
types:
7
1. A time series is a group of observations on a single entity over time — e.g., the
daily closing prices over one year for a single financial security, or a single
patient’s heart rate measured every minute over a one-hour procedure.
2. A cross-section is a group of observations of multiple entities at a single time
— e.g., today’s closing prices for each of the S&P 500 companies, or the heart
rates of 100 patients at the beginning of the same procedure.
3. If your data is organized in both dimensions — e.g., daily closing prices over
one year for 500 companies — then you have panel data.
TIME SERIES ANALYSIS MODELS AND TECHNIQUES
Just as there are many types and models, there are also a variety of methods to study data.
Here are the three most common.
 Box-Jenkins ARIMA models: These univariate models are used to better understand
a single time-dependent variable, such as temperature over time, and to predict future
data points of variables. These models work on the assumption that the data is
stationary. Analysts have to account for and remove as many differences and
seasonality in past data points as they can. The ARIMA model includes terms to
account for moving averages, seasonal difference operators, and autoregressive terms
within the model.
 Box-Jenkins Multivariate Models: Multivariate models are used to analyse more than
one time-dependent variable, such as temperature and humidity, over time.
 Holt-Winters Method: The Holt-Winters method is an exponential smoothing
technique. It is designed to predict outcomes, provided that the data points include
seasonality
The following plot is a time series plot of the annual number of earthquakes in the world with
seismic magnitude over 7.0, for 99 consecutive years. By a time series plot, we simply mean
that the variable is plotted against time.
8
Some features of the plot:
 There is no consistent trend (upward or downward) over the entire time span. The
series appears to slowly wander up and down. The horizontal line drawn at
quakes = 20.2 indicates the mean of the series. Notice that the series tends to stay on
the same side of the mean (above or below) for a while and then wanders to the other
side.
 Almost by definition, there is no seasonality as the data are annual data.
 There are no obvious outliers.
 It’s difficult to judge whether the variance is constant or not.
One of the simplest ARIMA type models is a model in which we use a linear model to
predict the value at the present time using the value at the previous time. This is called an AR(1)
model, standing for autoregressive model of order 1. The order of the model indicates how
many previous times we use to predict the present time.
TYPES OF TIME SERIES DATA
Time series data can be classified into two types:
 Measurements gathered at regular time intervals (metrics)
 Measurements gathered at irregular time intervals (events)
9
A time series data example can be any information sequence that was taken at specific
time intervals (whether regular or irregular). Common data examples could be anything from
heart rate to the unit price of store goods.
LINEAR VS. NONLINEAR TIME SERIES DATA
A linear time series is one where, for each data point Xt, that data point can be viewed as a
linear combination of past or future values or differences. Nonlinear time series are generated
by nonlinear dynamic equations. They have features that cannot be modelled by linear
processes: time-changing variance, asymmetric cycles, higher-moment structures, thresholds
and breaks. Here are some important considerations when working with linear and nonlinear
time series data:
 If a regression equation doesn’t follow the rules for a linear model, then it
must be a nonlinear model.
 Nonlinear regression can fit an enormous variety of curves.
 The defining characteristic for both types of models the functional forms.
IDENTIFYING TIME SERIES DATA
Time series data is unique in that it has a natural time order: the order in which the data was
observed matters. The key difference with time series data from regular data is that you’re
10
always asking questions about it over time. An often-simple way to determine if the dataset
you are working with is time series or not, is to see if one of your axes is time.
TIME SERIES CONSIDERATIONS
Immutability – Since time series data comes in time order, it is almost always recorded in a
new entry, and as such, should be immutable and append-only (appended to the existing data).
It doesn’t usually change but is rather tacked on in the order that events happen. This property
distinguishes time series data from relational data which is usually mutable and is stored in
relational databases that do online transaction processing, where rows in databases are updated
as the transactions are run and more or less randomly; taking an order for an existing customer,
for instance, updates the customer table to add items purchased and also updates the inventory
table to show that they are no longer available for sale.
The fact that time series data is ordered makes it unique in the data space because it
often displays serial dependence. Serial dependence occurs when the value of a datapoint at
one time is statistically dependent on another datapoint in another time (read “Autocorrelation
in Time Series Data” for a detailed explanation about this topic).
Though there are no events that exist outside of time, there are events where time isn’t
relevant. Time series data isn’t simply about things that happen in chronological order — it’s
about events whose value increases when you add time as an axis. Time series data sometimes
exists at high levels of granularity, as frequently as microseconds or even nanoseconds.
With time series data, change over time is everything.
*************************************************

Mais conteĂșdo relacionado

Semelhante a TIME SERIES ANALYSIS.docx

Research Demo for Showing Preparation for First Try
Research Demo for Showing Preparation for First TryResearch Demo for Showing Preparation for First Try
Research Demo for Showing Preparation for First Tryivantan8983
 
The Research Process.ppt
The Research Process.pptThe Research Process.ppt
The Research Process.pptDaniel Mamo
 
Mining Transactional and Time Series Data
Mining Transactional and Time Series DataMining Transactional and Time Series Data
Mining Transactional and Time Series DataBrenda Wolfe
 
SDTM (Study Data Tabulation Model)
SDTM (Study Data Tabulation Model)SDTM (Study Data Tabulation Model)
SDTM (Study Data Tabulation Model)SWAROOP KUMAR K
 
WAL_HUMN6100_08_A_EN-CC.mp4.docx
WAL_HUMN6100_08_A_EN-CC.mp4.docxWAL_HUMN6100_08_A_EN-CC.mp4.docx
WAL_HUMN6100_08_A_EN-CC.mp4.docxjessiehampson
 
Module 3 - Time Series.pptx
Module 3 - Time Series.pptxModule 3 - Time Series.pptx
Module 3 - Time Series.pptxnikshaikh786
 
Time Series FORECASTING
Time Series FORECASTINGTime Series FORECASTING
Time Series FORECASTINGVarun Khandelwal
 
Weather forecasting model.pptx
Weather forecasting model.pptxWeather forecasting model.pptx
Weather forecasting model.pptxVisheshYadav12
 
Chapter-Four.pdf
Chapter-Four.pdfChapter-Four.pdf
Chapter-Four.pdfSolomonNeway1
 
Time Series Analysis: Theory and Practice
Time Series Analysis: Theory and PracticeTime Series Analysis: Theory and Practice
Time Series Analysis: Theory and PracticeTetiana Ivanova
 
Data Analysis, Presentation and Interpretation of Data
Data Analysis, Presentation and Interpretation of DataData Analysis, Presentation and Interpretation of Data
Data Analysis, Presentation and Interpretation of DataRoqui Malijan
 
Time Series Analysis: Techniques for Analyzing Time-Dependent Data
Time Series Analysis: Techniques for Analyzing Time-Dependent DataTime Series Analysis: Techniques for Analyzing Time-Dependent Data
Time Series Analysis: Techniques for Analyzing Time-Dependent DataUncodemy
 
Introduction Q Ti A
Introduction  Q Ti AIntroduction  Q Ti A
Introduction Q Ti AZoha Qureshi
 
unit 4 deta analysis bbaY Dr kanchan.pptx
unit 4 deta analysis bbaY Dr kanchan.pptxunit 4 deta analysis bbaY Dr kanchan.pptx
unit 4 deta analysis bbaY Dr kanchan.pptxProf. Kanchan Kumari
 
unit 4 deta analysis bbaY Dr kanchan.pptx
unit 4 deta analysis bbaY Dr kanchan.pptxunit 4 deta analysis bbaY Dr kanchan.pptx
unit 4 deta analysis bbaY Dr kanchan.pptxProf. Kanchan Kumari
 

Semelhante a TIME SERIES ANALYSIS.docx (20)

Research Demo for Showing Preparation for First Try
Research Demo for Showing Preparation for First TryResearch Demo for Showing Preparation for First Try
Research Demo for Showing Preparation for First Try
 
The Research Process.ppt
The Research Process.pptThe Research Process.ppt
The Research Process.ppt
 
Time series slideshare
Time series slideshareTime series slideshare
Time series slideshare
 
Mining Transactional and Time Series Data
Mining Transactional and Time Series DataMining Transactional and Time Series Data
Mining Transactional and Time Series Data
 
SDTM (Study Data Tabulation Model)
SDTM (Study Data Tabulation Model)SDTM (Study Data Tabulation Model)
SDTM (Study Data Tabulation Model)
 
WAL_HUMN6100_08_A_EN-CC.mp4.docx
WAL_HUMN6100_08_A_EN-CC.mp4.docxWAL_HUMN6100_08_A_EN-CC.mp4.docx
WAL_HUMN6100_08_A_EN-CC.mp4.docx
 
Demand forecasting
Demand forecastingDemand forecasting
Demand forecasting
 
Module 3 - Time Series.pptx
Module 3 - Time Series.pptxModule 3 - Time Series.pptx
Module 3 - Time Series.pptx
 
Time Series FORECASTING
Time Series FORECASTINGTime Series FORECASTING
Time Series FORECASTING
 
Weather forecasting model.pptx
Weather forecasting model.pptxWeather forecasting model.pptx
Weather forecasting model.pptx
 
Chapter-Four.pdf
Chapter-Four.pdfChapter-Four.pdf
Chapter-Four.pdf
 
Panel slides
Panel slidesPanel slides
Panel slides
 
Time Series Analysis: Theory and Practice
Time Series Analysis: Theory and PracticeTime Series Analysis: Theory and Practice
Time Series Analysis: Theory and Practice
 
Data Analysis, Presentation and Interpretation of Data
Data Analysis, Presentation and Interpretation of DataData Analysis, Presentation and Interpretation of Data
Data Analysis, Presentation and Interpretation of Data
 
Time Series Analysis: Techniques for Analyzing Time-Dependent Data
Time Series Analysis: Techniques for Analyzing Time-Dependent DataTime Series Analysis: Techniques for Analyzing Time-Dependent Data
Time Series Analysis: Techniques for Analyzing Time-Dependent Data
 
Hrm1
Hrm1Hrm1
Hrm1
 
Introduction Q Ti A
Introduction  Q Ti AIntroduction  Q Ti A
Introduction Q Ti A
 
unit 4 deta analysis bbaY Dr kanchan.pptx
unit 4 deta analysis bbaY Dr kanchan.pptxunit 4 deta analysis bbaY Dr kanchan.pptx
unit 4 deta analysis bbaY Dr kanchan.pptx
 
unit 4 deta analysis bbaY Dr kanchan.pptx
unit 4 deta analysis bbaY Dr kanchan.pptxunit 4 deta analysis bbaY Dr kanchan.pptx
unit 4 deta analysis bbaY Dr kanchan.pptx
 
Research Design
Research Design Research Design
Research Design
 

Último

Booking open Available Pune Call Girls Koregaon Park 6297143586 Call Hot Ind...
Booking open Available Pune Call Girls Koregaon Park  6297143586 Call Hot Ind...Booking open Available Pune Call Girls Koregaon Park  6297143586 Call Hot Ind...
Booking open Available Pune Call Girls Koregaon Park 6297143586 Call Hot Ind...Call Girls in Nagpur High Profile
 
Thermal Engineering -unit - III & IV.ppt
Thermal Engineering -unit - III & IV.pptThermal Engineering -unit - III & IV.ppt
Thermal Engineering -unit - III & IV.pptDineshKumar4165
 
Double Revolving field theory-how the rotor develops torque
Double Revolving field theory-how the rotor develops torqueDouble Revolving field theory-how the rotor develops torque
Double Revolving field theory-how the rotor develops torqueBhangaleSonal
 
Thermal Engineering-R & A / C - unit - V
Thermal Engineering-R & A / C - unit - VThermal Engineering-R & A / C - unit - V
Thermal Engineering-R & A / C - unit - VDineshKumar4165
 
Navigating Complexity: The Role of Trusted Partners and VIAS3D in Dassault Sy...
Navigating Complexity: The Role of Trusted Partners and VIAS3D in Dassault Sy...Navigating Complexity: The Role of Trusted Partners and VIAS3D in Dassault Sy...
Navigating Complexity: The Role of Trusted Partners and VIAS3D in Dassault Sy...Arindam Chakraborty, Ph.D., P.E. (CA, TX)
 
KubeKraft presentation @CloudNativeHooghly
KubeKraft presentation @CloudNativeHooghlyKubeKraft presentation @CloudNativeHooghly
KubeKraft presentation @CloudNativeHooghlysanyuktamishra911
 
Design For Accessibility: Getting it right from the start
Design For Accessibility: Getting it right from the startDesign For Accessibility: Getting it right from the start
Design For Accessibility: Getting it right from the startQuintin Balsdon
 
Call Now ≜ 9953056974 â‰ŒđŸ” Call Girls In New Ashok Nagar â‰ŒđŸ” Delhi door step de...
Call Now ≜ 9953056974 â‰ŒđŸ” Call Girls In New Ashok Nagar  â‰ŒđŸ” Delhi door step de...Call Now ≜ 9953056974 â‰ŒđŸ” Call Girls In New Ashok Nagar  â‰ŒđŸ” Delhi door step de...
Call Now ≜ 9953056974 â‰ŒđŸ” Call Girls In New Ashok Nagar â‰ŒđŸ” Delhi door step de...9953056974 Low Rate Call Girls In Saket, Delhi NCR
 
Top Rated Pune Call Girls Budhwar Peth ⟟ 6297143586 ⟟ Call Me For Genuine Se...
Top Rated  Pune Call Girls Budhwar Peth ⟟ 6297143586 ⟟ Call Me For Genuine Se...Top Rated  Pune Call Girls Budhwar Peth ⟟ 6297143586 ⟟ Call Me For Genuine Se...
Top Rated Pune Call Girls Budhwar Peth ⟟ 6297143586 ⟟ Call Me For Genuine Se...Call Girls in Nagpur High Profile
 
FULL ENJOY Call Girls In Mahipalpur Delhi Contact Us 8377877756
FULL ENJOY Call Girls In Mahipalpur Delhi Contact Us 8377877756FULL ENJOY Call Girls In Mahipalpur Delhi Contact Us 8377877756
FULL ENJOY Call Girls In Mahipalpur Delhi Contact Us 8377877756dollysharma2066
 
Intze Overhead Water Tank Design by Working Stress - IS Method.pdf
Intze Overhead Water Tank  Design by Working Stress - IS Method.pdfIntze Overhead Water Tank  Design by Working Stress - IS Method.pdf
Intze Overhead Water Tank Design by Working Stress - IS Method.pdfSuman Jyoti
 
Intro To Electric Vehicles PDF Notes.pdf
Intro To Electric Vehicles PDF Notes.pdfIntro To Electric Vehicles PDF Notes.pdf
Intro To Electric Vehicles PDF Notes.pdfrs7054576148
 
VIP Call Girls Palanpur 7001035870 Whatsapp Number, 24/07 Booking
VIP Call Girls Palanpur 7001035870 Whatsapp Number, 24/07 BookingVIP Call Girls Palanpur 7001035870 Whatsapp Number, 24/07 Booking
VIP Call Girls Palanpur 7001035870 Whatsapp Number, 24/07 Bookingdharasingh5698
 
Call Girls in Ramesh Nagar Delhi 💯 Call Us 🔝9953056974 🔝 Escort Service
Call Girls in Ramesh Nagar Delhi 💯 Call Us 🔝9953056974 🔝 Escort ServiceCall Girls in Ramesh Nagar Delhi 💯 Call Us 🔝9953056974 🔝 Escort Service
Call Girls in Ramesh Nagar Delhi 💯 Call Us 🔝9953056974 🔝 Escort Service9953056974 Low Rate Call Girls In Saket, Delhi NCR
 
CCS335 _ Neural Networks and Deep Learning Laboratory_Lab Complete Record
CCS335 _ Neural Networks and Deep Learning Laboratory_Lab Complete RecordCCS335 _ Neural Networks and Deep Learning Laboratory_Lab Complete Record
CCS335 _ Neural Networks and Deep Learning Laboratory_Lab Complete RecordAsst.prof M.Gokilavani
 
chapter 5.pptx: drainage and irrigation engineering
chapter 5.pptx: drainage and irrigation engineeringchapter 5.pptx: drainage and irrigation engineering
chapter 5.pptx: drainage and irrigation engineeringmulugeta48
 
VIP Model Call Girls Kothrud ( Pune ) Call ON 8005736733 Starting From 5K to ...
VIP Model Call Girls Kothrud ( Pune ) Call ON 8005736733 Starting From 5K to ...VIP Model Call Girls Kothrud ( Pune ) Call ON 8005736733 Starting From 5K to ...
VIP Model Call Girls Kothrud ( Pune ) Call ON 8005736733 Starting From 5K to ...SUHANI PANDEY
 
ONLINE FOOD ORDER SYSTEM PROJECT REPORT.pdf
ONLINE FOOD ORDER SYSTEM PROJECT REPORT.pdfONLINE FOOD ORDER SYSTEM PROJECT REPORT.pdf
ONLINE FOOD ORDER SYSTEM PROJECT REPORT.pdfKamal Acharya
 

Último (20)

Booking open Available Pune Call Girls Koregaon Park 6297143586 Call Hot Ind...
Booking open Available Pune Call Girls Koregaon Park  6297143586 Call Hot Ind...Booking open Available Pune Call Girls Koregaon Park  6297143586 Call Hot Ind...
Booking open Available Pune Call Girls Koregaon Park 6297143586 Call Hot Ind...
 
Thermal Engineering -unit - III & IV.ppt
Thermal Engineering -unit - III & IV.pptThermal Engineering -unit - III & IV.ppt
Thermal Engineering -unit - III & IV.ppt
 
Double Revolving field theory-how the rotor develops torque
Double Revolving field theory-how the rotor develops torqueDouble Revolving field theory-how the rotor develops torque
Double Revolving field theory-how the rotor develops torque
 
Thermal Engineering-R & A / C - unit - V
Thermal Engineering-R & A / C - unit - VThermal Engineering-R & A / C - unit - V
Thermal Engineering-R & A / C - unit - V
 
Navigating Complexity: The Role of Trusted Partners and VIAS3D in Dassault Sy...
Navigating Complexity: The Role of Trusted Partners and VIAS3D in Dassault Sy...Navigating Complexity: The Role of Trusted Partners and VIAS3D in Dassault Sy...
Navigating Complexity: The Role of Trusted Partners and VIAS3D in Dassault Sy...
 
KubeKraft presentation @CloudNativeHooghly
KubeKraft presentation @CloudNativeHooghlyKubeKraft presentation @CloudNativeHooghly
KubeKraft presentation @CloudNativeHooghly
 
Design For Accessibility: Getting it right from the start
Design For Accessibility: Getting it right from the startDesign For Accessibility: Getting it right from the start
Design For Accessibility: Getting it right from the start
 
Cara Menggugurkan Sperma Yang Masuk Rahim Biyar Tidak Hamil
Cara Menggugurkan Sperma Yang Masuk Rahim Biyar Tidak HamilCara Menggugurkan Sperma Yang Masuk Rahim Biyar Tidak Hamil
Cara Menggugurkan Sperma Yang Masuk Rahim Biyar Tidak Hamil
 
Call Now ≜ 9953056974 â‰ŒđŸ” Call Girls In New Ashok Nagar â‰ŒđŸ” Delhi door step de...
Call Now ≜ 9953056974 â‰ŒđŸ” Call Girls In New Ashok Nagar  â‰ŒđŸ” Delhi door step de...Call Now ≜ 9953056974 â‰ŒđŸ” Call Girls In New Ashok Nagar  â‰ŒđŸ” Delhi door step de...
Call Now ≜ 9953056974 â‰ŒđŸ” Call Girls In New Ashok Nagar â‰ŒđŸ” Delhi door step de...
 
Top Rated Pune Call Girls Budhwar Peth ⟟ 6297143586 ⟟ Call Me For Genuine Se...
Top Rated  Pune Call Girls Budhwar Peth ⟟ 6297143586 ⟟ Call Me For Genuine Se...Top Rated  Pune Call Girls Budhwar Peth ⟟ 6297143586 ⟟ Call Me For Genuine Se...
Top Rated Pune Call Girls Budhwar Peth ⟟ 6297143586 ⟟ Call Me For Genuine Se...
 
FULL ENJOY Call Girls In Mahipalpur Delhi Contact Us 8377877756
FULL ENJOY Call Girls In Mahipalpur Delhi Contact Us 8377877756FULL ENJOY Call Girls In Mahipalpur Delhi Contact Us 8377877756
FULL ENJOY Call Girls In Mahipalpur Delhi Contact Us 8377877756
 
Intze Overhead Water Tank Design by Working Stress - IS Method.pdf
Intze Overhead Water Tank  Design by Working Stress - IS Method.pdfIntze Overhead Water Tank  Design by Working Stress - IS Method.pdf
Intze Overhead Water Tank Design by Working Stress - IS Method.pdf
 
Intro To Electric Vehicles PDF Notes.pdf
Intro To Electric Vehicles PDF Notes.pdfIntro To Electric Vehicles PDF Notes.pdf
Intro To Electric Vehicles PDF Notes.pdf
 
VIP Call Girls Palanpur 7001035870 Whatsapp Number, 24/07 Booking
VIP Call Girls Palanpur 7001035870 Whatsapp Number, 24/07 BookingVIP Call Girls Palanpur 7001035870 Whatsapp Number, 24/07 Booking
VIP Call Girls Palanpur 7001035870 Whatsapp Number, 24/07 Booking
 
NFPA 5000 2024 standard .
NFPA 5000 2024 standard                                  .NFPA 5000 2024 standard                                  .
NFPA 5000 2024 standard .
 
Call Girls in Ramesh Nagar Delhi 💯 Call Us 🔝9953056974 🔝 Escort Service
Call Girls in Ramesh Nagar Delhi 💯 Call Us 🔝9953056974 🔝 Escort ServiceCall Girls in Ramesh Nagar Delhi 💯 Call Us 🔝9953056974 🔝 Escort Service
Call Girls in Ramesh Nagar Delhi 💯 Call Us 🔝9953056974 🔝 Escort Service
 
CCS335 _ Neural Networks and Deep Learning Laboratory_Lab Complete Record
CCS335 _ Neural Networks and Deep Learning Laboratory_Lab Complete RecordCCS335 _ Neural Networks and Deep Learning Laboratory_Lab Complete Record
CCS335 _ Neural Networks and Deep Learning Laboratory_Lab Complete Record
 
chapter 5.pptx: drainage and irrigation engineering
chapter 5.pptx: drainage and irrigation engineeringchapter 5.pptx: drainage and irrigation engineering
chapter 5.pptx: drainage and irrigation engineering
 
VIP Model Call Girls Kothrud ( Pune ) Call ON 8005736733 Starting From 5K to ...
VIP Model Call Girls Kothrud ( Pune ) Call ON 8005736733 Starting From 5K to ...VIP Model Call Girls Kothrud ( Pune ) Call ON 8005736733 Starting From 5K to ...
VIP Model Call Girls Kothrud ( Pune ) Call ON 8005736733 Starting From 5K to ...
 
ONLINE FOOD ORDER SYSTEM PROJECT REPORT.pdf
ONLINE FOOD ORDER SYSTEM PROJECT REPORT.pdfONLINE FOOD ORDER SYSTEM PROJECT REPORT.pdf
ONLINE FOOD ORDER SYSTEM PROJECT REPORT.pdf
 

TIME SERIES ANALYSIS.docx

  • 1. 1 TIME SERIES ANALYSIS Time series analysis is a specific way of analysing a sequence of data points collected over an interval of time. In time series analysis, analysts record data points at consistent intervals over a set period of time rather than just recording the data points intermittently or randomly. However, this type of analysis is not merely the act of collecting data over time. What sets time series data apart from other data is that the analysis can show how variables change over time. In other words, time is a crucial variable because it shows how the data adjusts over the course of the data points as well as the final results. It provides an additional source of information and a set order of dependencies between the data. Time series analysis typically requires a large number of data points to ensure consistency and reliability. An extensive data set ensures you have a representative sample size and that analysis can cut through noisy data. It also ensures that any trends or patterns discovered are not outliers and can account for seasonal variance. Additionally, time series data can be used for forecasting—predicting future data based on historical data. Time series analysis helps organizations understand the underlying causes of trends or systemic patterns over time. Using data visualizations, business users can see seasonal trends and dig deeper into why these trends occur. With modern analytics platforms, these visualizations can go far beyond line graphs. When organizations analyze data over consistent intervals, they can also use time series forecasting to predict the likelihood of future events. Time series forecasting is part of predictive analytics. It can show likely changes in the data, like seasonality or cyclic behaviour, which provides a better understanding of data variables and helps forecast better. For example, Des Moines Public Schools analyzed five years of student achievement data to identify at-risk students and track progress over time. Today’s technology allows us to collect massive amounts of data every day and it’s easier than ever to gather enough consistent data for comprehensive analysis.
  • 2. 2 Time series analysis is used for non-stationary data—things that are constantly fluctuating over time or are affected by time. Industries like finance, retail, and economics frequently use time series analysis because currency and sales are always changing. Stock market analysis is an excellent example of time series analysis in action, especially with automated trading algorithms. Likewise, time series analysis is ideal for forecasting weather changes, helping meteorologists predict everything from tomorrow’s weather report to future years of climate change. Examples of time series analysis in action include:  Weather data  Rainfall measurements  Temperature readings  Heart rate monitoring (EKG)  Brain monitoring (EEG)  Quarterly sales  Stock prices  Automated stock trading  Industry forecasts
  • 3. 3 BASIC OBJECTIVES OF TIME SERIES ANALYSIS The basic objective usually is to determine a model that describes the pattern of the time series. Uses for such a model are: 1. To describe the important features of the time series pattern. 2. To explain how the past affects the future or how two time series can “interact”. 3. To forecast future values of the series. 4. To possibly serve as a control standard for a variable that measures the quality of product in some manufacturing situations. IMPORTANT CHARACTERISTICS TO CONSIDER Some important questions to first consider when first looking at a time series are:  Is there a trend, meaning that, on average, the measurements tend to increase (or decrease) over time?  Is there seasonality, meaning that there is a regularly repeating pattern of highs and lows related to calendar time such as seasons, quarters, months, days of the week, and so on?  Are there outliers? In regression, outliers are far away from your line. With time series data, your outliers are far away from your other data.  Is there a long-run cycle or period unrelated to seasonality factors?  Is there constant variance over time, or is the variance non-constant?  Are there any abrupt changes to either the level of the series or the variance? TIME SERIES ANALYSIS TYPES Because time series analysis includes many categories or variations of data, analysts sometimes must make complex models. However, analysts can’t account for all variances, and they can’t generalize a specific model to every sample. Models that are too complex or that try to do too many things can lead to a lack of fit. Lack of fit or overfitting models lead to those models not distinguishing between random error and true relationships, leaving analysis skewed and forecasts incorrect.
  • 4. 4 Models of time series analysis include:  Classification: Identifies and assigns categories to the data.  Curve fitting: Plots the data along a curve to study the relationships of variables within the data.  Descriptive analysis: Identifies patterns in time series data, like trends, cycles, or seasonal variation.  Explanative analysis: Attempts to understand the data and the relationships within it, as well as cause and effect.  Exploratory analysis: Highlights the main characteristics of the time series data, usually in a visual format.  Forecasting: Predicts future data. This type is based on historical trends. It uses the historical data as a model for future data, predicting scenarios that could happen along future plot points.  Intervention analysis: Studies how an event can change the data.  Segmentation: Splits the data into segments to show the underlying properties of the source information. DATA CLASSIFICATION Further, time series data can be classified into two main categories:  Stock time series data means measuring attributes at a certain point in time, like a static snapshot of the information as it was.  Flow time series data means measuring the activity of the attributes over a certain period, which is generally part of the total whole and makes up a portion of the results.
  • 5. 5 DATA VARIATIONS In time series data, variations can occur sporadically throughout the data:  Functional analysis can pick out the patterns and relationships within the data to identify notable events.  Trend analysis means determining consistent movement in a certain direction. There are two types of trends: deterministic, where we can find the underlying cause, and stochastic, which is random and unexplainable.  Seasonal variation describes events that occur at specific and regular intervals during the course of a year. Serial dependence occurs when data points close together in time tend to be related. Time series analysis and forecasting models must define the types of data relevant to answering the business question. Once analysts have chosen the relevant data they want to analyse, they choose what types of analysis and techniques are the best fit. IMPORTANT CONSIDERATIONS FOR TIME SERIES ANALYSIS While time series data is data collected over time, there are different types of data that describe how and when that time data was recorded. For example:  Time series data is data that is recorded over consistent intervals of time.  Cross-sectional data consists of several variables recorded at the same time.  Pooled data is a combination of both time series data and cross-sectional data. TIME SERIES DATA DEFINITION Time series data is a collection of observations (behaviour) for a single subject (entity) at different time intervals (generally equally spaced as in the case of metrics, or unequally spaced as in the case of events).
  • 6. 6 For example: Max Temperature, Humidity and Wind (all three behaviours) in New York City (single entity) collected on First day of every year (multiple intervals of time) The relevance of time as an axis makes time series data distinct from other types of data. CROSS-SECTIONAL DATA DEFINITION Cross-sectional data is a collection of observations (behaviour) for multiple subjects (entities such as different individuals or groups) at a single point in time. For example: Max Temperature, Humidity and Wind (all three behaviours) in New York City, SFO, Boston, Chicago (multiple entities) on 1/1/2015 (single instance) In cross-sectional studies, there is no natural ordering of the observations (e.g., explaining people’s wages by reference to their respective education levels, where the individuals’ data could be entered in any order). For example: the closing price of a group of 50 stocks at a given moment in time, an inventory of a given product in stock at a specific store, and a list of grades obtained by a class of students on a given exam. PANEL DATA (LONGITUDINAL DATA) DEFINITION Panel data is usually called as cross-sectional time series data as it is a combination of the above- mentioned types (i.e., collection of observations for multiple subjects at multiple instances). Panel data or longitudinal data is multi-dimensional data involving measurements over time. Panel data contains observations of multiple phenomena obtained over multiple time periods for the same firms or individuals. A study that uses panel data is called a longitudinal study or panel study. For example: Max Temperature, Humidity and Wind (all three behaviours) in New York City, SFO, Boston, Chicago (multiple entities) on the first day of every year (multiple intervals of time). DIFFERENCES BETWEEN THE THREE DATA TYPES Based on the above definitions and examples, let’s recap the differences between the three data types:
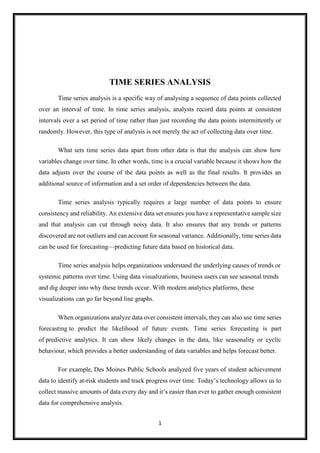
  • 7. 7 1. A time series is a group of observations on a single entity over time — e.g., the daily closing prices over one year for a single financial security, or a single patient’s heart rate measured every minute over a one-hour procedure. 2. A cross-section is a group of observations of multiple entities at a single time — e.g., today’s closing prices for each of the S&P 500 companies, or the heart rates of 100 patients at the beginning of the same procedure. 3. If your data is organized in both dimensions — e.g., daily closing prices over one year for 500 companies — then you have panel data. TIME SERIES ANALYSIS MODELS AND TECHNIQUES Just as there are many types and models, there are also a variety of methods to study data. Here are the three most common.  Box-Jenkins ARIMA models: These univariate models are used to better understand a single time-dependent variable, such as temperature over time, and to predict future data points of variables. These models work on the assumption that the data is stationary. Analysts have to account for and remove as many differences and seasonality in past data points as they can. The ARIMA model includes terms to account for moving averages, seasonal difference operators, and autoregressive terms within the model.  Box-Jenkins Multivariate Models: Multivariate models are used to analyse more than one time-dependent variable, such as temperature and humidity, over time.  Holt-Winters Method: The Holt-Winters method is an exponential smoothing technique. It is designed to predict outcomes, provided that the data points include seasonality The following plot is a time series plot of the annual number of earthquakes in the world with seismic magnitude over 7.0, for 99 consecutive years. By a time series plot, we simply mean that the variable is plotted against time.
  • 8. 8 Some features of the plot:  There is no consistent trend (upward or downward) over the entire time span. The series appears to slowly wander up and down. The horizontal line drawn at quakes = 20.2 indicates the mean of the series. Notice that the series tends to stay on the same side of the mean (above or below) for a while and then wanders to the other side.  Almost by definition, there is no seasonality as the data are annual data.  There are no obvious outliers.  It’s difficult to judge whether the variance is constant or not. One of the simplest ARIMA type models is a model in which we use a linear model to predict the value at the present time using the value at the previous time. This is called an AR(1) model, standing for autoregressive model of order 1. The order of the model indicates how many previous times we use to predict the present time. TYPES OF TIME SERIES DATA Time series data can be classified into two types:  Measurements gathered at regular time intervals (metrics)  Measurements gathered at irregular time intervals (events)
  • 9. 9 A time series data example can be any information sequence that was taken at specific time intervals (whether regular or irregular). Common data examples could be anything from heart rate to the unit price of store goods. LINEAR VS. NONLINEAR TIME SERIES DATA A linear time series is one where, for each data point Xt, that data point can be viewed as a linear combination of past or future values or differences. Nonlinear time series are generated by nonlinear dynamic equations. They have features that cannot be modelled by linear processes: time-changing variance, asymmetric cycles, higher-moment structures, thresholds and breaks. Here are some important considerations when working with linear and nonlinear time series data:  If a regression equation doesn’t follow the rules for a linear model, then it must be a nonlinear model.  Nonlinear regression can fit an enormous variety of curves.  The defining characteristic for both types of models the functional forms. IDENTIFYING TIME SERIES DATA Time series data is unique in that it has a natural time order: the order in which the data was observed matters. The key difference with time series data from regular data is that you’re
  • 10. 10 always asking questions about it over time. An often-simple way to determine if the dataset you are working with is time series or not, is to see if one of your axes is time. TIME SERIES CONSIDERATIONS Immutability – Since time series data comes in time order, it is almost always recorded in a new entry, and as such, should be immutable and append-only (appended to the existing data). It doesn’t usually change but is rather tacked on in the order that events happen. This property distinguishes time series data from relational data which is usually mutable and is stored in relational databases that do online transaction processing, where rows in databases are updated as the transactions are run and more or less randomly; taking an order for an existing customer, for instance, updates the customer table to add items purchased and also updates the inventory table to show that they are no longer available for sale. The fact that time series data is ordered makes it unique in the data space because it often displays serial dependence. Serial dependence occurs when the value of a datapoint at one time is statistically dependent on another datapoint in another time (read “Autocorrelation in Time Series Data” for a detailed explanation about this topic). Though there are no events that exist outside of time, there are events where time isn’t relevant. Time series data isn’t simply about things that happen in chronological order — it’s about events whose value increases when you add time as an axis. Time series data sometimes exists at high levels of granularity, as frequently as microseconds or even nanoseconds. With time series data, change over time is everything. *************************************************