July 2021 - Market Report
•
0 gostou•304 visualizações

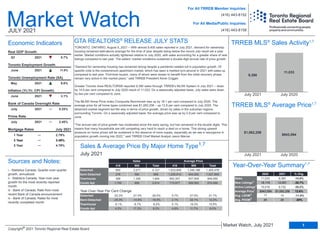
Check out this months Market Report courtesy of TRREB. House prices continue to rise through the month of July even though sales decline.

Recomendados
Mais conteúdo relacionado
Mais procurados
Mais procurados (20)
Semelhante a July 2021 - Market Report
Semelhante a July 2021 - Market Report (20)
Mais de Michelle Makos
Mais de Michelle Makos (14)
Último
Último (20)
July 2021 - Market Report
- 1. Sales New Listings Active Listings Average Price Avg. LDOM Avg. PDOM 11,033 9,390 -14.9% 18,119 12,551 -30.7% 15,018 9,732 -35.2% $943,594 $1,062,256 12.6% 17 15 -11.8% 25 20 -20% 2020 2021 % Chg. Year Market Watch JULY 2021 Economic Indicators July 2021 GTA REALTORS® RELEASE JULY STATS TORONTO, ONTARIO, August 5, 2021 – With almost 9,400 sales reported in July 2021, demand for ownership housing remained well-above average for the time of year despite being below the record July result set a year earlier. Market conditions actually tightened relative to July 2020, with sales accounting for a greater share of new listings compared to last year. The sellers’ market conditions sustained a double-digit annual rate of price growth. “Demand for ownership housing has remained strong despite a pandemic-related lull in population growth. Of specific note is the condominium apartment market, which has seen a marked turn-around in 2021 with sales up compared to last year. First-time buyers, many of whom were slower to benefit from the initial recovery phase, remain very active in the market place,” said TRREB President Kevin Crigger. Greater Toronto Area REALTORS® reported 9,390 sales through TRREB’s MLS® System in July 2021 – down by 14.9 per cent compared to July 2020 result of 11,033. On a seasonally adjusted basis, July sales were down by two per cent compared to June. The MLS® Home Price Index Composite Benchmark was up by 18.1 per cent compared to July 2020. The average price for all home types combined was $1,062,256 – up 12.6 per cent compared to July 2020. The detached market segment led the way in terms of price growth, driven by sales in the suburban regions surrounding Toronto. On a seasonally adjusted basis, the average price was up by 0.9 per cent compared to June. “The annual rate of price growth has moderated since the early spring, but has remained in the double digits. This means that many households are still competing very hard to reach a deal on a home. This strong upward pressure on home prices will be sustained in the absence of more supply, especially as we see a resurgence in population growth moving into 2022,” said TRREB Chief Market Analyst Jason Mercer. Sources and Notes: i - Statistics Canada, Quarter-over-quarter growth, annualized ii - Statistics Canada, Year-over-year growth for the most recently reported month iii - Bank of Canada, Rate from most recent Bank of Canada announcement iv - Bank of Canada, Rates for most recently completed month For All TRREB Member Inquiries: For All Media/Public Inquiries: (416) 443-8152 (416) 443-8158 July 2020 July 2021 9,390 11,033 Detached Semi-Detached Townhouse Condo Apt 850 3,271 4,121 1,633,649 1,346,186 1,405,478 278 590 868 1,205,814 944,062 1,027,895 368 1,326 1,694 893,347 837,906 849,950 1,756 858 2,614 715,977 589,582 674,490 Sales Average Price 416 905 Total 416 905 Total Home Type Year-Over-Year Per Cent Change July 2020 July 2021 $1,062,256 $943,594 Detached Semi-Detached Townhouse Condo Apt -22.3% -27.4% -26.4% 5.7% 27.0% 21.7% -25.3% -14.9% -18.5% 2.1% 22.1% 12.2% -6.1% -8.7% -8.2% 5.1% 19.3% 15.9% 4.2% 17.2% 8.2% 4.8% 11.7% 6.0% TRREB MLS® Sales Activity1,7 TRREB MLS® Average Price1,7 Sales & Average Price By Major Home Type1,7 Year-Over-Year Summary1,7 July 2021 0.25% July 2021 2.45% 1 Year 2.79% 3 Year 3.49% 5 Year 4.79% June 2021 3.1% May 2021 9.6% June 2021 11.8% Q1 2021 5.7% Real GDP Growth Toronto Employment Growth Toronto Unemployment Rate (SA) Inflation (Yr./Yr. CPI Growth) Bank of Canada Overnight Rate Prime Rate 1 Market Watch, July 2021 Copyright® 2021 Toronto Regional Real Estate Board July 2021 Mortgage Rates 2 3 1 5 5
- 2. Toronto Regional Real Estate Board YEAR-TO-DATE, 2021 $0 to $99,999 $100,000 to $199,999 $200,000 to $299,999 $300,000 to $399,999 $400,000 to $499,999 $500,000 to $599,999 $600,000 to $699,999 $700,000 to $799,999 $800,000 to $899,999 $900,000 to $999,999 $1,000,000 to $1,249,999 $1,250,000 to $1,499,999 $1,500,000 to $1,749,999 $1,750,000 to $1,999,999 $2,000,000+ 0 0 0 0 0 0 0 0 0 0 1 0 0 0 1 0 0 0 0 2 1 0 0 1 10 0 1 0 1 14 4 0 1 1 47 0 2 0 0 55 9 1 0 26 307 0 0 0 0 343 50 6 1 82 818 0 1 0 1 959 84 30 30 237 666 3 1 5 2 1,058 196 60 170 254 346 8 0 1 0 1,035 331 176 227 154 179 14 0 2 0 1,083 429 245 178 35 97 13 0 2 0 999 908 232 167 29 71 21 1 0 0 1,429 883 64 52 15 27 12 0 1 0 1,054 490 27 16 4 19 0 0 1 0 557 253 13 6 1 7 0 0 0 0 280 482 13 5 2 19 0 0 0 0 521 Detached Semi-Detached Att/Row/Twnhouse Condo Townhouse Condo Apt Link Co-Op Apt Det Condo Co-Ownership Apt Total Name $0 to $99,999 $100,000 to $199,999 $200,000 to $299,999 $300,000 to $399,999 $400,000 to $499,999 $500,000 to $599,999 $600,000 to $699,999 $700,000 to $799,999 $800,000 to $899,999 $900,000 to $999,999 $1,000,000 to $1,249,999 $1,250,000 to $1,499,999 $1,500,000 to $1,749,999 $1,750,000 to $1,999,999 $2,000,000+ 0 0 0 0 4 0 0 0 0 4 2 0 0 0 26 0 1 0 0 29 13 0 0 3 65 0 9 0 2 92 41 1 6 22 362 0 16 1 13 462 118 7 4 234 2,916 0 10 0 9 3,298 396 53 33 805 6,574 3 10 3 8 7,885 847 330 466 1,688 5,109 29 14 22 5 8,510 1,839 590 1,418 1,788 2,343 66 3 11 1 8,059 3,062 1,501 2,005 997 1,383 107 4 12 2 9,073 3,982 1,931 1,490 306 761 98 4 12 0 8,584 8,322 1,736 1,408 284 650 165 2 6 0 12,573 7,362 592 455 106 269 57 5 5 0 8,851 4,069 347 135 48 127 3 1 2 0 4,732 2,253 148 39 19 69 1 2 1 0 2,532 4,382 169 66 22 138 0 0 1 0 4,778 Detached Semi-Detached Att/Row/Twnhouse Condo Townhouse Condo Apt Link Co-Op Apt Det Condo Co-Ownership Apt Total Name JULY 2021 SALES BY PRICE RANGE AND HOUSE TYPE 1,7 SALES BY PRICE RANGE AND HOUSE TYPE 1,7 Total Sales Share of Total Sales (%) Average Price ($) 4,121 868 853 841 2,614 71 6 12 4 9,390 43.9% 9.2% 9.1% 9.0% 27.8% 0.8% 0.1% 0.1% 0.0% 100.0% $1,405,478 $1,027,895 $950,038 $748,433 $674,490 $1,011,485 $540,983 $860,750 $519,250 $1,062,257 36,691 7,409 7,525 6,322 20,796 529 81 76 40 79,469 46.2% 9.3% 9.5% 8.0% 26.2% 0.7% 0.1% 0.1% 0.1% 100.0% $1,395,638 $1,049,743 $945,266 $750,726 $666,330 $983,642 $633,906 $880,285 $475,735 $1,074,113 Total Sales Share of Total Sales (%) Average Price ($)
- 3. TRREB Total 9,390 $9,974,588,185 $1,062,256 $911,500 12,551 67.2% 9,732 1.1 104% 15 20 Halton Region 925 $1,084,041,277 $1,171,937 $1,035,000 1,073 76.9% 635 0.8 103% 12 16 Burlington 263 $275,871,865 $1,048,942 $970,000 326 79.1% 196 0.8 104% 13 15 Halton Hills 93 $100,421,186 $1,079,798 $970,000 111 82.0% 58 0.7 107% 11 13 Milton 246 $250,128,624 $1,016,783 $950,000 257 77.8% 124 0.6 103% 11 16 Oakville 323 $457,619,602 $1,416,779 $1,218,000 379 73.4% 257 1.0 101% 14 18 Peel Region 1,980 $1,996,996,431 $1,008,584 $900,000 2,446 69.7% 1,586 0.9 103% 13 19 Brampton 958 $963,794,936 $1,006,049 $922,000 1,113 71.4% 582 0.7 103% 12 18 Caledon 102 $146,478,764 $1,436,066 $1,370,029 136 70.0% 128 1.1 101% 14 21 Mississauga 920 $886,722,731 $963,829 $830,000 1,197 67.9% 876 1.1 103% 14 20 City of Toronto 3,269 $3,323,201,609 $1,016,580 $817,700 5,108 59.7% 4,705 1.5 103% 16 22 Toronto West 820 $795,524,179 $970,151 $869,950 1,217 63.6% 1,088 1.3 103% 16 21 Toronto Central 1,631 $1,731,214,505 $1,061,444 $740,000 2,757 54.1% 2,842 2.0 101% 18 24 Toronto East 818 $796,462,925 $973,671 $925,284 1,134 68.8% 775 0.9 107% 14 18 York Region 1,767 $2,247,325,438 $1,271,831 $1,175,000 2,223 65.7% 1,921 1.3 104% 16 22 Aurora 113 $139,134,595 $1,231,280 $1,170,000 125 69.4% 98 1.2 105% 14 19 East Gwillimbury 68 $91,740,200 $1,349,121 $1,255,400 83 73.6% 65 1.0 104% 15 18 Georgina 77 $71,311,955 $926,129 $800,000 113 73.7% 83 1.0 104% 17 20 King 48 $92,241,300 $1,921,694 $1,687,500 71 61.7% 103 2.6 100% 24 29 Markham 489 $615,315,302 $1,258,314 $1,180,000 594 66.0% 433 1.2 107% 14 19 Newmarket 144 $157,372,321 $1,092,863 $1,050,500 159 74.9% 82 0.8 105% 14 21 Richmond Hill 333 $447,006,192 $1,342,361 $1,205,000 443 60.1% 443 1.7 103% 19 27 Vaughan 408 $509,634,469 $1,249,104 $1,202,944 536 62.4% 537 1.5 103% 17 24 Whitchurch-Stouffville 87 $123,569,104 $1,420,335 $1,205,000 99 70.8% 77 1.3 103% 16 20 Durham Region 1,104 $1,004,857,780 $910,197 $850,000 1,280 80.5% 576 0.6 111% 11 14 Ajax 158 $148,540,564 $940,130 $890,000 198 79.0% 80 0.5 110% 10 13 Brock 31 $23,199,500 $748,371 $670,000 36 78.7% 30 0.9 104% 19 22 Clarington 200 $178,621,068 $893,105 $832,500 231 82.3% 101 0.6 113% 10 12 Oshawa 299 $234,552,019 $784,455 $746,000 350 80.8% 173 0.5 113% 11 13 Pickering 158 $155,012,158 $981,090 $910,500 176 76.6% 71 0.7 109% 11 15 Scugog 36 $35,137,800 $976,050 $810,500 44 80.3% 32 1.1 106% 14 17 Uxbridge 25 $32,048,078 $1,281,923 $1,300,000 33 88.2% 22 0.9 106% 8 10 Whitby 197 $197,746,593 $1,003,790 $967,111 212 81.4% 67 0.5 110% 10 13 Dufferin County 53 $40,013,676 $754,975 $753,000 60 86.8% 31 0.5 104% 11 17 Orangeville 53 $40,013,676 $754,975 $753,000 60 86.8% 31 0.5 104% 11 17 Simcoe County 292 $278,151,974 $952,575 $860,000 361 78.9% 278 0.9 102% 16 21 Adjala-Tosorontio 15 $20,851,800 $1,390,120 $1,100,000 24 80.9% 25 1.1 102% 16 19 Bradford West Gwillimbury 72 $76,845,675 $1,067,301 $977,500 84 74.8% 49 0.8 105% 13 19 Essa 33 $29,389,300 $890,585 $750,000 42 86.3% 22 0.6 102% 10 11 Innisfil 99 $88,172,399 $890,630 $824,444 131 75.5% 120 1.1 100% 19 24 New Tecumseth 73 $62,892,800 $861,545 $815,000 80 84.3% 62 0.8 102% 18 21 Sub_Municipality # of Sales Dollar Volume Average Price Median Price New Listings SNLR (Trend) Active Listings Mos Inv (Trend) Avg. SP/LP Avg. LDOM Avg. PDOM Toronto Regional Real Estate Board SUMMARY OF EXISTING HOME TRANSACTIONS ALL TRREB AREAS ALL HOME TYPES, JULY 2021 1 1 1 2 8 3 9 4 5 3 Market Watch, July 2021 Copyright® 2021 Toronto Regional Real Estate Board 5
- 4. TRREB Total 9,390 $9,974,588,185 $1,062,256 $911,500 12,551 67.2% 9,732 1.1 104% 15 20 City of Toronto Total 3,269 $3,323,201,609 $1,016,580 $817,700 5,108 59.7% 4,705 1.5 103% 16 22 Toronto West 820 $795,524,179 $970,151 $869,950 1,217 63.6% 1,088 1.3 103% 16 21 Toronto W01 47 $61,633,407 $1,311,349 $1,125,000 77 63.9% 52 1.0 103% 13 18 Toronto W02 88 $101,456,390 $1,152,914 $1,140,000 126 67.2% 68 0.8 106% 13 17 Toronto W03 52 $49,436,882 $950,709 $928,500 90 61.4% 78 1.1 106% 13 17 Toronto W04 71 $61,184,209 $861,749 $790,000 117 61.2% 131 1.6 103% 15 19 Toronto W05 118 $95,852,297 $812,308 $840,000 138 65.5% 146 1.4 103% 17 26 Toronto W06 140 $123,179,745 $879,855 $770,000 242 59.5% 247 1.5 101% 17 24 Toronto W07 20 $36,431,999 $1,821,600 $1,610,500 40 59.8% 30 1.3 103% 9 11 Toronto W08 162 $154,519,943 $953,827 $682,750 221 65.2% 199 1.3 102% 17 23 Toronto W09 59 $62,703,508 $1,062,771 $1,150,000 58 63.8% 52 1.3 101% 20 29 Toronto W10 63 $49,125,799 $779,775 $860,000 108 68.8% 85 1.1 104% 13 17 Toronto Central 1,631 $1,731,214,505 $1,061,444 $740,000 2,757 54.1% 2,842 2.0 101% 18 24 Toronto C01 529 $445,067,461 $841,337 $720,000 862 52.4% 819 2.1 102% 18 25 Toronto C02 81 $133,073,825 $1,642,887 $1,060,000 166 46.1% 224 2.8 99% 17 31 Toronto C03 34 $54,471,388 $1,602,100 $1,164,000 94 55.3% 103 1.6 100% 12 19 Toronto C04 77 $161,051,667 $2,091,580 $1,865,000 101 60.6% 103 1.5 99% 25 31 Toronto C06 38 $38,777,865 $1,020,470 $680,500 77 56.7% 68 1.5 104% 12 15 Toronto C07 92 $99,726,626 $1,083,985 $800,000 178 56.1% 192 1.9 103% 16 18 Toronto C08 248 $184,222,381 $742,832 $676,750 437 50.3% 432 2.2 103% 18 23 Toronto C09 22 $50,955,888 $2,316,177 $1,387,500 36 52.7% 64 2.4 98% 24 36 Toronto C10 80 $76,797,770 $959,972 $710,500 105 56.3% 112 1.8 101% 22 29 Toronto C11 37 $36,876,257 $996,656 $595,000 62 56.7% 57 1.6 103% 16 21 Toronto C12 36 $111,296,451 $3,091,568 $2,905,000 57 49.6% 98 3.6 100% 19 28 Toronto C13 49 $54,952,800 $1,121,486 $972,000 82 61.7% 97 1.5 102% 18 22 Toronto C14 136 $133,160,575 $979,122 $725,000 212 57.2% 219 1.9 102% 14 21 Toronto C15 172 $150,783,551 $876,649 $665,500 288 60.2% 254 1.6 103% 16 21 Toronto East 818 $796,462,925 $973,671 $925,284 1,134 68.8% 775 0.9 107% 14 18 Toronto E01 71 $85,370,184 $1,202,397 $1,188,000 95 66.2% 64 0.8 105% 14 20 Toronto E02 61 $75,850,698 $1,243,454 $1,290,000 98 65.3% 52 0.9 112% 11 16 Toronto E03 84 $105,504,464 $1,256,006 $1,152,500 138 64.2% 104 0.9 106% 14 20 Toronto E04 115 $103,090,251 $896,437 $920,000 148 69.7% 87 0.8 105% 13 17 Toronto E05 86 $73,890,588 $859,193 $757,500 113 67.8% 90 1.1 109% 15 19 Toronto E06 28 $30,409,875 $1,086,067 $939,250 39 65.5% 42 1.0 104% 12 18 Toronto E07 77 $65,940,244 $856,367 $883,800 114 72.6% 86 0.9 110% 15 18 Toronto E08 46 $45,211,699 $982,863 $950,056 72 69.1% 57 1.1 104% 14 20 Toronto E09 94 $71,390,367 $759,472 $679,000 114 71.3% 72 0.9 105% 15 18 Toronto E10 71 $69,668,955 $981,253 $1,000,000 84 70.7% 56 0.9 108% 13 16 Toronto E11 85 $70,135,600 $825,125 $810,000 119 74.9% 65 0.8 106% 14 17 Municipality # of Sales Dollar Volume Average Price Median Price New Listings SNLR (Trend) Active Listings Mos Inv (Trend) Avg. SP/LP Avg. LDOM Avg. PDOM Toronto Regional Real Estate Board ALL HOME TYPES, JULY 2021 SUMMARY OF EXISTING HOME TRANSACTIONS CITY OF TORONTO MUNICIPAL BREAKDOWN 1 1 1 2 8 3 9 4 5 4 Market Watch, July 2021 Copyright® 2021 Toronto Regional Real Estate Board 5
- 5. TRREB Total 79,469 $85,358,711,331 $1,074,113 $925,000 115,510 106% 13 17 Halton Region 8,022 $9,690,280,161 $1,207,963 $1,060,000 10,764 105% 11 14 Burlington 2,292 $2,446,847,987 $1,067,560 $955,000 2,969 106% 12 14 Halton Hills 743 $815,066,831 $1,096,994 $980,000 946 107% 10 12 Milton 2,029 $2,106,237,667 $1,038,067 $952,000 2,812 106% 9 11 Oakville 2,958 $4,322,127,676 $1,461,166 $1,291,250 4,037 104% 12 17 Peel Region 16,222 $16,734,977,258 $1,031,622 $930,000 23,540 104% 11 15 Brampton 8,008 $8,066,499,396 $1,007,305 $931,000 11,710 105% 9 13 Caledon 884 $1,246,189,376 $1,409,716 $1,265,000 1,356 103% 12 16 Mississauga 7,330 $7,422,288,486 $1,012,591 $887,750 10,474 104% 12 17 City of Toronto 27,411 $28,717,980,338 $1,047,681 $830,000 41,524 105% 15 21 Toronto West 6,960 $6,952,880,407 $998,977 $879,500 10,349 106% 15 20 Toronto Central 13,670 $15,049,246,400 $1,100,896 $755,000 21,417 103% 18 25 Toronto East 6,781 $6,715,853,531 $990,393 $945,000 9,758 110% 11 15 York Region 14,617 $18,313,787,523 $1,252,910 $1,150,000 22,211 105% 14 19 Aurora 947 $1,199,363,624 $1,266,487 $1,170,000 1,368 105% 14 18 East Gwillimbury 614 $761,908,134 $1,240,893 $1,170,000 868 106% 14 16 Georgina 869 $738,283,498 $849,578 $800,000 1,258 107% 13 16 King 371 $736,184,667 $1,984,325 $1,887,500 645 99% 27 36 Markham 3,667 $4,595,190,101 $1,253,120 $1,188,000 5,434 108% 13 18 Newmarket 1,275 $1,376,077,566 $1,079,277 $1,020,000 1,795 106% 10 14 Richmond Hill 2,567 $3,390,256,760 $1,320,708 $1,218,800 4,208 105% 16 22 Vaughan 3,588 $4,581,307,626 $1,276,842 $1,185,500 5,599 104% 15 20 Whitchurch-Stouffville 719 $935,215,547 $1,300,717 $1,140,000 1,036 104% 16 21 Durham Region 9,961 $8,976,863,178 $901,201 $842,000 13,080 112% 9 11 Ajax 1,461 $1,388,911,818 $950,658 $900,000 1,994 112% 8 10 Brock 206 $155,691,845 $755,786 $730,000 280 106% 13 17 Clarington 1,792 $1,542,092,988 $860,543 $810,000 2,263 114% 8 10 Oshawa 2,930 $2,276,200,653 $776,860 $750,000 3,828 114% 9 11 Pickering 1,247 $1,261,083,810 $1,011,294 $905,000 1,709 109% 10 12 Scugog 247 $242,130,781 $980,287 $865,000 321 107% 16 19 Uxbridge 258 $325,749,120 $1,262,593 $1,161,500 323 106% 15 17 Whitby 1,820 $1,785,002,163 $980,770 $925,000 2,362 113% 7 9 Dufferin County 488 $382,633,194 $784,084 $765,000 597 107% 9 11 Orangeville 488 $382,633,194 $784,084 $765,000 597 107% 9 11 Simcoe County 2,748 $2,542,189,679 $925,105 $851,000 3,794 104% 13 16 Adjala-Tosorontio 155 $182,313,491 $1,176,216 $1,080,000 208 102% 17 19 Bradford West Gwillimbury 668 $698,151,580 $1,045,137 $975,000 950 105% 11 14 Essa 337 $272,595,838 $808,890 $737,700 417 105% 11 12 Innisfil 873 $777,405,749 $890,499 $815,000 1,282 103% 14 18 New Tecumseth 715 $611,723,021 $855,557 $810,000 937 104% 12 14 Sub_Municipality Number of Sales Dollar Volume Average Price Median Price New Listings Avg. SP/LP Avg. LDOM Avg. PDOM Toronto Regional Real Estate Board SUMMARY OF EXISTING HOME TRANSACTIONS ALL TRREB AREAS ALL HOME TYPES, YEAR-TO-DATE 2021 1 1 1 2 4 5 5 Market Watch, July 2021 Copyright® 2021 Toronto Regional Real Estate Board 5
- 6. TRREB Total 79,469 $85,358,711,331 $1,074,113 $925,000 115,510 106% 13 17 City of Toronto Total 27,411 $28,717,980,338 $1,047,681 $830,000 41,524 105% 15 21 Toronto West 6,960 $6,952,880,407 $998,977 $879,500 10,349 106% 15 20 Toronto W01 447 $583,658,547 $1,305,724 $1,080,000 634 110% 11 15 Toronto W02 689 $852,492,390 $1,237,289 $1,195,000 992 112% 10 13 Toronto W03 498 $500,068,990 $1,004,155 $974,250 797 111% 12 16 Toronto W04 701 $604,101,247 $861,771 $805,000 1,087 106% 16 22 Toronto W05 914 $753,278,707 $824,156 $855,995 1,358 105% 16 21 Toronto W06 1,287 $1,163,993,648 $904,424 $791,500 1,996 104% 16 22 Toronto W07 186 $299,914,227 $1,612,442 $1,471,875 287 107% 13 20 Toronto W08 1,329 $1,453,650,414 $1,093,793 $720,000 1,851 104% 16 21 Toronto W09 356 $338,851,146 $951,829 $950,000 532 105% 15 21 Toronto W10 553 $402,871,091 $728,519 $610,000 815 104% 15 20 Toronto Central 13,670 $15,049,246,400 $1,100,896 $755,000 21,417 103% 18 25 Toronto C01 4,391 $3,694,177,830 $841,307 $709,000 6,560 103% 18 26 Toronto C02 622 $1,016,886,931 $1,634,866 $1,200,500 1,207 102% 22 31 Toronto C03 386 $649,864,526 $1,683,587 $1,300,000 709 104% 13 18 Toronto C04 690 $1,521,822,661 $2,205,540 $2,087,500 1,052 102% 14 21 Toronto C06 291 $333,093,446 $1,144,651 $905,000 480 104% 13 18 Toronto C07 884 $992,186,715 $1,122,383 $800,000 1,429 103% 18 25 Toronto C08 2,060 $1,618,962,504 $785,904 $685,000 3,235 103% 19 27 Toronto C09 230 $520,327,853 $2,262,295 $1,644,950 373 101% 21 27 Toronto C10 680 $697,415,702 $1,025,611 $768,000 1,010 103% 18 27 Toronto C11 341 $413,371,183 $1,212,232 $712,000 563 104% 14 21 Toronto C12 251 $774,700,216 $3,086,455 $2,775,000 480 99% 21 32 Toronto C13 527 $657,768,829 $1,248,138 $910,000 831 104% 16 20 Toronto C14 1,031 $1,023,067,838 $992,306 $701,000 1,574 102% 17 24 Toronto C15 1,286 $1,135,600,166 $883,048 $671,000 1,914 104% 16 23 Toronto East 6,781 $6,715,853,531 $990,393 $945,000 9,758 110% 11 15 Toronto E01 687 $851,914,210 $1,240,050 $1,225,092 1,004 115% 9 12 Toronto E02 532 $748,474,103 $1,406,906 $1,305,000 782 112% 9 12 Toronto E03 780 $946,116,239 $1,212,970 $1,189,000 1,214 113% 10 13 Toronto E04 784 $673,509,293 $859,068 $880,500 1,135 109% 12 14 Toronto E05 622 $549,130,800 $882,847 $785,750 926 110% 12 15 Toronto E06 293 $333,558,512 $1,138,425 $1,015,000 465 108% 11 13 Toronto E07 711 $584,826,063 $822,540 $770,100 996 111% 12 15 Toronto E08 460 $445,233,049 $967,898 $921,500 661 107% 13 18 Toronto E09 818 $627,309,383 $766,882 $685,000 1,037 109% 13 18 Toronto E10 467 $471,020,616 $1,008,609 $999,999 686 108% 12 15 Toronto E11 627 $484,761,263 $773,144 $775,000 852 108% 12 15 Municipality Number of Sales Dollar Volume Average Price Median Price New Listings Avg. SP/LP Avg. LDOM Avg. PDOM Toronto Regional Real Estate Board SUMMARY OF EXISTING HOME TRANSACTIONS CITY OF TORONTO MUNICIPAL BREAKDOWN ALL HOME TYPES, YEAR-TO-DATE 2021 1 1 1 2 4 5 6 Market Watch, July 2021 Copyright® 2021 Toronto Regional Real Estate Board 5
- 7. TRREB Total 4,121 $5,791,975,027 $1,405,478 $1,250,800 5,200 3,962 104% 14 Halton Region 472 $716,235,994 $1,517,449 $1,312,500 547 350 102% 12 Burlington 130 $177,521,089 $1,365,547 $1,233,000 156 89 104% 12 Halton Hills 71 $83,697,086 $1,178,832 $1,160,000 84 46 107% 10 Milton 103 $132,368,549 $1,285,132 $1,225,000 115 75 102% 11 Oakville 168 $322,649,270 $1,920,531 $1,623,500 192 140 101% 14 Peel Region 823 $1,119,048,263 $1,359,718 $1,268,000 1,029 669 103% 13 Brampton 492 $597,701,937 $1,214,841 $1,160,000 569 288 103% 12 Caledon 71 $117,915,264 $1,660,778 $1,510,000 103 109 101% 15 Mississauga 260 $403,431,062 $1,551,658 $1,389,950 357 272 103% 14 City of Toronto 850 $1,388,601,252 $1,633,649 $1,325,000 1,187 1,087 103% 15 Toronto West 276 $381,531,562 $1,382,361 $1,250,000 365 299 103% 14 Toronto Central 226 $574,599,980 $2,542,478 $2,037,500 405 526 100% 20 Toronto East 348 $432,469,710 $1,242,729 $1,125,000 417 262 107% 13 York Region 976 $1,559,946,411 $1,598,306 $1,452,200 1,241 1,208 104% 18 Aurora 63 $96,760,694 $1,535,884 $1,357,500 69 61 104% 16 East Gwillimbury 57 $81,230,200 $1,425,091 $1,310,000 73 63 104% 16 Georgina 72 $67,909,955 $943,194 $807,500 108 82 104% 18 King 41 $87,231,400 $2,127,595 $1,998,000 61 97 100% 27 Markham 215 $367,774,049 $1,710,577 $1,618,000 266 232 107% 16 Newmarket 96 $117,464,713 $1,223,591 $1,174,500 101 55 105% 14 Richmond Hill 168 $308,164,306 $1,834,311 $1,630,000 234 279 102% 22 Vaughan 204 $333,242,990 $1,633,544 $1,489,000 255 276 103% 18 Whitchurch-Stouffville 60 $100,168,104 $1,669,468 $1,352,600 74 63 102% 18 Durham Region 743 $754,099,345 $1,014,939 $951,500 854 386 111% 10 Ajax 93 $97,906,034 $1,052,753 $1,025,000 120 49 110% 9 Brock 29 $22,164,500 $764,293 $716,100 35 30 104% 20 Clarington 146 $142,124,115 $973,453 $905,000 165 75 112% 10 Oshawa 193 $170,244,574 $882,096 $825,000 222 102 114% 9 Pickering 86 $104,676,214 $1,217,165 $1,179,000 97 35 110% 10 Scugog 35 $34,587,800 $988,223 $816,000 43 27 106% 15 Uxbridge 20 $28,714,878 $1,435,744 $1,413,000 27 18 106% 8 Whitby 141 $153,681,230 $1,089,938 $1,020,000 145 50 110% 10 Dufferin County 28 $23,902,875 $853,674 $848,250 42 23 104% 6 Orangeville 28 $23,902,875 $853,674 $848,250 42 23 104% 6 Simcoe County 229 $230,140,887 $1,004,982 $940,000 300 239 102% 16 Adjala-Tosorontio 14 $20,261,900 $1,447,279 $1,177,500 24 25 102% 16 Bradford West Gwillimbury 55 $63,579,388 $1,155,989 $1,155,000 66 43 104% 14 Essa 27 $25,393,900 $940,515 $860,000 35 21 101% 11 Innisfil 85 $75,729,899 $890,940 $845,000 113 101 100% 19 New Tecumseth 48 $45,175,800 $941,163 $918,900 62 49 103% 17 Municipality Number of Sales Dollar Volume Average Price Median Price New Listings Active Listings Avg. SP/LP Avg. LDOM DETACHED, JULY 2021 Toronto Regional Real Estate Board SUMMARY OF EXISTING HOME TRANSACTIONS ALL TRREB AREAS 1 1 2 4 5 1 1 3 7 Market Watch, July 2021 Copyright® 2021 Toronto Regional Real Estate Board
- 8. TRREB Total 4,121 $5,791,975,027 $1,405,478 $1,250,800 5,200 3,962 104% 14 City of Toronto 850 $1,388,601,252 $1,633,649 $1,325,000 1,187 1,087 103% 15 Toronto West 276 $381,531,562 $1,382,361 $1,250,000 365 299 103% 14 Toronto W01 15 $31,525,659 $2,101,711 $2,050,000 16 13 102% 16 Toronto W02 21 $31,811,990 $1,514,857 $1,549,000 34 23 103% 16 Toronto W03 27 $28,067,882 $1,039,551 $945,000 50 40 106% 12 Toronto W04 32 $37,944,009 $1,185,750 $1,123,650 50 54 103% 14 Toronto W05 28 $31,941,418 $1,140,765 $1,135,000 27 32 104% 17 Toronto W06 25 $32,033,900 $1,281,356 $1,211,000 36 32 101% 12 Toronto W07 15 $32,204,000 $2,146,933 $1,880,000 28 20 103% 9 Toronto W08 52 $84,263,690 $1,620,456 $1,449,750 62 43 103% 13 Toronto W09 34 $44,936,003 $1,321,647 $1,257,500 23 15 102% 18 Toronto W10 27 $26,803,011 $992,704 $950,111 39 27 106% 10 Toronto Central 226 $574,599,980 $2,542,478 $2,037,500 405 526 100% 20 Toronto C01 5 $7,127,888 $1,425,578 $1,342,888 11 17 105% 8 Toronto C02 9 $27,640,025 $3,071,114 $2,680,000 8 20 97% 26 Toronto C03 15 $37,644,500 $2,509,633 $1,350,000 34 41 99% 13 Toronto C04 48 $133,950,080 $2,790,627 $2,470,000 64 57 99% 26 Toronto C06 17 $26,283,365 $1,546,080 $1,395,000 41 33 106% 11 Toronto C07 30 $54,393,826 $1,813,128 $1,771,500 56 64 104% 19 Toronto C08 1 $2,450,000 $2,450,000 $2,450,000 2 3 85% 76 Toronto C09 7 $32,351,000 $4,621,571 $3,465,000 10 17 98% 15 Toronto C10 10 $23,518,457 $2,351,846 $2,087,500 11 6 100% 29 Toronto C11 8 $19,232,000 $2,404,000 $2,390,500 10 10 103% 11 Toronto C12 24 $97,549,040 $4,064,543 $3,815,000 41 80 99% 20 Toronto C13 10 $21,871,000 $2,187,100 $2,100,000 18 35 99% 25 Toronto C14 20 $49,039,799 $2,451,990 $2,397,500 44 78 101% 20 Toronto C15 22 $41,549,000 $1,888,591 $1,713,500 55 65 105% 14 Toronto East 348 $432,469,710 $1,242,729 $1,125,000 417 262 107% 13 Toronto E01 11 $18,910,500 $1,719,136 $1,380,000 14 10 104% 9 Toronto E02 21 $32,446,581 $1,545,075 $1,575,000 33 19 111% 12 Toronto E03 52 $74,199,964 $1,426,922 $1,275,000 69 54 105% 15 Toronto E04 59 $65,700,825 $1,113,573 $1,057,000 58 31 106% 14 Toronto E05 25 $31,578,000 $1,263,120 $1,294,000 35 25 111% 10 Toronto E06 21 $24,723,375 $1,177,304 $1,009,000 25 17 104% 10 Toronto E07 24 $28,636,688 $1,193,195 $1,161,400 30 24 114% 11 Toronto E08 25 $31,799,699 $1,271,988 $1,125,000 28 21 105% 17 Toronto E09 36 $37,807,199 $1,050,200 $1,033,000 41 18 107% 11 Toronto E10 42 $51,285,379 $1,221,080 $1,162,000 49 28 109% 12 Toronto E11 32 $35,381,500 $1,105,672 $1,000,500 35 15 104% 16 Municipality Number of Sales Dollar Volume Average Price Median Price New Listings Active Listings Avg. SP/LP Avg. LDOM DETACHED, JULY 2021 Toronto Regional Real Estate Board SUMMARY OF EXISTING HOME TRANSACTIONS CITY OF TORONTO MUNICIPAL BREAKDOWN 1 1 2 4 5 1 1 3 8 Market Watch, July 2021 Copyright® 2021 Toronto Regional Real Estate Board
- 9. TRREB Total 868 $892,212,791 $1,027,895 $962,053 992 442 107% 11 Halton Region 65 $64,155,100 $987,002 $965,000 61 20 106% 10 Burlington 15 $14,123,000 $941,533 $990,000 10 8 105% 15 Halton Hills 7 $5,619,100 $802,729 $808,100 8 4 112% 15 Milton 32 $31,596,000 $987,375 $946,000 26 3 105% 8 Oakville 11 $12,817,000 $1,165,182 $1,180,000 17 5 107% 7 Peel Region 306 $285,037,036 $931,494 $920,250 334 144 105% 10 Brampton 159 $143,497,900 $902,503 $900,000 192 88 105% 10 Caledon 7 $6,385,000 $912,143 $910,000 7 5 101% 9 Mississauga 140 $135,154,136 $965,387 $950,000 135 51 106% 9 City of Toronto 278 $335,216,312 $1,205,814 $1,080,500 392 217 106% 12 Toronto West 101 $109,303,691 $1,082,215 $979,000 120 66 106% 13 Toronto Central 75 $110,092,174 $1,467,896 $1,262,000 116 89 104% 15 Toronto East 102 $115,820,447 $1,135,495 $1,082,500 156 62 109% 10 York Region 140 $147,462,268 $1,053,302 $1,050,000 126 38 108% 12 Aurora 5 $4,351,000 $870,200 $895,000 5 4 104% 10 East Gwillimbury 4 $3,987,500 $996,875 $995,250 3 0 109% 16 Georgina 3 $1,950,000 $650,000 $610,000 3 0 104% 7 King 0 $0 $0 - 0 0 - - Markham 47 $54,157,226 $1,152,281 $1,102,800 43 9 112% 12 Newmarket 21 $18,395,120 $875,958 $860,000 23 6 109% 12 Richmond Hill 21 $23,382,100 $1,113,433 $1,057,000 18 10 105% 14 Vaughan 34 $36,397,322 $1,070,509 $1,057,500 28 7 106% 13 Whitchurch-Stouffville 5 $4,842,000 $968,400 $950,000 3 2 110% 9 Durham Region 61 $46,996,675 $770,437 $771,000 67 17 116% 7 Ajax 15 $12,833,798 $855,587 $856,000 17 5 117% 7 Brock 1 $430,000 $430,000 $430,000 0 0 108% 14 Clarington 5 $3,589,000 $717,800 $714,000 5 0 122% 3 Oshawa 26 $18,137,877 $697,611 $680,000 33 9 117% 6 Pickering 7 $6,247,000 $892,429 $900,000 7 3 113% 15 Scugog 1 $550,000 $550,000 $550,000 1 0 100% 7 Uxbridge 1 $949,900 $949,900 $949,900 0 0 100% 3 Whitby 5 $4,259,100 $851,820 $810,000 4 0 117% 7 Dufferin County 6 $3,987,000 $664,500 $655,000 2 2 99% 23 Orangeville 6 $3,987,000 $664,500 $655,000 2 2 99% 23 Simcoe County 12 $9,358,400 $779,867 $793,500 10 4 105% 18 Adjala-Tosorontio 1 $589,900 $589,900 $589,900 0 0 107% 14 Bradford West Gwillimbury 6 $4,922,500 $820,417 $860,000 7 2 109% 7 Essa 0 $0 $0 - 0 0 - - Innisfil 0 $0 $0 - 0 0 - - New Tecumseth 5 $3,846,000 $769,200 $785,000 3 2 100% 33 Municipality Number of Sales Dollar Volume Average Price Median Price New Listings Active Listings Avg. SP/LP Avg. LDOM SEMI-DETACHED, JULY 2021 Toronto Regional Real Estate Board SUMMARY OF EXISTING HOME TRANSACTIONS ALL TRREB AREAS 1 1 2 4 5 1 1 3 9 Market Watch, July 2021 Copyright® 2021 Toronto Regional Real Estate Board
- 10. TRREB Total 868 $892,212,791 $1,027,895 $962,053 992 442 107% 11 City of Toronto 278 $335,216,312 $1,205,814 $1,080,500 392 217 106% 12 Toronto West 101 $109,303,691 $1,082,215 $979,000 120 66 106% 13 Toronto W01 6 $8,659,400 $1,443,233 $1,392,200 8 4 103% 13 Toronto W02 30 $37,938,600 $1,264,620 $1,281,000 29 10 110% 13 Toronto W03 15 $14,980,500 $998,700 $968,000 30 25 108% 13 Toronto W04 2 $2,120,000 $1,060,000 $1,060,000 3 5 115% 7 Toronto W05 32 $29,963,199 $936,350 $938,500 28 14 103% 13 Toronto W06 3 $3,550,000 $1,183,333 $990,000 6 6 97% 33 Toronto W07 1 $999,999 $999,999 $999,999 1 0 111% 2 Toronto W08 2 $1,895,000 $947,500 $947,500 5 2 98% 6 Toronto W09 4 $3,837,105 $959,276 $943,553 4 0 104% 14 Toronto W10 6 $5,359,888 $893,315 $903,000 6 0 102% 13 Toronto Central 75 $110,092,174 $1,467,896 $1,262,000 116 89 104% 15 Toronto C01 22 $39,890,125 $1,813,188 $1,674,000 33 27 104% 13 Toronto C02 12 $21,631,000 $1,802,583 $1,578,500 23 17 103% 15 Toronto C03 7 $8,549,000 $1,221,286 $1,081,000 10 9 104% 11 Toronto C04 6 $9,670,549 $1,611,758 $1,561,275 2 0 99% 19 Toronto C06 0 $0 $0 - 1 2 - - Toronto C07 1 $1,082,000 $1,082,000 $1,082,000 3 3 120% 3 Toronto C08 2 $2,550,900 $1,275,450 $1,275,450 4 6 122% 3 Toronto C09 0 $0 $0 - 3 4 - - Toronto C10 1 $1,352,600 $1,352,600 $1,352,600 3 3 113% 2 Toronto C11 0 $0 $0 - 2 2 - - Toronto C12 0 $0 $0 - 1 1 - - Toronto C13 7 $7,708,000 $1,101,143 $1,050,000 8 4 104% 20 Toronto C14 0 $0 $0 - 1 2 - - Toronto C15 17 $17,658,000 $1,038,706 $1,066,000 22 9 101% 18 Toronto East 102 $115,820,447 $1,135,495 $1,082,500 156 62 109% 10 Toronto E01 27 $34,863,059 $1,291,224 $1,290,000 38 18 106% 12 Toronto E02 20 $25,786,000 $1,289,300 $1,305,000 35 10 117% 5 Toronto E03 18 $21,281,000 $1,182,278 $1,152,500 36 18 109% 9 Toronto E04 6 $5,696,988 $949,498 $914,050 11 3 106% 6 Toronto E05 5 $4,810,500 $962,100 $950,000 5 2 107% 13 Toronto E06 2 $2,100,000 $1,050,000 $1,050,000 3 3 108% 4 Toronto E07 10 $9,295,800 $929,580 $914,500 8 2 106% 20 Toronto E08 0 $0 $0 - 0 0 - - Toronto E09 2 $1,768,100 $884,050 $884,050 1 0 104% 12 Toronto E10 4 $3,412,000 $853,000 $842,500 8 3 110% 6 Toronto E11 8 $6,807,000 $850,875 $860,000 11 3 104% 12 Municipality Number of Sales Dollar Volume Average Price Median Price New Listings Active Listings Avg. SP/LP Avg. LDOM SEMI-DETACHED, JULY 2021 Toronto Regional Real Estate Board SUMMARY OF EXISTING HOME TRANSACTIONS CITY OF TORONTO MUNICIPAL BREAKDOWN 1 1 2 4 5 1 1 3 10 Market Watch, July 2021 Copyright® 2021 Toronto Regional Real Estate Board
- 11. TRREB Total 853 $810,382,784 $950,038 $898,787 997 507 106% 11 Halton Region 154 $144,160,147 $936,105 $917,500 165 67 105% 11 Burlington 21 $19,053,276 $907,299 $935,000 28 13 107% 8 Halton Hills 6 $5,571,000 $928,500 $847,500 7 2 109% 19 Milton 75 $64,208,896 $856,119 $862,000 79 24 105% 10 Oakville 52 $55,326,975 $1,063,980 $1,071,000 51 28 103% 12 Peel Region 190 $164,892,350 $867,854 $848,950 217 95 103% 12 Brampton 148 $124,921,350 $844,063 $833,750 158 63 103% 12 Caledon 19 $17,091,500 $899,553 $910,000 24 11 102% 12 Mississauga 23 $22,879,500 $994,761 $925,000 35 21 100% 14 City of Toronto 98 $114,934,026 $1,172,796 $1,072,500 152 128 107% 12 Toronto West 25 $26,521,165 $1,060,847 $998,000 34 29 104% 11 Toronto Central 30 $44,043,706 $1,468,124 $1,365,634 59 65 106% 15 Toronto East 43 $44,369,155 $1,031,841 $925,000 59 34 110% 11 York Region 230 $244,410,175 $1,062,653 $1,031,500 257 136 106% 12 Aurora 19 $18,884,013 $993,895 $970,125 14 5 109% 11 East Gwillimbury 7 $6,522,500 $931,786 $965,000 7 2 105% 12 Georgina 2 $1,452,000 $726,000 $726,000 2 0 108% 1 King 1 $1,205,000 $1,205,000 $1,205,000 3 3 101% 0 Markham 67 $74,852,989 $1,117,209 $1,082,000 70 35 108% 12 Newmarket 16 $14,507,088 $906,693 $902,500 20 13 102% 14 Richmond Hill 45 $50,287,210 $1,117,494 $1,100,000 55 31 107% 13 Vaughan 59 $63,913,375 $1,083,278 $1,080,000 74 44 105% 13 Whitchurch-Stouffville 14 $12,786,000 $913,286 $939,000 12 3 109% 9 Durham Region 141 $109,935,398 $779,684 $776,500 165 61 111% 9 Ajax 33 $26,839,732 $813,325 $820,000 45 17 109% 9 Brock 1 $605,000 $605,000 $605,000 1 0 116% 5 Clarington 26 $19,300,253 $742,317 $740,000 31 9 119% 7 Oshawa 29 $20,632,650 $711,471 $710,000 29 14 109% 16 Pickering 18 $14,658,000 $814,333 $798,000 20 7 107% 10 Scugog 0 $0 $0 - 0 5 - - Uxbridge 0 $0 $0 - 0 0 - - Whitby 34 $27,899,763 $820,581 $820,050 39 9 113% 6 Dufferin County 11 $8,395,901 $763,264 $765,000 10 6 106% 14 Orangeville 11 $8,395,901 $763,264 $765,000 10 6 106% 14 Simcoe County 29 $23,654,787 $815,682 $737,000 31 14 103% 10 Adjala-Tosorontio 0 $0 $0 - 0 0 - - Bradford West Gwillimbury 7 $5,831,787 $833,112 $841,000 9 4 106% 9 Essa 5 $3,255,500 $651,100 $640,000 6 1 105% 5 Innisfil 6 $6,581,500 $1,096,917 $822,500 9 8 101% 15 New Tecumseth 11 $7,986,000 $726,000 $710,000 7 1 102% 10 Municipality Number of Sales Dollar Volume Average Price Median Price New Listings Active Listings Avg. SP/LP Avg. LDOM ATT/ROW/TWNHOUSE, JULY 2021 Toronto Regional Real Estate Board SUMMARY OF EXISTING HOME TRANSACTIONS ALL TRREB AREAS 1 1 2 4 5 1 1 3 11 Market Watch, July 2021 Copyright® 2021 Toronto Regional Real Estate Board
- 12. TRREB Total 853 $810,382,784 $950,038 $898,787 997 507 106% 11 City of Toronto 98 $114,934,026 $1,172,796 $1,072,500 152 128 107% 12 Toronto West 25 $26,521,165 $1,060,847 $998,000 34 29 104% 11 Toronto W01 1 $1,125,000 $1,125,000 $1,125,000 0 0 102% 6 Toronto W02 7 $8,021,000 $1,145,857 $1,065,000 8 3 106% 12 Toronto W03 0 $0 $0 - 2 2 - - Toronto W04 0 $0 $0 - 1 1 - - Toronto W05 5 $4,362,500 $872,500 $885,000 6 13 103% 9 Toronto W06 4 $4,237,765 $1,059,441 $1,009,000 5 2 107% 10 Toronto W07 1 $1,315,000 $1,315,000 $1,315,000 4 2 101% 8 Toronto W08 2 $2,630,000 $1,315,000 $1,315,000 4 4 102% 6 Toronto W09 2 $2,169,000 $1,084,500 $1,084,500 1 2 99% 36 Toronto W10 3 $2,660,900 $886,967 $899,900 3 0 102% 4 Toronto Central 30 $44,043,706 $1,468,124 $1,365,634 59 65 106% 15 Toronto C01 15 $21,403,068 $1,426,871 $1,421,268 24 24 110% 17 Toronto C02 2 $4,000,000 $2,000,000 $2,000,000 7 6 106% 5 Toronto C03 0 $0 $0 - 1 1 - - Toronto C04 2 $1,920,638 $960,319 $960,319 4 7 99% 7 Toronto C06 0 $0 $0 - 0 0 - - Toronto C07 2 $2,355,000 $1,177,500 $1,177,500 4 4 95% 22 Toronto C08 3 $5,350,000 $1,783,333 $1,740,000 5 10 98% 30 Toronto C09 1 $2,595,000 $2,595,000 $2,595,000 1 0 98% 7 Toronto C10 0 $0 $0 - 0 0 - - Toronto C11 0 $0 $0 - 0 0 - - Toronto C12 0 $0 $0 - 0 3 - - Toronto C13 5 $6,420,000 $1,284,000 $1,260,000 5 1 111% 6 Toronto C14 0 $0 $0 - 8 9 - - Toronto C15 0 $0 $0 - 0 0 - - Toronto East 43 $44,369,155 $1,031,841 $925,000 59 34 110% 11 Toronto E01 6 $9,244,000 $1,540,667 $1,398,500 7 4 106% 25 Toronto E02 3 $3,459,617 $1,153,206 $1,130,617 3 1 112% 9 Toronto E03 3 $3,680,500 $1,226,833 $1,260,000 5 3 128% 7 Toronto E04 10 $9,316,850 $931,685 $920,000 16 13 103% 15 Toronto E05 4 $3,776,800 $944,200 $946,500 2 1 107% 12 Toronto E06 0 $0 $0 - 0 0 - - Toronto E07 6 $5,474,000 $912,333 $924,500 5 0 121% 5 Toronto E08 1 $880,000 $880,000 $880,000 3 3 98% 1 Toronto E09 0 $0 $0 - 1 1 - - Toronto E10 3 $2,752,388 $917,463 $922,500 5 3 103% 5 Toronto E11 7 $5,785,000 $826,429 $815,000 12 5 115% 7 Municipality Number of Sales Dollar Volume Average Price Median Price New Listings Active Listings Avg. SP/LP Avg. LDOM ATT/ROW/TWNHOUSE, JULY 2021 Toronto Regional Real Estate Board SUMMARY OF EXISTING HOME TRANSACTIONS CITY OF TORONTO MUNICIPAL BREAKDOWN 1 1 2 4 5 1 1 3 12 Market Watch, July 2021 Copyright® 2021 Toronto Regional Real Estate Board
- 13. TRREB Total 841 $629,432,242 $748,433 $725,000 1,062 743 104% 15 Halton Region 94 $69,199,087 $736,161 $710,500 109 58 104% 13 Burlington 44 $33,547,900 $762,452 $718,500 56 32 104% 13 Halton Hills 7 $4,517,000 $645,286 $650,000 7 1 107% 7 Milton 9 $6,030,000 $670,000 $660,000 7 3 102% 12 Oakville 34 $25,104,187 $738,358 $724,500 39 22 104% 14 Peel Region 290 $212,436,429 $732,539 $730,000 327 203 103% 13 Brampton 91 $60,127,949 $660,747 $655,049 85 60 102% 16 Caledon 1 $690,000 $690,000 $690,000 0 0 95% 30 Mississauga 198 $151,618,480 $765,750 $765,000 242 143 103% 12 City of Toronto 270 $213,817,639 $791,917 $755,000 378 316 104% 16 Toronto West 85 $61,787,568 $726,913 $715,000 116 103 102% 19 Toronto Central 89 $83,923,919 $942,965 $841,000 140 128 103% 15 Toronto East 96 $68,106,152 $709,439 $701,000 122 85 107% 14 York Region 94 $75,525,387 $803,462 $777,000 140 116 103% 17 Aurora 16 $12,686,888 $792,931 $745,000 20 14 103% 17 East Gwillimbury 0 $0 $0 - 0 0 - - Georgina 0 $0 $0 - 0 0 - - King 1 $1,110,000 $1,110,000 $1,110,000 2 0 99% 3 Markham 40 $31,875,600 $796,890 $762,500 65 43 106% 15 Newmarket 5 $3,675,000 $735,000 $730,000 8 4 100% 7 Richmond Hill 14 $11,298,000 $807,000 $868,000 24 29 103% 18 Vaughan 15 $12,757,899 $850,527 $825,000 18 25 100% 26 Whitchurch-Stouffville 3 $2,122,000 $707,333 $712,000 3 1 102% 13 Durham Region 89 $56,204,200 $631,508 $640,000 103 49 108% 13 Ajax 13 $8,546,000 $657,385 $650,000 4 1 104% 15 Brock 0 $0 $0 - 0 0 - - Clarington 6 $3,877,000 $646,167 $618,000 9 2 115% 6 Oshawa 31 $17,331,800 $559,090 $560,000 44 27 108% 16 Pickering 27 $18,604,900 $689,070 $685,000 34 16 107% 10 Scugog 0 $0 $0 - 0 0 - - Uxbridge 2 $1,342,000 $671,000 $671,000 1 0 113% 9 Whitby 10 $6,502,500 $650,250 $652,250 11 3 109% 18 Dufferin County 4 $2,249,500 $562,375 $548,750 4 0 105% 7 Orangeville 4 $2,249,500 $562,375 $548,750 4 0 105% 7 Simcoe County 0 $0 $0 - 1 1 - - Adjala-Tosorontio 0 $0 $0 - 0 0 - - Bradford West Gwillimbury 0 $0 $0 - 0 0 - - Essa 0 $0 $0 - 0 0 - - Innisfil 0 $0 $0 - 1 1 - - New Tecumseth 0 $0 $0 - 0 0 - - Municipality Number of Sales Dollar Volume Average Price Median Price New Listings Active Listings Avg. SP/LP Avg. LDOM CONDO TOWNHOUSE, JULY 2021 Toronto Regional Real Estate Board SUMMARY OF EXISTING HOME TRANSACTIONS ALL TRREB AREAS 1 1 2 4 5 1 1 3 13 Market Watch, July 2021 Copyright® 2021 Toronto Regional Real Estate Board
- 14. TRREB Total 841 $629,432,242 $748,433 $725,000 1,062 743 104% 15 City of Toronto 270 $213,817,639 $791,917 $755,000 378 316 104% 16 Toronto West 85 $61,787,568 $726,913 $715,000 116 103 102% 19 Toronto W01 2 $1,691,500 $845,750 $845,750 3 1 108% 13 Toronto W02 7 $6,023,500 $860,500 $880,000 10 7 104% 23 Toronto W03 3 $2,485,000 $828,333 $890,000 3 3 99% 9 Toronto W04 7 $4,752,000 $678,857 $665,000 18 24 104% 10 Toronto W05 32 $20,012,180 $625,381 $629,000 36 27 103% 23 Toronto W06 12 $10,469,500 $872,458 $862,500 19 18 102% 16 Toronto W07 0 $0 $0 - 0 0 - - Toronto W08 14 $10,658,888 $761,349 $784,500 13 12 102% 20 Toronto W09 4 $3,233,000 $808,250 $805,000 9 6 102% 9 Toronto W10 4 $2,462,000 $615,500 $635,000 5 5 101% 16 Toronto Central 89 $83,923,919 $942,965 $841,000 140 128 103% 15 Toronto C01 24 $24,547,208 $1,022,800 $910,000 33 25 102% 14 Toronto C02 1 $845,000 $845,000 $845,000 8 11 100% 2 Toronto C03 0 $0 $0 - 2 3 - - Toronto C04 0 $0 $0 - 1 1 - - Toronto C06 1 $500,000 $500,000 $500,000 3 2 104% 5 Toronto C07 11 $9,263,000 $842,091 $813,000 17 17 102% 14 Toronto C08 6 $4,834,000 $805,667 $783,500 10 12 103% 13 Toronto C09 1 $2,595,000 $2,595,000 $2,595,000 0 3 98% 92 Toronto C10 1 $775,000 $775,000 $775,000 0 2 99% 4 Toronto C11 3 $2,155,000 $718,333 $555,000 4 3 100% 15 Toronto C12 5 $7,223,411 $1,444,682 $1,465,411 3 3 102% 28 Toronto C13 3 $2,538,800 $846,267 $660,000 5 4 113% 2 Toronto C14 13 $12,046,000 $926,615 $815,000 15 9 105% 12 Toronto C15 20 $16,601,500 $830,075 $835,500 39 33 104% 14 Toronto East 96 $68,106,152 $709,439 $701,000 122 85 107% 14 Toronto E01 7 $6,372,500 $910,357 $875,000 9 6 105% 13 Toronto E02 4 $3,625,000 $906,250 $860,000 5 1 110% 8 Toronto E03 1 $640,000 $640,000 $640,000 1 2 98% 25 Toronto E04 12 $7,995,088 $666,257 $637,450 15 7 106% 9 Toronto E05 18 $13,050,588 $725,033 $722,000 20 15 110% 19 Toronto E06 0 $0 $0 - 1 1 - - Toronto E07 6 $4,519,088 $753,181 $760,000 9 7 107% 14 Toronto E08 7 $5,268,000 $752,571 $800,000 7 2 106% 11 Toronto E09 9 $5,813,000 $645,889 $685,000 15 11 105% 15 Toronto E10 13 $8,700,888 $669,299 $675,000 13 13 108% 15 Toronto E11 19 $12,122,000 $638,000 $630,000 27 20 106% 13 Municipality Number of Sales Dollar Volume Average Price Median Price New Listings Active Listings Avg. SP/LP Avg. LDOM CONDO TOWNHOUSE, JULY 2021 Toronto Regional Real Estate Board SUMMARY OF EXISTING HOME TRANSACTIONS CITY OF TORONTO MUNICIPAL BREAKDOWN 1 1 2 4 5 1 1 3 14 Market Watch, July 2021 Copyright® 2021 Toronto Regional Real Estate Board
- 15. TRREB Total 2,614 $1,763,118,003 $674,490 $615,000 4,199 4,009 101% 18 Halton Region 125 $75,274,329 $602,195 $588,000 174 134 100% 16 Burlington 47 $26,146,600 $556,311 $535,000 70 53 100% 15 Halton Hills 2 $1,017,000 $508,500 $508,500 4 4 101% 8 Milton 26 $15,375,179 $591,353 $592,500 28 18 102% 19 Oakville 50 $32,735,550 $654,711 $598,500 72 59 100% 16 Peel Region 358 $203,372,453 $568,079 $550,000 532 468 100% 19 Brampton 60 $30,891,900 $514,865 $498,500 104 78 101% 19 Caledon 1 $711,000 $711,000 $711,000 2 3 98% 28 Mississauga 297 $171,769,553 $578,349 $555,000 426 387 100% 18 City of Toronto 1,756 $1,257,256,480 $715,977 $640,500 2,971 2,919 101% 17 Toronto West 329 $214,599,293 $652,277 $599,000 577 586 101% 18 Toronto Central 1,205 $913,309,726 $757,933 $675,000 2,025 2,010 101% 18 Toronto East 222 $129,347,461 $582,646 $550,000 369 323 103% 16 York Region 304 $192,561,597 $633,426 $619,000 435 411 102% 17 Aurora 9 $5,309,000 $589,889 $556,000 15 13 104% 7 East Gwillimbury 0 $0 $0 - 0 0 - - Georgina 0 $0 $0 - 0 1 - - King 5 $2,694,900 $538,980 $535,000 5 3 101% 8 Markham 105 $68,728,838 $654,560 $638,000 135 107 104% 14 Newmarket 6 $3,330,400 $555,067 $557,750 7 4 102% 17 Richmond Hill 82 $50,104,576 $611,031 $615,000 107 91 102% 19 Vaughan 93 $59,587,883 $640,730 $612,500 159 184 100% 20 Whitchurch-Stouffville 4 $2,806,000 $701,500 $652,500 7 8 100% 16 Durham Region 54 $25,014,744 $463,236 $482,500 72 59 105% 19 Ajax 1 $485,000 $485,000 $485,000 8 7 97% 65 Brock 0 $0 $0 - 0 0 - - Clarington 13 $6,474,700 $498,054 $499,900 17 14 104% 15 Oshawa 16 $5,269,700 $329,356 $325,000 18 21 102% 27 Pickering 20 $10,826,044 $541,302 $534,500 18 9 105% 15 Scugog 0 $0 $0 - 0 0 - - Uxbridge 2 $1,041,300 $520,650 $520,650 5 4 118% 10 Whitby 2 $918,000 $459,000 $459,000 6 4 104% 16 Dufferin County 4 $1,478,400 $369,600 $349,250 2 0 101% 19 Orangeville 4 $1,478,400 $369,600 $349,250 2 0 101% 19 Simcoe County 13 $8,160,000 $627,692 $658,000 13 18 99% 25 Adjala-Tosorontio 0 $0 $0 - 0 0 - - Bradford West Gwillimbury 2 $849,000 $424,500 $424,500 1 0 100% 29 Essa 0 $0 $0 - 0 0 - - Innisfil 7 $5,106,000 $729,429 $780,000 7 10 99% 22 New Tecumseth 4 $2,205,000 $551,250 $550,000 5 8 101% 28 Municipality Number of Sales Dollar Volume Average Price Median Price New Listings Active Listings Avg. SP/LP Avg. LDOM CONDO APT, JULY 2021 Toronto Regional Real Estate Board SUMMARY OF EXISTING HOME TRANSACTIONS ALL TRREB AREAS 1 1 2 4 5 1 1 3 15 Market Watch, July 2021 Copyright® 2021 Toronto Regional Real Estate Board
- 16. TRREB Total 2,614 $1,763,118,003 $674,490 $615,000 4,199 4,009 101% 18 City of Toronto 1,756 $1,257,256,480 $715,977 $640,500 2,971 2,919 101% 17 Toronto West 329 $214,599,293 $652,277 $599,000 577 586 101% 18 Toronto W01 23 $18,631,848 $810,080 $790,000 50 34 103% 12 Toronto W02 23 $17,661,300 $767,883 $690,000 45 25 106% 8 Toronto W03 7 $3,903,500 $557,643 $510,000 5 8 100% 19 Toronto W04 30 $16,368,200 $545,607 $538,500 45 47 103% 18 Toronto W05 20 $9,283,000 $464,150 $466,500 41 60 101% 18 Toronto W06 95 $72,532,680 $763,502 $683,000 174 186 101% 18 Toronto W07 3 $1,913,000 $637,667 $658,000 7 8 103% 12 Toronto W08 91 $54,712,365 $601,235 $580,000 136 137 100% 19 Toronto W09 15 $8,528,400 $568,560 $580,000 20 28 99% 27 Toronto W10 22 $11,065,000 $502,955 $507,500 54 53 102% 19 Toronto Central 1,205 $913,309,726 $757,933 $675,000 2,025 2,010 101% 18 Toronto C01 463 $352,099,172 $760,473 $695,000 760 725 101% 19 Toronto C02 57 $78,957,800 $1,385,225 $821,000 116 164 99% 17 Toronto C03 11 $7,590,888 $690,081 $690,000 46 47 101% 12 Toronto C04 20 $15,010,400 $750,520 $565,000 30 37 98% 25 Toronto C06 20 $11,994,500 $599,725 $590,000 32 31 101% 14 Toronto C07 48 $32,632,800 $679,850 $690,000 98 104 101% 14 Toronto C08 236 $169,037,481 $716,261 $670,000 413 398 103% 18 Toronto C09 11 $11,654,888 $1,059,535 $953,000 20 34 99% 23 Toronto C10 68 $51,151,713 $752,231 $672,000 91 98 101% 21 Toronto C11 26 $15,489,257 $595,741 $536,500 46 42 102% 17 Toronto C12 7 $6,524,000 $932,000 $830,000 12 10 101% 11 Toronto C13 24 $16,415,000 $683,958 $583,500 46 53 100% 20 Toronto C14 103 $72,074,776 $699,755 $675,000 144 121 103% 14 Toronto C15 111 $72,677,051 $654,748 $605,000 171 146 102% 16 Toronto East 222 $129,347,461 $582,646 $550,000 369 323 103% 16 Toronto E01 20 $15,980,125 $799,006 $772,500 27 26 103% 16 Toronto E02 12 $9,933,500 $827,792 $638,750 21 20 102% 21 Toronto E03 10 $5,703,000 $570,300 $480,000 27 27 99% 17 Toronto E04 28 $14,380,500 $513,589 $512,500 47 32 104% 14 Toronto E05 32 $18,234,700 $569,834 $568,000 48 44 106% 17 Toronto E06 5 $3,586,500 $717,300 $675,000 10 21 99% 21 Toronto E07 29 $15,856,668 $546,782 $550,000 59 51 103% 18 Toronto E08 13 $7,264,000 $558,769 $542,000 34 30 101% 10 Toronto E09 47 $26,002,068 $553,235 $541,880 56 42 102% 17 Toronto E10 8 $3,298,300 $412,288 $427,000 7 8 100% 19 Toronto E11 18 $9,108,100 $506,006 $492,500 33 22 104% 14 Municipality Number of Sales Dollar Volume Average Price Median Price New Listings Active Listings Avg. SP/LP Avg. LDOM CONDO APT, JULY 2021 Toronto Regional Real Estate Board SUMMARY OF EXISTING HOME TRANSACTIONS CITY OF TORONTO MUNICIPAL BREAKDOWN 1 1 2 4 5 1 1 3 16 Market Watch, July 2021 Copyright® 2021 Toronto Regional Real Estate Board
- 17. TRREB Total 71 $71,815,438 $1,011,485 $985,000 70 24 109% 10 Halton Region 12 $12,631,620 $1,052,635 $1,024,000 12 3 105% 11 Burlington 4 $3,645,000 $911,250 $912,500 4 0 105% 10 Halton Hills 0 $0 $0 - 0 0 - - Milton 0 $0 $0 - 0 0 - - Oakville 8 $8,986,620 $1,123,328 $1,107,500 8 3 105% 11 Peel Region 9 $7,670,900 $852,322 $835,000 5 3 100% 11 Brampton 6 $4,965,900 $827,650 $801,200 4 3 100% 11 Caledon 1 $835,000 $835,000 $835,000 0 0 95% 13 Mississauga 2 $1,870,000 $935,000 $935,000 1 0 104% 9 City of Toronto 8 $8,603,000 $1,075,375 $1,149,000 9 5 113% 10 Toronto West 1 $775,000 $775,000 $775,000 1 0 111% 1 Toronto Central 2 $2,298,000 $1,149,000 $1,149,000 1 0 112% 17 Toronto East 5 $5,530,000 $1,106,000 $1,190,000 7 5 114% 9 York Region 23 $27,419,600 $1,192,157 $1,175,000 24 10 109% 9 Aurora 1 $1,143,000 $1,143,000 $1,143,000 2 1 114% 2 East Gwillimbury 0 $0 $0 - 0 0 - - Georgina 0 $0 $0 - 0 0 - - King 0 $0 $0 - 0 0 - - Markham 15 $17,926,600 $1,195,107 $1,168,000 15 5 113% 7 Newmarket 0 $0 $0 - 0 0 - - Richmond Hill 3 $3,770,000 $1,256,667 $1,255,000 5 3 104% 13 Vaughan 3 $3,735,000 $1,245,000 $1,275,000 2 1 97% 17 Whitchurch-Stouffville 1 $845,000 $845,000 $845,000 0 0 106% 9 Durham Region 13 $10,677,418 $821,340 $825,000 16 3 116% 6 Ajax 0 $0 $0 - 1 1 - - Brock 0 $0 $0 - 0 0 - - Clarington 4 $3,256,000 $814,000 $817,500 4 1 114% 7 Oshawa 4 $2,935,418 $733,855 $730,209 4 0 122% 7 Pickering 0 $0 $0 - 0 0 - - Scugog 0 $0 $0 - 0 0 - - Uxbridge 0 $0 $0 - 0 0 - - Whitby 5 $4,486,000 $897,200 $905,000 7 1 114% 4 Dufferin County 0 $0 $0 - 0 0 - - Orangeville 0 $0 $0 - 0 0 - - Simcoe County 6 $4,812,900 $802,150 $791,500 4 0 105% 16 Adjala-Tosorontio 0 $0 $0 - 0 0 - - Bradford West Gwillimbury 2 $1,663,000 $831,500 $831,500 1 0 107% 10 Essa 1 $739,900 $739,900 $739,900 1 0 100% 7 Innisfil 1 $755,000 $755,000 $755,000 1 0 101% 18 New Tecumseth 2 $1,655,000 $827,500 $827,500 1 0 108% 24 Municipality Number of Sales Dollar Volume Average Price Median Price New Listings Active Listings Avg. SP/LP Avg. LDOM LINK, JULY 2021 Toronto Regional Real Estate Board SUMMARY OF EXISTING HOME TRANSACTIONS ALL TRREB AREAS 1 1 2 4 5 1 1 3 17 Market Watch, July 2021 Copyright® 2021 Toronto Regional Real Estate Board
- 18. TRREB Total 71 $71,815,438 $1,011,485 $985,000 70 24 109% 10 City of Toronto 8 $8,603,000 $1,075,375 $1,149,000 9 5 113% 10 Toronto West 1 $775,000 $775,000 $775,000 1 0 111% 1 Toronto W01 0 $0 $0 - 0 0 - - Toronto W02 0 $0 $0 - 0 0 - - Toronto W03 0 $0 $0 - 0 0 - - Toronto W04 0 $0 $0 - 0 0 - - Toronto W05 0 $0 $0 - 0 0 - - Toronto W06 0 $0 $0 - 0 0 - - Toronto W07 0 $0 $0 - 0 0 - - Toronto W08 0 $0 $0 - 0 0 - - Toronto W09 0 $0 $0 - 0 0 - - Toronto W10 1 $775,000 $775,000 $775,000 1 0 111% 1 Toronto Central 2 $2,298,000 $1,149,000 $1,149,000 1 0 112% 17 Toronto C01 0 $0 $0 - 0 0 - - Toronto C02 0 $0 $0 - 0 0 - - Toronto C03 0 $0 $0 - 0 0 - - Toronto C04 0 $0 $0 - 0 0 - - Toronto C06 0 $0 $0 - 0 0 - - Toronto C07 0 $0 $0 - 0 0 - - Toronto C08 0 $0 $0 - 0 0 - - Toronto C09 0 $0 $0 - 0 0 - - Toronto C10 0 $0 $0 - 0 0 - - Toronto C11 0 $0 $0 - 0 0 - - Toronto C12 0 $0 $0 - 0 0 - - Toronto C13 0 $0 $0 - 0 0 - - Toronto C14 0 $0 $0 - 0 0 - - Toronto C15 2 $2,298,000 $1,149,000 $1,149,000 1 0 112% 17 Toronto East 5 $5,530,000 $1,106,000 $1,190,000 7 5 114% 9 Toronto E01 0 $0 $0 - 0 0 - - Toronto E02 0 $0 $0 - 0 0 - - Toronto E03 0 $0 $0 - 0 0 - - Toronto E04 0 $0 $0 - 0 0 - - Toronto E05 2 $2,440,000 $1,220,000 $1,220,000 3 3 122% 8 Toronto E06 0 $0 $0 - 0 0 - - Toronto E07 2 $2,158,000 $1,079,000 $1,079,000 3 2 100% 11 Toronto E08 0 $0 $0 - 0 0 - - Toronto E09 0 $0 $0 - 0 0 - - Toronto E10 0 $0 $0 - 0 0 - - Toronto E11 1 $932,000 $932,000 $932,000 1 0 133% 6 Municipality Number of Sales Dollar Volume Average Price Median Price New Listings Active Listings Avg. SP/LP Avg. LDOM LINK, JULY 2021 Toronto Regional Real Estate Board SUMMARY OF EXISTING HOME TRANSACTIONS CITY OF TORONTO MUNICIPAL BREAKDOWN 1 1 2 4 5 1 1 3 18 Market Watch, July 2021 Copyright® 2021 Toronto Regional Real Estate Board
- 19. TRREB Total 6 $3,245,900 $540,983 $455,000 17 23 99% 22 Halton Region 1 $550,000 $550,000 $550,000 4 3 100% 3 Burlington 0 $0 $0 - 1 1 - - Halton Hills 0 $0 $0 - 1 1 - - Milton 1 $550,000 $550,000 $550,000 2 1 100% 3 Oakville 0 $0 $0 - 0 0 - - Peel Region 0 $0 $0 - 1 2 - - Brampton 0 $0 $0 - 0 0 - - Caledon 0 $0 $0 - 0 0 - - Mississauga 0 $0 $0 - 1 2 - - City of Toronto 5 $2,695,900 $539,180 $360,000 12 17 99% 26 Toronto West 2 $715,900 $357,950 $357,950 3 4 96% 36 Toronto Central 2 $1,760,000 $880,000 $880,000 5 10 100% 27 Toronto East 1 $220,000 $220,000 $220,000 4 3 100% 3 York Region 0 $0 $0 - 0 0 - - Aurora 0 $0 $0 - 0 0 - - East Gwillimbury 0 $0 $0 - 0 0 - - Georgina 0 $0 $0 - 0 0 - - King 0 $0 $0 - 0 0 - - Markham 0 $0 $0 - 0 0 - - Newmarket 0 $0 $0 - 0 0 - - Richmond Hill 0 $0 $0 - 0 0 - - Vaughan 0 $0 $0 - 0 0 - - Whitchurch-Stouffville 0 $0 $0 - 0 0 - - Durham Region 0 $0 $0 - 0 1 - - Ajax 0 $0 $0 - 0 0 - - Brock 0 $0 $0 - 0 0 - - Clarington 0 $0 $0 - 0 0 - - Oshawa 0 $0 $0 - 0 0 - - Pickering 0 $0 $0 - 0 1 - - Scugog 0 $0 $0 - 0 0 - - Uxbridge 0 $0 $0 - 0 0 - - Whitby 0 $0 $0 - 0 0 - - Dufferin County 0 $0 $0 - 0 0 - - Orangeville 0 $0 $0 - 0 0 - - Simcoe County 0 $0 $0 - 0 0 - - Adjala-Tosorontio 0 $0 $0 - 0 0 - - Bradford West Gwillimbury 0 $0 $0 - 0 0 - - Essa 0 $0 $0 - 0 0 - - Innisfil 0 $0 $0 - 0 0 - - New Tecumseth 0 $0 $0 - 0 0 - - Municipality Number of Sales Dollar Volume Average Price Median Price New Listings Active Listings Avg. SP/LP Avg. LDOM CO-OP APT, JULY 2021 Toronto Regional Real Estate Board SUMMARY OF EXISTING HOME TRANSACTIONS ALL TRREB AREAS 1 1 2 4 5 1 1 3 19 Market Watch, July 2021 Copyright® 2021 Toronto Regional Real Estate Board
- 20. TRREB Total 6 $3,245,900 $540,983 $455,000 17 23 99% 22 City of Toronto 5 $2,695,900 $539,180 $360,000 12 17 99% 26 Toronto West 2 $715,900 $357,950 $357,950 3 4 96% 36 Toronto W01 0 $0 $0 - 0 0 - - Toronto W02 0 $0 $0 - 0 0 - - Toronto W03 0 $0 $0 - 0 0 - - Toronto W04 0 $0 $0 - 0 0 - - Toronto W05 0 $0 $0 - 0 0 - - Toronto W06 1 $355,900 $355,900 $355,900 2 3 96% 39 Toronto W07 0 $0 $0 - 0 0 - - Toronto W08 1 $360,000 $360,000 $360,000 1 1 96% 32 Toronto W09 0 $0 $0 - 0 0 - - Toronto W10 0 $0 $0 - 0 0 - - Toronto Central 2 $1,760,000 $880,000 $880,000 5 10 100% 27 Toronto C01 0 $0 $0 - 0 0 - - Toronto C02 0 $0 $0 - 3 3 - - Toronto C03 0 $0 $0 - 0 0 - - Toronto C04 0 $0 $0 - 0 0 - - Toronto C06 0 $0 $0 - 0 0 - - Toronto C07 0 $0 $0 - 0 0 - - Toronto C08 0 $0 $0 - 0 0 - - Toronto C09 2 $1,760,000 $880,000 $880,000 2 5 100% 27 Toronto C10 0 $0 $0 - 0 1 - - Toronto C11 0 $0 $0 - 0 0 - - Toronto C12 0 $0 $0 - 0 0 - - Toronto C13 0 $0 $0 - 0 0 - - Toronto C14 0 $0 $0 - 0 0 - - Toronto C15 0 $0 $0 - 0 1 - - Toronto East 1 $220,000 $220,000 $220,000 4 3 100% 3 Toronto E01 0 $0 $0 - 0 0 - - Toronto E02 0 $0 $0 - 1 1 - - Toronto E03 0 $0 $0 - 0 0 - - Toronto E04 0 $0 $0 - 1 1 - - Toronto E05 0 $0 $0 - 0 0 - - Toronto E06 0 $0 $0 - 0 0 - - Toronto E07 0 $0 $0 - 0 0 - - Toronto E08 0 $0 $0 - 0 0 - - Toronto E09 0 $0 $0 - 0 0 - - Toronto E10 1 $220,000 $220,000 $220,000 2 1 100% 3 Toronto E11 0 $0 $0 - 0 0 - - Municipality Number of Sales Dollar Volume Average Price Median Price New Listings Active Listings Avg. SP/LP Avg. LDOM CO-OP APT, JULY 2021 Toronto Regional Real Estate Board SUMMARY OF EXISTING HOME TRANSACTIONS CITY OF TORONTO MUNICIPAL BREAKDOWN 1 1 2 4 5 1 1 3 20 Market Watch, July 2021 Copyright® 2021 Toronto Regional Real Estate Board
- 21. TRREB Total 12 $10,329,000 $860,750 $781,500 7 9 103% 14 Halton Region 2 $1,835,000 $917,500 $917,500 1 0 102% 15 Burlington 2 $1,835,000 $917,500 $917,500 1 0 102% 15 Halton Hills 0 $0 $0 - 0 0 - - Milton 0 $0 $0 - 0 0 - - Oakville 0 $0 $0 - 0 0 - - Peel Region 4 $4,539,000 $1,134,750 $1,105,000 1 2 103% 19 Brampton 2 $1,688,000 $844,000 $844,000 1 2 105% 26 Caledon 2 $2,851,000 $1,425,500 $1,425,500 0 0 102% 12 Mississauga 0 $0 $0 - 0 0 - - City of Toronto 0 $0 $0 - 0 3 - - Toronto West 0 $0 $0 - 0 0 - - Toronto Central 0 $0 $0 - 0 2 - - Toronto East 0 $0 $0 - 0 1 - - York Region 0 $0 $0 - 0 2 - - Aurora 0 $0 $0 - 0 0 - - East Gwillimbury 0 $0 $0 - 0 0 - - Georgina 0 $0 $0 - 0 0 - - King 0 $0 $0 - 0 0 - - Markham 0 $0 $0 - 0 2 - - Newmarket 0 $0 $0 - 0 0 - - Richmond Hill 0 $0 $0 - 0 0 - - Vaughan 0 $0 $0 - 0 0 - - Whitchurch-Stouffville 0 $0 $0 - 0 0 - - Durham Region 3 $1,930,000 $643,333 $635,000 3 0 107% 7 Ajax 3 $1,930,000 $643,333 $635,000 3 0 107% 7 Brock 0 $0 $0 - 0 0 - - Clarington 0 $0 $0 - 0 0 - - Oshawa 0 $0 $0 - 0 0 - - Pickering 0 $0 $0 - 0 0 - - Scugog 0 $0 $0 - 0 0 - - Uxbridge 0 $0 $0 - 0 0 - - Whitby 0 $0 $0 - 0 0 - - Dufferin County 0 $0 $0 - 0 0 - - Orangeville 0 $0 $0 - 0 0 - - Simcoe County 3 $2,025,000 $675,000 $665,000 2 2 98% 13 Adjala-Tosorontio 0 $0 $0 - 0 0 - - Bradford West Gwillimbury 0 $0 $0 - 0 0 - - Essa 0 $0 $0 - 0 0 - - Innisfil 0 $0 $0 - 0 0 - - New Tecumseth 3 $2,025,000 $675,000 $665,000 2 2 98% 13 Municipality Number of Sales Dollar Volume Average Price Median Price New Listings Active Listings Avg. SP/LP Avg. LDOM DET CONDO, JULY 2021 Toronto Regional Real Estate Board SUMMARY OF EXISTING HOME TRANSACTIONS ALL TRREB AREAS 1 1 2 4 5 1 1 3 21 Market Watch, July 2021 Copyright® 2021 Toronto Regional Real Estate Board
- 22. TRREB Total 12 $10,329,000 $860,750 $781,500 7 9 103% 14 City of Toronto 0 $0 $0 - 0 3 - - Toronto West 0 $0 $0 - 0 0 - - Toronto W01 0 $0 $0 - 0 0 - - Toronto W02 0 $0 $0 - 0 0 - - Toronto W03 0 $0 $0 - 0 0 - - Toronto W04 0 $0 $0 - 0 0 - - Toronto W05 0 $0 $0 - 0 0 - - Toronto W06 0 $0 $0 - 0 0 - - Toronto W07 0 $0 $0 - 0 0 - - Toronto W08 0 $0 $0 - 0 0 - - Toronto W09 0 $0 $0 - 0 0 - - Toronto W10 0 $0 $0 - 0 0 - - Toronto Central 0 $0 $0 - 0 2 - - Toronto C01 0 $0 $0 - 0 0 - - Toronto C02 0 $0 $0 - 0 0 - - Toronto C03 0 $0 $0 - 0 0 - - Toronto C04 0 $0 $0 - 0 0 - - Toronto C06 0 $0 $0 - 0 0 - - Toronto C07 0 $0 $0 - 0 0 - - Toronto C08 0 $0 $0 - 0 0 - - Toronto C09 0 $0 $0 - 0 1 - - Toronto C10 0 $0 $0 - 0 0 - - Toronto C11 0 $0 $0 - 0 0 - - Toronto C12 0 $0 $0 - 0 1 - - Toronto C13 0 $0 $0 - 0 0 - - Toronto C14 0 $0 $0 - 0 0 - - Toronto C15 0 $0 $0 - 0 0 - - Toronto East 0 $0 $0 - 0 1 - - Toronto E01 0 $0 $0 - 0 0 - - Toronto E02 0 $0 $0 - 0 0 - - Toronto E03 0 $0 $0 - 0 0 - - Toronto E04 0 $0 $0 - 0 0 - - Toronto E05 0 $0 $0 - 0 0 - - Toronto E06 0 $0 $0 - 0 0 - - Toronto E07 0 $0 $0 - 0 0 - - Toronto E08 0 $0 $0 - 0 1 - - Toronto E09 0 $0 $0 - 0 0 - - Toronto E10 0 $0 $0 - 0 0 - - Toronto E11 0 $0 $0 - 0 0 - - Municipality Number of Sales Dollar Volume Average Price Median Price New Listings Active Listings Avg. SP/LP Avg. LDOM DET CONDO, JULY 2021 Toronto Regional Real Estate Board SUMMARY OF EXISTING HOME TRANSACTIONS CITY OF TORONTO MUNICIPAL BREAKDOWN 1 1 2 4 5 1 1 3 22 Market Watch, July 2021 Copyright® 2021 Toronto Regional Real Estate Board
- 23. TRREB Total 4 $2,077,000 $519,250 $550,000 7 13 97% 27 Halton Region 0 $0 $0 - 0 0 - - Burlington 0 $0 $0 - 0 0 - - Halton Hills 0 $0 $0 - 0 0 - - Milton 0 $0 $0 - 0 0 - - Oakville 0 $0 $0 - 0 0 - - Peel Region 0 $0 $0 - 0 0 - - Brampton 0 $0 $0 - 0 0 - - Caledon 0 $0 $0 - 0 0 - - Mississauga 0 $0 $0 - 0 0 - - City of Toronto 4 $2,077,000 $519,250 $550,000 7 13 97% 27 Toronto West 1 $290,000 $290,000 $290,000 1 1 97% 25 Toronto Central 2 $1,187,000 $593,500 $593,500 6 12 96% 40 Toronto East 1 $600,000 $600,000 $600,000 0 0 99% 4 York Region 0 $0 $0 - 0 0 - - Aurora 0 $0 $0 - 0 0 - - East Gwillimbury 0 $0 $0 - 0 0 - - Georgina 0 $0 $0 - 0 0 - - King 0 $0 $0 - 0 0 - - Markham 0 $0 $0 - 0 0 - - Newmarket 0 $0 $0 - 0 0 - - Richmond Hill 0 $0 $0 - 0 0 - - Vaughan 0 $0 $0 - 0 0 - - Whitchurch-Stouffville 0 $0 $0 - 0 0 - - Durham Region 0 $0 $0 - 0 0 - - Ajax 0 $0 $0 - 0 0 - - Brock 0 $0 $0 - 0 0 - - Clarington 0 $0 $0 - 0 0 - - Oshawa 0 $0 $0 - 0 0 - - Pickering 0 $0 $0 - 0 0 - - Scugog 0 $0 $0 - 0 0 - - Uxbridge 0 $0 $0 - 0 0 - - Whitby 0 $0 $0 - 0 0 - - Dufferin County 0 $0 $0 - 0 0 - - Orangeville 0 $0 $0 - 0 0 - - Simcoe County 0 $0 $0 - 0 0 - - Adjala-Tosorontio 0 $0 $0 - 0 0 - - Bradford West Gwillimbury 0 $0 $0 - 0 0 - - Essa 0 $0 $0 - 0 0 - - Innisfil 0 $0 $0 - 0 0 - - New Tecumseth 0 $0 $0 - 0 0 - - Municipality Number of Sales Dollar Volume Average Price Median Price New Listings Active Listings Avg. SP/LP Avg. LDOM CO-OWNERSHIP APT, JULY 2021 Toronto Regional Real Estate Board SUMMARY OF EXISTING HOME TRANSACTIONS ALL TRREB AREAS 1 1 2 4 5 1 1 3 23 Market Watch, July 2021 Copyright® 2021 Toronto Regional Real Estate Board
- 24. TRREB Total 4 $2,077,000 $519,250 $550,000 7 13 97% 27 City of Toronto 4 $2,077,000 $519,250 $550,000 7 13 97% 27 Toronto West 1 $290,000 $290,000 $290,000 1 1 97% 25 Toronto W01 0 $0 $0 - 0 0 - - Toronto W02 0 $0 $0 - 0 0 - - Toronto W03 0 $0 $0 - 0 0 - - Toronto W04 0 $0 $0 - 0 0 - - Toronto W05 1 $290,000 $290,000 $290,000 0 0 97% 25 Toronto W06 0 $0 $0 - 0 0 - - Toronto W07 0 $0 $0 - 0 0 - - Toronto W08 0 $0 $0 - 0 0 - - Toronto W09 0 $0 $0 - 1 1 - - Toronto W10 0 $0 $0 - 0 0 - - Toronto Central 2 $1,187,000 $593,500 $593,500 6 12 96% 40 Toronto C01 0 $0 $0 - 1 1 - - Toronto C02 0 $0 $0 - 1 3 - - Toronto C03 1 $687,000 $687,000 $687,000 1 2 96% 24 Toronto C04 1 $500,000 $500,000 $500,000 0 1 96% 56 Toronto C06 0 $0 $0 - 0 0 - - Toronto C07 0 $0 $0 - 0 0 - - Toronto C08 0 $0 $0 - 3 3 - - Toronto C09 0 $0 $0 - 0 0 - - Toronto C10 0 $0 $0 - 0 2 - - Toronto C11 0 $0 $0 - 0 0 - - Toronto C12 0 $0 $0 - 0 0 - - Toronto C13 0 $0 $0 - 0 0 - - Toronto C14 0 $0 $0 - 0 0 - - Toronto C15 0 $0 $0 - 0 0 - - Toronto East 1 $600,000 $600,000 $600,000 0 0 99% 4 Toronto E01 0 $0 $0 - 0 0 - - Toronto E02 1 $600,000 $600,000 $600,000 0 0 99% 4 Toronto E03 0 $0 $0 - 0 0 - - Toronto E04 0 $0 $0 - 0 0 - - Toronto E05 0 $0 $0 - 0 0 - - Toronto E06 0 $0 $0 - 0 0 - - Toronto E07 0 $0 $0 - 0 0 - - Toronto E08 0 $0 $0 - 0 0 - - Toronto E09 0 $0 $0 - 0 0 - - Toronto E10 0 $0 $0 - 0 0 - - Toronto E11 0 $0 $0 - 0 0 - - Municipality Number of Sales Dollar Volume Average Price Median Price New Listings Active Listings Avg. SP/LP Avg. LDOM CO-OWNERSHIP APT, JULY 2021 Toronto Regional Real Estate Board SUMMARY OF EXISTING HOME TRANSACTIONS CITY OF TORONTO MUNICIPAL BREAKDOWN 1 1 2 4 5 1 1 3 24 Market Watch, July 2021 Copyright® 2021 Toronto Regional Real Estate Board
- 25. 345.1 $1,054,300 18.06% 348.1 $1,302,300 22.61% 359.9 $1,013,800 21.59% 346.5 $745,900 17.18% 322.9 $639,400 8.14% 371.0 $1,142,700 22.97% 369.1 $1,346,900 23.73% 384.2 $972,400 25.27% 373.1 $718,900 19.05% 347.7 $658,000 15.48% 380.7 $1,098,400 22.85% 387.5 $1,333,700 25.65% 418.0 $1,019,100 27.67% 378.7 $707,700 19.96% 354.5 $585,200 15.47% 361.3 $1,065,700 22.93% 352.6 $1,150,000 23.03% 375.4 $836,500 25.13% 394.9 $628,700 21.81% 351.6 $536,900 17.87% 363.9 $1,107,600 26.84% 358.8 $1,321,600 25.94% 372.9 $898,900 25.77% 358.8 $615,400 18.42% 329.5 $677,900 15.45% 367.8 $1,242,100 21.07% 364.9 $1,479,600 21.55% 382.4 $1,066,000 24.36% 364.4 $827,600 17.93% 344.7 $688,600 15.17% 341.2 $967,000 18.72% 337.0 $1,193,500 22.23% 349.0 $891,800 21.90% 344.7 $728,800 16.93% 332.8 $569,100 8.33% 347.5 $885,100 20.79% 339.2 $999,400 21.93% 354.7 $828,400 22.14% 353.6 $639,400 19.54% 323.6 $477,300 8.26% 322.9 $1,180,000 32.07% 327.9 $1,246,400 33.24% 350.9 $866,900 25.77% 304.3 $658,700 16.46% - - - 337.1 $995,200 15.76% 336.0 $1,342,000 20.65% 338.2 $932,700 20.83% 341.3 $754,300 15.81% 334.6 $587,400 8.35% 334.4 $1,102,600 10.14% 339.3 $1,533,100 14.67% 360.5 $1,217,900 13.76% 335.9 $796,800 11.71% 323.3 $659,600 6.45% 341.2 $1,162,500 20.95% 352.1 $1,361,200 23.03% 345.8 $999,400 22.06% 303.9 $786,400 17.56% 290.7 $631,100 12.11% 335.4 $1,109,300 23.22% 340.8 $1,280,400 24.79% 350.9 $904,900 23.69% 292.2 $791,600 21.45% 290.8 $623,900 15.72% 341.8 $1,169,600 37.27% 344.5 $1,229,200 35.79% 359.9 $752,800 38.69% - - - - - - 379.1 $735,600 37.40% 387.9 $748,300 37.36% 363.0 $715,500 35.55% - - - - - - 345.9 $1,609,900 22.44% 352.4 $1,651,600 23.35% 334.7 $1,026,500 25.97% - - - 269.2 $665,500 12.97% 345.3 $1,213,700 19.15% 365.4 $1,529,800 19.57% 356.9 $1,062,500 21.89% 292.1 $788,300 19.03% 298.9 $688,400 13.43% 320.2 $942,900 24.64% 323.0 $1,088,700 25.44% 325.8 $767,300 25.99% 321.6 $665,500 18.54% 293.7 $502,600 16.27% 349.8 $1,256,800 17.50% 372.3 $1,590,200 17.82% 344.6 $1,047,700 19.74% 296.0 $750,400 15.18% 298.5 $604,000 13.33% 327.0 $1,193,500 17.97% 326.3 $1,386,400 20.14% 337.0 $1,023,100 20.79% 321.7 $889,600 13.04% 276.0 $637,400 9.09% 358.7 $1,249,600 23.01% 358.6 $1,322,700 24.60% 362.1 $903,500 21.35% 363.3 $644,900 19.98% 291.5 $583,300 13.87% 361.7 $844,500 31.53% 352.2 $919,100 31.76% 375.6 $749,100 32.11% 383.0 $602,600 31.12% 346.6 $575,100 22.82% 350.5 $864,400 28.15% 347.6 $932,500 27.94% 364.9 $787,400 29.86% 342.2 $643,000 25.62% 310.7 $499,000 20.85% 352.9 $595,200 39.05% 352.7 $600,800 39.02% 349.9 $705,700 39.51% - - - - - - 364.7 $770,300 34.43% 353.9 $852,300 33.80% 367.4 $701,900 34.63% 375.4 $606,400 31.21% 299.5 $441,400 23.61% 378.1 $719,000 34.08% 361.6 $771,700 33.78% 415.1 $694,700 36.73% 417.4 $529,100 35.30% 346.2 $391,700 21.86% 358.4 $956,000 26.33% 339.2 $1,056,700 27.14% 364.1 $849,600 27.49% 364.5 $621,900 26.08% 441.3 $831,300 24.10% 353.1 $906,500 35.29% 347.7 $921,700 35.82% 351.5 $653,400 36.66% - - - - - - 340.9 $1,135,900 35.55% 344.2 $1,188,800 36.64% 332.4 $770,800 35.90% 319.0 $580,900 25.84% 268.5 $641,200 18.13% 350.9 $911,700 29.34% 348.7 $1,002,900 29.53% 360.7 $794,600 28.96% 378.1 $635,300 33.23% 278.7 $517,400 22.45% 370.5 $817,700 24.75% 389.7 $888,100 25.39% 373.7 $700,300 27.11% 345.5 $456,800 28.11% 329.1 $482,800 2.24% 370.5 $817,700 24.75% 389.7 $888,100 25.39% 373.7 $700,300 27.11% 345.5 $456,800 28.11% 329.1 $482,800 2.24% 345.0 $753,700 31.48% 336.3 $771,500 33.98% 386.9 $722,600 33.55% 308.2 $486,600 20.86% 311.1 $492,000 16.39% 328.0 $876,900 30.63% 328.4 $879,300 30.58% - - - - - - - - - 358.2 $896,700 29.27% 335.9 $958,400 26.04% 395.6 $833,500 32.84% 338.6 $549,900 20.80% 291.0 $490,900 15.75% 371.0 $742,700 33.31% 357.7 $756,900 39.73% 399.4 $630,300 33.31% 339.6 $541,700 18.45% - - - 339.0 $668,600 31.86% 336.6 $684,300 32.83% 394.4 $603,000 36.33% 281.9 $237,100 22.57% 297.1 $583,800 15.74% - - - - - - - - - - - - - - - 327.8 $770,000 31.81% 321.1 $836,000 33.13% 363.8 $662,400 34.39% 302.6 $611,600 18.20% 328.8 $512,800 19.22% Composite Single Family Detached Single Family Attached Townhouse Apartment Index Benchmark Yr./Yr. % Chg. Index Benchmark Yr./Yr. % Chg. Index Benchmark Yr./Yr. % Chg. Index Benchmark Yr./Yr. % Chg. Index Benchmark Yr./Yr. % Chg. Toronto Regional Real Estate Board FOCUS ON THE MLS HOME PRICE INDEX ALL TRREB AREAS INDEX AND BENCHMARK PRICE, JULY 2021 TRREB Total Halton Region Burlington Halton Hills Milton Oakville Peel Region Brampton Caledon Mississauga City of Toronto York Region Aurora East Gwillimbury Georgina King Markham Newmarket Richmond Hill Vaughan Whitchurch-Stouffville Durham Region Ajax Brock Clarington Oshawa Pickering Scugog Uxbridge Whitby Dufferin County Orangeville Simcoe County Adjala-Tosorontio Bradford West Gwillimbury Essa Innisfil Barrie New Tecumseth 25 Market Watch, July 2021 Copyright® 2021 Toronto Regional Real Estate Board
- 26. 345.1 $1,054,300 18.06% 348.1 $1,302,300 22.61% 359.9 $1,013,800 21.59% 346.5 $745,900 17.18% 322.9 $639,400 8.14% 334.4 $1,102,600 10.14% 339.3 $1,533,100 14.67% 360.5 $1,217,900 13.76% 335.9 $796,800 11.71% 323.3 $659,600 6.45% 325.7 $1,390,300 11.43% 347.2 $1,933,900 13.72% 363.8 $1,446,000 11.87% 280.9 $845,200 5.64% 312.5 $706,500 10.62% 381.7 $1,359,900 10.13% 360.1 $1,574,000 9.62% 410.0 $1,219,200 9.51% 407.3 $793,100 9.87% 362.9 $779,000 10.17% 377.4 $973,100 14.05% 384.4 $1,040,400 14.71% 389.7 $998,300 13.68% 289.4 $709,600 8.72% 357.0 $610,000 12.44% 355.1 $911,400 11.32% 333.0 $1,053,800 13.89% 334.6 $951,000 11.79% 302.8 $697,000 7.49% 392.4 $578,900 10.16% 318.3 $756,100 12.75% 319.5 $1,071,400 12.58% 304.6 $884,800 13.53% 317.4 $576,400 16.95% 336.3 $444,300 9.83% 289.0 $846,400 11.58% 377.3 $1,192,300 15.84% 343.9 $1,158,100 18.34% 350.6 $1,039,600 8.51% 236.9 $594,200 8.27% 308.4 $1,363,700 14.01% 328.7 $1,507,400 14.85% 322.7 $1,341,500 17.73% 245.5 $902,500 4.91% 182.1 $738,400 5.69% 294.0 $1,246,200 11.83% 303.7 $1,702,800 16.54% 329.4 $1,238,700 17.39% 337.0 $810,500 11.89% 279.3 $581,600 7.75% 318.6 $831,300 16.83% 324.3 $1,257,600 18.06% 345.8 $953,900 22.19% 258.0 $716,500 5.22% 324.5 $427,500 16.73% 354.5 $809,800 13.01% 329.4 $988,200 12.62% 340.8 $872,100 13.90% 398.4 $717,200 15.81% 371.0 $528,500 12.83% 349.3 $876,400 4.93% 423.9 $1,660,800 11.99% 419.8 $1,534,000 11.98% 345.7 $985,400 11.41% 342.1 $712,200 3.67% 322.7 $1,625,800 8.76% 315.8 $2,665,500 14.05% 335.5 $1,880,300 14.47% 324.4 $1,631,200 4.71% 314.6 $896,300 5.68% 374.4 $2,169,500 11.40% 358.3 $2,429,100 13.75% 373.3 $1,440,400 14.47% - - - 396.0 $1,035,900 7.14% 301.3 $1,943,200 11.47% 311.1 $2,277,300 11.99% 310.7 $1,453,000 17.02% - - - 262.1 $701,100 5.60% 326.3 $1,314,700 10.50% 321.5 $1,431,400 10.03% 308.2 $1,136,100 13.98% 305.1 $818,300 8.11% 332.1 $714,300 11.11% 335.0 $1,145,000 8.80% 355.4 $1,692,000 7.96% 287.9 $1,085,700 11.07% 307.0 $865,300 8.33% 328.8 $685,200 8.91% 306.7 $796,400 2.61% 319.3 $1,869,600 3.00% 340.9 $1,626,300 10.54% 338.9 $876,400 8.41% 303.4 $649,900 2.02% 263.4 $1,889,600 10.91% 271.6 $3,501,700 17.42% 274.5 $2,598,100 15.38% 309.9 $1,830,300 7.38% 248.3 $822,600 6.48% 317.9 $1,256,500 6.50% 311.3 $1,922,000 9.96% 304.8 $1,505,900 12.14% 290.6 $974,100 4.12% 323.7 $773,000 5.30% 365.9 $1,327,400 11.32% 335.1 $2,412,700 17.62% 364.8 $1,691,600 17.37% 312.6 $541,500 23.66% 383.3 $556,500 6.98% 280.6 $2,424,200 10.87% 277.5 $3,008,700 15.53% 336.3 $1,382,700 15.65% 250.2 $1,001,000 13.26% 304.7 $955,300 1.33% 322.6 $1,208,100 13.55% 327.3 $1,822,100 18.20% 316.3 $986,400 24.19% 296.6 $857,500 12.69% 318.5 $650,700 8.93% 316.9 $1,075,700 5.11% 364.1 $2,190,300 10.30% 285.5 $1,474,100 13.70% 328.7 $885,200 0.37% 304.2 $766,100 3.72% 326.8 $1,058,300 9.89% 342.4 $1,607,700 11.17% 290.1 $943,200 14.75% 330.9 $792,000 10.45% 323.6 $745,000 8.74% 403.4 $1,255,600 8.56% 415.0 $1,461,900 9.82% 420.7 $1,326,800 9.50% 490.1 $896,400 12.00% 311.4 $696,600 1.33% 366.5 $1,368,300 15.07% 327.0 $1,479,800 19.87% 390.5 $1,306,800 16.22% 381.9 $1,100,000 10.76% 317.3 $901,600 5.94% 352.6 $1,096,900 11.62% 361.5 $1,228,800 12.86% 341.5 $1,139,800 11.42% - - - 327.3 $489,200 8.13% 347.0 $855,800 13.99% 329.3 $970,800 15.63% 345.4 $832,400 16.73% 307.3 $653,400 10.58% 396.9 $605,300 13.46% 311.0 $826,300 15.70% 328.4 $1,156,500 16.70% 321.3 $885,400 18.69% 340.1 $739,600 17.93% 277.4 $569,400 11.58% 350.5 $974,700 15.37% 360.6 $1,030,100 17.27% 363.9 $865,500 17.88% 323.2 $714,300 10.80% 306.4 $630,800 8.54% 344.3 $844,000 12.92% 345.5 $1,132,400 14.10% 339.5 $887,700 15.12% 353.4 $765,600 19.31% 340.9 $583,800 10.57% 349.1 $804,800 16.21% 340.3 $1,060,700 18.12% 313.4 $812,500 20.77% 320.3 $587,300 15.26% 371.9 $507,400 12.80% 338.7 $808,700 13.58% 335.2 $951,700 17.70% 322.3 $788,300 16.19% 367.2 $661,100 18.49% 339.4 $636,600 9.17% 351.2 $984,900 19.54% 337.4 $1,081,000 21.50% 340.5 $883,000 20.74% 397.2 $647,900 18.14% 334.0 $538,900 12.04% 369.4 $787,800 15.22% 356.1 $990,400 18.07% 368.4 $834,500 20.87% 295.7 $580,300 15.60% 456.1 $578,100 12.92% Composite Single Family Detached Single Family Attached Townhouse Apartment Index Benchmark Yr./Yr. % Chg. Index Benchmark Yr./Yr. % Chg. Index Benchmark Yr./Yr. % Chg. Index Benchmark Yr./Yr. % Chg. Index Benchmark Yr./Yr. % Chg. Toronto Regional Real Estate Board FOCUS ON THE MLS HOME PRICE INDEX CITY OF TORONTO INDEX AND BENCHMARK PRICE, JULY 2021 TRREB Total City of Toronto Toronto W01 Toronto W02 Toronto W03 Toronto W04 Toronto W05 Toronto W06 Toronto W07 Toronto W08 Toronto W09 Toronto W10 Toronto C01 Toronto C02 Toronto C03 Toronto C04 Toronto C06 Toronto C07 Toronto C08 Toronto C09 Toronto C10 Toronto C11 Toronto C12 Toronto C13 Toronto C14 Toronto C15 Toronto E01 Toronto E02 Toronto E03 Toronto E04 Toronto E05 Toronto E06 Toronto E07 Toronto E08 Toronto E09 Toronto E10 Toronto E11 26 Market Watch, July 2021 Copyright® 2021 Toronto Regional Real Estate Board
- 27. 2009 86,980 $395,234 2010 85,860 $431,262 2011 89,110 $464,989 2012 85,488 $497,073 2013 87,047 $522,951 2014 92,776 $566,611 2015 101,214 $622,116 2016 113,040 $729,821 2017 92,340 $822,496 2018 78,017 $787,800 2019 87,747 $819,047 Year Sales Average Price Toronto Regional Real Estate Board January 4,546 838,087 February 7,193 910,068 March 7,944 902,737 April 2,957 820,226 May 4,594 863,563 June 8,645 931,131 July 11,033 943,594 August 10,738 951,219 September 11,033 960,613 October 10,503 968,535 November 8,728 955,889 December 7,155 932,270 January 6,888 $966,068 February 10,934 $1,044,946 March 15,630 $1,097,364 April 13,626 $1,090,870 May 11,920 $1,108,429 June 11,081 $1,089,787 July 9,390 $1,062,256 August - - September - - October - - November - - December - - Annual 95,069 $929,629 HISTORIC ANNUAL STATISTICS1,6,7 Year to Date 79,469 $1,074,113 NOTES *For historic annual sales and average price data over a longer time frame go to: http://www.torontorealestateboard.com/market_news/market_watch/historic_stats/ pdf/TREB_historic_statistics.pdf Ajax Aurora Bradford West Gwillimbury Brampton Brock Burlington C01 C02 C03 C04 C06 C07 C08 C10 C11 C12 C13 C14 C15 Caledon Clarington E01 E02 E03 E04 E06 E07 E08 E09 E10 E11 East Gwillimbury Essa Georgina Halton Hills Innisfil King Markham Milton Mississauga New Tecumseth Newmarket Oakville Oshawa Pickering Richmond Hill Scugog Uxbridge Vaughan W02 W03 W04 W05 W06 W07 W08 W09 W10 Whitchurch-Stouffville Adjala-Tosorontio Orangeville Whitby Dufferin Durham Halton Peel Simcoe Toronto York 27 Market Watch, July 2021 Copyright® 2021 Toronto Regional Real Estate Board 1 - Sales, dollar volume, average sale prices and median sale prices are based on firm transactions entered into the TRREB MLS® system between the first and last day of the month/period being reported. 2 - New listings entered into the TRREB MLS® system between the first and last day of the month/period being reported. 3 - Active listings at the end of the last day of the month/period being reported. 4 - Ratio of the average selling price to the average listing price for firm transactions entered into the TRREB MLS® system between the first and last day of the month/period being reported. 5 - Average Listing Days on Market (Avg. LDOM) refers to the average number of days sold listings were on the market. Average Property Days on Market (Avg. PDOM) refers to the average number of days a property was on the market before selling irrespective of whether the property was listed more than once by the same combination of seller and brokerage during the original listing contract period. 6 - Active listings at the end of the last day of the month/period being reported. 7 - Past monthly and year-to-date figures are revised on a monthly basis. 8 - SNLR = Sales-to-New Listings Ratio. Calculated using a 12-month moving average (sales/new listings). 9 - Mos. Inv. = Months of Inventory. Calculated using a 12-month moving average (active listings/sales). 2021 MONTHLY STATISTICS1,7 2020 MONTHLY STATISTICS1,7