SlideShare uma empresa Scribd logo
1 de 49
McKinsey & Company 1
Five emerging consumer themes in October 2021
1 2
Source: Based on 3rd-party data between Feb 2019 and Aug 2021, as well as longitudinal surveys conducted between Mar 2020 and Aug 2021 in the United States
1. Year-over-year growth for Mar–Jun 2021 relative to estimate of Mar–Jun 2020 growth had COVID-19 not occurred.
5
4
3
Strong spending
across income and
age groups
Omnichannel is
ascendant
Loyalty shake-up
continues
Strong and merry
holidays
A tentative return
to out-of-home
Year-over-year growth1
is at 11% vs pre-
COVID-19 growth
trajectory, with growth
across almost all
categories. Both
excitement to spend as
well as inflation have
driven spending growth
Both brick-and-mortar
retail and e-commerce
show strong gains
(10% and 36%,
respectively), with 60–
70% of consumers
shopping in an
omnichannel way
In the past 3 months,
over 60% of consumers
faced out-of-stocks; of
these consumers, only
13% waited for the item
to come back in stock
while over 70%
switched retailer or
brands
Almost 50% of
consumers are
engaging in “normal”
out-of-home activities,
up from 33% in
February; consumer
investment in home
continues despite the
partial return to out-of-
home activity
A strong holiday season
is expected, with overall
spend expected to grow
7% and almost half of
consumers shopping
earlier due to supply-
chain concerns plus
excitement; social media
is expected to influence
consumers of all ages
McKinsey & Company 2
Confidence in own country’s economic recovery after COVID-191
% of respondents
14 13 17 17 22 21
22 32
49 52
50 50
46
65
74
67
37 35 33 33 32
14
5 1
Mixed The economy will be
impacted for 6–12 months or
longer and will stagnate or show
slow growth thereafter
Pessimistic: COVID-19 will
have lasting impact on the
economy and show regression
or fall into lengthy recession
Optimistic: The economy will
rebound within 2–3 months and
grow just as strong as or
stronger than before COVID-19
1. Q: What is your overall confidence level surrounding economic conditions after the coronavirus (COVID-19) crisis subsides (ie, once there is herd immunity)? Rated from 1 “very optimistic” to 6 “very pessimistic.” Bars may not sum to
100% due to rounding.
Spending remains strong | Current as of October 2021
Germany
10/15–22
UK
10/15–22
Italy
10/15–22
France
10/15–22
Change in % optimistic vs
Feb survey, percentage points
US
10/9–15
+3 +3
+13 +14
+18
Spain
10/15–22
+16
India
10/18–25
+3
Source: McKinsey & Company COVID-19 Consumer Pulse Survey
China
10/17–22
+6 +2
Japan
10/18–20
15
41
44
Sentiment ranges widely across global countries
McKinsey & Company 3
15 16 17 17 20 18 16 14 13 14 16 15
45 48 50 48 46 46
45 44 46 45 41 41
40 36 33 35 34 36 39 42 41 41 43 44
Mar 20202 Nov 2020
May 2020
Apr 20202 June 2020 Aug 2020 Sept 2020 Oct 2020 Feb 2021 Aug 2021 Oct 2021
July 2020
Spending remains strong | Current as of October 2021
1. Q: What is your overall confidence level surrounding economic conditions after the coronavirus (COVID-19) crisis subsides (ie, once there is herd immunity)? Rated from 1 “very optimistic” to 6 “very pessimistic.” Figures may not sum to
100% because of rounding.
2. Average of weekly pulse surveys shown for March through April 2020.
Optimistic: The
economy will rebound
within 2–3 months and
grow just as strong as or
stronger than before
COVID-19
Mixed: The economy
will be impacted for 6-12
months or longer and will
stagnate or show slow
growth thereafter
Pessimistic: COVID-
19 will have lasting
impact on the economy
and show regression / fall
into lengthy recession
Source: McKinsey & Company COVID-19 US Consumer Pulse Survey, 10/9–10/15/2021, n = 2,095; 8/25–8/31/2021, n = 2,004; 2/18–2/22/2021, n = 2,076; 11/9–11/13/2020, n = 2,024; 10/23–10/27/2020, n = 2,021; 9/18–9/24/2020, n = 1,026;
8/19–8/23/2020, n = 2,026; 7/30–8/2/2020, n = 2,024; 7/7–7/12/2020, n = 1,923; 6/15–6/21/2020, n = 2,006; 6/1–6/7/2020, n = 1,966; 5/18–5/24/2020, n = 1,975; 5/11–5/17/2020, n = 2,002; 5/4–5/10/2020, n = 1,993; 4/27–5/3/2020, n = 2,105;
4/20–4/26/2020, n = 1,052; 4/13–4/19/2020, n = 1,052; 4/6–4/12/2020, n = 1,063; 3/30–4/5/2020, n = 1,484; 3/23–3/29/2020, n = 1,119; 3/20–3/22/2020, n = 1,073; 3/16–3/17/2020, n = 1,042, sampled and weighted to match the US general
population 18+ years
Overall optimism on economic recovery following the COVID-19
pandemic continues to slowly increase in 2021
Confidence in own country’s economic recovery after COVID-19,1 % of US respondents
McKinsey & Company 4
Spending remains strong | Current as of October 2021
Confidence in own country’s economic recovery after
COVID-19 by income level,1 % of respondents
30 30
35
36
32
41
38 39 39
45
48
54
57
61
0
30
65
25
15
10
5
20
50
35
40
55
45
60
July 2020 Sept 2020 Feb 2021
36
Aug 2021 Oct 2021
Low (<$50k) Medium ($50k–100k) High (>$100k)
24
21
18
20 21
18
16
15
12
10 10
7
10
0
15
5
20
30
25
35
40
45
65
50
55
60
17
July 2020
16
Sept 2020
14
Feb 2021 Oct 2021
Aug 2021
1. Q: What is your overall confidence level surrounding economic conditions after the coronavirus (COVID-19) crisis subsides (ie, once there is herd immunity)? Rated from 1 “very optimistic” to 6 “very pessimistic.”
Optimism by income Pessimism by income
Source: McKinsey & Company COVID-19 US Consumer Pulse Survey, 10/9–10/15/2021, n = 2,095; 8/25–8/31/2021, n = 2,004; 2/18–2/22/2021, n = 2,076; 9/18–9/24/2020, n = 1,026;
7/7–7/12/2020, n = 1,923; sampled and weighted to match the US general population 18+ years
High-income consumer optimism continues to increase while
middle- and low-income consumer optimism remains flat
McKinsey & Company 5
Younger and vaccinated consumers also drive optimism
Spending remains strong | Current as of October 2021
Confidence in own country’s economic recovery after COVID-191
% of respondents
1. Q: What is your overall confidence level surrounding economic conditions after the coronavirus (COVID-19) crisis subsides (ie, once there is herd immunity)? Rated from 1 “very optimistic” to 6 “very pessimistic.”
2. Gen Z are people under 25 years old, millennials are 25–44 years old, Gen X are 45–54 years old, and baby boomers are 55 years old and above.
3. Baby boomers includes silent generation.
Source: McKinsey & Company COVID-19 US Consumer Pulse Survey, 10/9–10/15/2021, n = 2,095, sampled and weighted to match the US general population 18+ years
By generation2 By vaccination status
9 10
26
16
Millennials
52
40
Gen Z
52
39
62
28
44
Gen X
22
Baby boomers3
Optimistic Mixed Pessimistic
11
28
42
36
47
36
Vaccinated Unvaccinated
McKinsey & Company 6
Spending remains strong | Current as of October 2021
26 22
28 32
15
17
11 5
59 61 61 63
Gen Z Gen X
Millennials Baby boomers
23
40
13
8
64
52
Unvaccinated
Vaccinated
28
11
61
Overall
1. Q: When do you expect your routines will return to normal? Figures may not sum to 100% because of rounding.
2. Gen Z are people under 25 years old, millennials are 25–44 years old, Gen X are 45–54 years old, and baby boomers are 55 years old and above. Baby boomers includes silent generation.
3. Q: Which best describes your vaccination status?
Source: McKinsey & Company COVID-19 US Consumer Pulse Survey, 10/9–10/15/2021, n = 2,095, sampled and weighted to match the US general population 18+ years
Not affected/already returned
In or after 2022 In 2021
By generation2 By vaccination status3
~40% of
unvaccinated
individuals say their
lives have already
returned to normal
Younger
respondents,
particularly the
millennial
generation, are most
likely to say things
have not returned to
normal
Approximately 60 percent of consumers expect a return to
normalcy in 2022 or beyond
Expectations on routines returning to normal,1 % of respondents
McKinsey & Company 7
Household finances have improved slightly over the past year
Spending remains strong | Current as of October 2021
Increased slightly/a lot
About the same
Reduced slightly/a lot
34
29
24 27
57
60
65 60
9 11 11 13
Past 2 weeks Past 2 weeks Past 2 weeks Past 2 weeks
41 37 34 35
45
43 49 49
14
20 17 16
Past 2 weeks Past 2 weeks Past 2 weeks Past 2 weeks
37 34
27 29
42 44
50 47
21 22 23 24
Past 2 weeks Past 2 weeks Past 2 weeks Past 2 weeks
Source: McKinsey & Company COVID-19 US Consumer Pulse Survey 10/9–10/15/2021, n = 2,095; 8/25–8/31/2021, n = 2,004; 2/18–2/22/2021, n = 2,076; 11/9–11/13/2020,
n = 2,024, sampled and weighted to match the US general population 18+ years
1. Q: How has the coronavirus (COVID-19) crisis affected the following over the past 2 weeks? Figures may not sum to 100% because of rounding.
Household income Household spending Household savings
Feb 18–22 Aug 25–31 Oct 9–15
Nov 9–13 Feb 18–22 Aug 25–31 Oct 9–15
Nov 9–13
COVID-19 impact on household finances,1 % of respondents
McKinsey & Company 8
About 50 percent of consumers say it will take until 2022 for
household finances to return to normal
Spending remains strong | Current as of October 2021
1. Q: When do you expect your personal/household finances will return to normal? Figures may not sum to 100% because of rounding.
2. Gen Z are people under 25 years old, millennials are 25–44 years old, Gen X are 45–54 years old, and baby boomers are 55 years old and above. Baby boomers includes silent generation.
3. Q: Which best describes your vaccination status?
Source: McKinsey & Company COVID-19 US Consumer Pulse Survey, 10/9–10/15/2021, n = 2,095, sampled and weighted to match the US general population 18+ years
By generation2 By vaccination status3
~60% of baby
boomers say their
finances either
were not affected
or are back to
normal, vs ~30%
for Gen Z and
millennials
Expectations on personal/household finances
returning to normal,1 % of respondents
42 42
10 7
48 51
Vaccinated Unvaccinated
28 28
38
63
12 14
11
60 58
51
34
Millennials Baby boomers
Gen Z Gen X
3
In or after 2022 Not affected/already returned
In 2021
42
9
49
Overall
McKinsey & Company 9
Spending remains strong | Current as of October 2021
Younger and higher-income consumers plan to spend more than
older consumers and those with lower incomes
1. Q: With regard to products and services you will spend money on, do you plan to splurge/treat yourself in 2021? For example, are there categories of products or services you have spent less on over the last year and half which you feel you
will spend more on now?
2. Gen Z are people under 25 years old, millennials are 25–44 years old, Gen X are 45–54 years old, and baby boomers are 55 years old and above. Baby boomers includes silent generation.
Source: McKinsey & Company COVID-19 US Consumer Pulse Survey, 10/9–10/15/2021, n = 2,095; 8/25–8/31/2021, n = 2,004; 2/18–2/22/2021, n = 2,076, sampled and weighted
to match the US general population 18+ years
59
41
42
51
49
Feb 2021 Aug 2021
58
Oct 2021
Plan on
splurging
Do not plan
on splurging
Millennials
Gen X
Baby boomers
49
−4
68
5
Gen Z 72
6
42
−8
63
−3
70
−10
22
−5
22
−11
29
−18
28
−4
34
−17
51
−14
Generation
2
Respondents who plan/do not plan to
splurge/treat themselves in 20211
% of respondents
Low
(<$50k/year)
Middle
($50–100k/year)
High
(>$100k/year)
>70%
<30% 50–70%
30–50% pp change from Feb 21
XX
Respondents who plan to splurge, by household income, %
Change < −10 pp
.
McKinsey & Company 10
Consumers’ intentions to splurge are moderating since early 2021;
baby boomers indicate intent to spend on travel and experiences
Spending remains strong | Current as of October 2021
Categories where consumers intend to treat themselves1
% of all respondents with intent to splurge
1. Q: You mentioned that you plan to splurge/treat yourself in next 6 months. Which categories do you intend to treat yourself to? Please select all that apply.
2. Gen Z are people under 25 years old, millennials are 25–44 years old, Gen X are 45–54 years old, and baby boomers are 55 years old and above. Baby boomers includes silent generation.
41
37
32
30
29
28
27
26
24
24
21
19
17
Apparel, shoes, and accessories
Electronics
Restaurants, dining out, bars
Personal services
Items for your home
Makeup and skin-care products
Travel, lodging, and vacation
Household essentials
Fitness
Sports apparel and equipment
Out-of-home entertainment
Pets
Outdoor living
Millennials Gen X
Gen Z
Baby
boomers
Generational cut2
Change from
Feb 2021,
percentage points
Source: McKinsey & Company COVID-19 US Consumer Pulse Survey, 10/9–10/15/2021, n = 2,095; 2/18–2/22/2021, n = 2,076, sampled and weighted to match the US general population 18+ years
Between −3 and +3
< −3 > +3
Categories
Difference from all respondents,
percentage points
47 44 39 31
31 36 37 43
33 37 30 23
40 35 26 16
28 32 34 19
24 27 30 34
22 31 26 22
19 29 28 22
28 28 25 11
18 28 28 12
19 24 18 19
30 19 19 12
19 21 20 6
2
–9
–5
N/A
–3
–16
–3
–2
–3
N/A
–7
N/A
N/A
McKinsey & Company 11
Spending remains strong | Current as of September 2021
Source: Affinity Solutions credit-card spend data for 2/2019–9/2021
1. Includes credit-card and some debit-card spending data among banked consumers; does not include spending that is difficult to track (eg, at small businesses) and/or for channels where non-credit-card forms of payment (cash, check, bank
transfers, etc) are common (healthcare, insurance, utilities, housing, etc). Year-over-year growth in monthly sales during current period (2/2020–9/2021) compared with monthly sales in prior period (2/2019–9/2020).
2. Year-over-year spend in Mar–Sept 2020 decreased by 8% compared with same period in previous year, whereas Sept–Feb remained flat compared with same period in previous year.
3. Re-forecasted Mar–Sept 2020 spend calculated by growing Feb–Sept 2020 spend by the same 1-month growth rate observed between Feb and Sept 2019.
10
−6
−18
−9
−6 −5
−3
1
2 1
−2
3
−4
4 5 5 7 6 6
11
July
Aug
Mar
Feb July
21
Apr Feb
May May
June Sept Dec
Oct Nov Jan Mar
27
June
Apr Aug Sept
20
20
40
25
22
1st round of
stimulus
2nd round
of stimulus
Holiday pull-
forward spend
3rd round
of stimulus
vs re-
forecasted
Sept 2020
spend had
COVID-19 not
occurred3
vs Sept 2020
actual spend
Comparison to pre-COVID-19 months
Comparison to COVID-affected
months
Mar–Aug
6-month YoY:
-8%2
Sept–Feb
6-month YoY:
0%2
Year-over-year credit-card spend,1 %
September continues trend of strong growth, with an uptick
potentially due to inflation and an earlier start on holiday spending
McKinsey & Company 12
Spending remains strong | Current as of September 2021
Source: Affinity Solutions credit-card spend data from 2/2019–9/2021; US Bureau of Labor Statistics
1. Includes credit-card and some debit-card spending data among banked consumers; does not include spending that is difficult to track (e.g., at small businesses) and/or for channels where non-credit card forms of payment (cash, check,
banks transfers, etc.) are common (healthcare, insurance, utilities, housing, etc.). Year-over-year growth in monthly sales during current period (2/2020–9/2021) compared to monthly sales in prior period (2/2019–9/2020). Re-forecasted
Mar-Sept 2020 spend calculated by growing Feb-Sept 2020 spend by the same 1-month growth rate observed between Feb-Sept 2019.
10
-6
-18
-9
-6 -5
-3
2
1
-2
3
-4
4
5 5
7
6 6
11
-15
-5
-20
-10
0
5
10
15
Apr
Feb Mar May June July Aug
1
Mar
Dept Oct Nov Dec Jan Feb Apr May June July Aug Sept
Change in US Consumer Price Index (CPI) per annum, % Adjusted year-over-year credit-card spend1, %
As spending has increased, inflation has also gone up
McKinsey & Company 13
Spending remains strong | Current as of September 2021
Source: Affinity credit card spend data for Feb 2019–Sept 2021; spend samples cardholders and underrepresents highest- and lowest-income bands
Year-over-year credit-card spend by population subsegment,1 %
20
−30
−20
−10
10
0
30
June
Feb
Mar
Apr
Dec
May
June
Oct
July
Sept
Aug
Apr
Sept
Nov
Jan
Feb
Mar
May
July
Aug
Low (<$35k) Medium ($35k–80k) High (>$80,000)
Stimulus payment
Low-income
consumers
Medium-income
consumers
High-income
consumers
Change in spend, by income level,1 %
2020 2021
1. Re-forecasted Mar–Sept 2020 spend calculated by growing Feb–Sept 2020 spend by the same 1-month growth rate observed for Feb–Sept 2019.
Sept 2021 vs Sept 2020
year-over-year change
19
9
12
US consumer spending shows continued, robust growth across all
income groups
> 5%
< −5%
McKinsey & Company 14
Spending remains strong | Current as of September 2021
Source: Affinity credit card spend data for Feb 2019–Sept 2021; spend samples cardholders and underrepresents highest- and lowest-income bands
−30
20
−10
−20
30
0
10
Jan
Apr
Oct
Mar
June
Mar
Feb
Apr
May
July
June
July
Aug
Sept
Sept
Nov
Dec
Feb
May
Aug
18–37 (millennials) 52+ (baby boomers)
38–51 (Gen X)
Year-over-year credit-card spend by population subsegment,1 %
Stimulus payment
Baby
boomers
Gen X
Millennials
Change in spend,1 by age group,2 %
2020 2021
Sept 2021 vs Sept 2020
year-over-year change
7
18
13
> 5%
< −5%
While millennials’ spending growth outpaces other cohorts, baby
boomers’ trajectory is on the rise
1. Re-forecasted Mar–Sept 2020 spend calculated by growing Feb–Sept 2020 spend by the same 1-month growth rate observed for Feb–Sept 2019.
2. Age brackets: baby boomers (52+), Gen X (38–51), millennials (18–37). Data for lower-income consumers (<$35,000) underrepresented across all generational groups.
McKinsey & Company 15
Spending remains strong | Current as of September 2021
Early pandemic
May–July 2020
Later 2020
Aug–Dec
YTD 2021
Jan–Sept
Description
A Robust year-over-year growth throughout, due to larger
consumer shifts (eg, homebody economy)
Sustained
elevation
B Fast rise in early days of COVID-19, with growth
subsiding over time
Normalizing
growth
C Steady demand, not affected by COVID-19
Unaffected
D Significant declines at the outset of COVID-19, with
quicker recovery
Approaching
recovery
E Larger decline (−50% or more year over year), with
slower path to recovery
/
Larger decline
Categories/channels
 Software and electronics
 Home
 Pet supplies
 Sporting apparel
 Cosmetics
 Grocery stores
 Discount stores
 Mass stores
 Wholesale clubs
 Drugstores and
pharmacies
 Telecom/cable
 Retail apparel
 Fuel and other auto
 Restaurants
 Out-of-home entertainment
 Travel
Channel and category performance has evolved into five distinct
performance types over the course of the pandemic
McKinsey & Company 16
Spending remains strong | Current as of September 2021
−15 0 15 30+
YoY growth, %
−30
< −45
Source: Affinity credit card spend data for Feb 2019–Sept 2021; Stackline Amazon spend data for Feb 2019–Sept 2021
Sustained
elevation
Normalizing
growth
Approaching
recovery
Larger
decline
Unaffected
Software and electronics3
Home3
Pet supplies3
Sporting apparel3
Restaurants
Auto
Retail apparel3
Out-of-home entertainment
Travel
Total
Discount stores
Wholesale clubs
Mass
Drugstores, pharmacies3
Cosmetics3
Grocery stores3
Telecom/cable
13
15
15
6
9
10
5
30
5
10
4
15
10
7
14
9
7
Pre-
COVID-
19
Feb 2020
9
2
24
−14
−24
−21
−43
−52
−46
−6
18
20
15
22
−9
36
−4
Early
shelter
in place,
Mar
28
35
21
27
−1
−16
−9
−78
−49
0
13
13
8
10
8
10
1
Fall
Aug–Oct
29
24
18
−6
−26
−41
−53
−79
−72
−13
9
0
9
2
1
15
2
E-
commerce
acceleration
Apr–May
23
28
19
25
−10
−22
−15
−79
−56
−5
9
9
3
9
9
9
0
Early
summer
June–July
26
34
24
36
3
−3
3
−62
−28
4
31
13
7
4
30
5
2
Mar–Apr
adjusted2
20
28
6
22
11
16
7
8
−6
−18
−12
5
−78
9
−48
0
2
Holiday
Nov–Dec
25
21
22
36
5
−1
7
−28
−12
6
10
12
7
7
25
6
−1
May–Jun
adjusted2
12
15
26
30
7
4
6
−26
−8
6
15
15
6
13
26
8
0
Jul-Aug
adjusted2
22
30
22
21
−2
−8
−5
−75
−48
−1
13
12
10
1
14
9
2
2021
Jan–Feb
1. Excludes sales in automotive, beauty, grocery, home improvement, home and furniture, pet supplies, apparel and accessories, electronics, sports and outdoors, as these categories are embedded into subsequent rows.
2. YoY growth for Mar–Sept 2021 relative to estimate of Mar–Sept 2020 had COVID not occurred. Re-forecasted Mar–Sept 2020 spend calculated by growing Feb–Sept 2020 spend by the same 1-month growth rate
observed for Feb– Sept 2019.
3. Includes Amazon sales.
Spending growth in most categories other than out-of-home
entertainment and travel is now at or past pre-COVID levels
Year-over-year (YoY) sales growth,1 %
16
26
32
40
9
12
10
−25
−11
11
19
25
9
20
33
13
4
Sept
adjusted2
Sept sees a split
in spending
performance in
categories having
had sustained
elevation
McKinsey & Company 17
Omnichannel is ascendant | Current as of September 2021
1. Includes credit-card and some debit-card spending data among banked consumers. While card spending represents only a part of overall consumer spending (such as housing, utilities, and other major categories excluded from credit-card
spending), the changes in card data closely track changes in official consumption figures reported by the Bureau of Economic Analysis. This is because the share of unaffected categories in card spending is comparable with the share of
categories not affected negatively by COVID-19 in overall consumption (which includes housing). Year-over-year growth in monthly sales during current period (Feb 2020–Sept 2021) compared with monthly sales in prior period (Feb 2019–
Sept 2020).
2. Year-over-year growth for Mar–Sept 2021 relative to estimate of Mar–Sept 2020 had COVID not occurred. Re-forecasted Mar–Sept 2020 spend calculated by growing Feb–Sept 2020 spend by the same 1-month growth rate observed for
Feb–Sept 2019.
3. Includes the following retail channels: Amazon brick and mortar; apparel; software and electronics; cosmetics; pet supplies; home stores; mass stores; club stores; restaurants; grocery stores; drugstores; discount stores; auto and
cable/telecom (not shown separately); and experiences, including out-of-home entertainment and travel.
4. Includes the following retailer categories: Amazon; apparel; software and electronics; cosmetics; pet supplies; home stores; mass stores; club stores; restaurants; grocery stores; drugstores; and discount stores.
Source: Affinity Solutions credit-card spend data from Feb 2019–Sept 2021; Stackline Amazon spend data, Feb 2019–Sept 2021
Year-over-year sales growth, %
−10 0 10 20
−20
−30 30
Total3
Brick-
and-
mortar
sales3
E-com-
merce
sales4
Year-over-
year
change, last
12 mos vs last
13–24 mos
E-com-
merce
accele-
ration
Apr–May
Early
summer
June–July
Holiday
Nov–Dec
Early 2021
Jan–Feb
Fall
Aug–Oct May2
Early
shelter in
place
Mar
Pre-
COVID-19
Feb 2020
Start of
recovery2
Mar–Apr
June-
July2
−13 −5 0 −1
0 11
−6
10 5 5 7 7
−13 −3 −2 2
3 10
1
7 5 6 5 5
62 52 41 44
49 36
27
24 48 34 32 32
Aug2
Retail channel, year-over-year growth in spend,1 2019–21, %
Growth in spend shifts to e-commerce in September as total spend
grows 11 percent year-over-year
4
4
40
Sept2
McKinsey & Company 18
Source: Affinity Solutions credit-card and debit-card spend data for Feb 2019–Sept 2021; Facteus debit-card spend data for Feb 2019–Sept 2021; Stackline
Amazon spend data for Feb 2019–Sept 2021
1. Includes the following retailer categories: Amazon, apparel, software and electronics, cosmetics stores, pet supplies, home stores, mass stores, club stores,
restaurants, grocery stores, drugstores, discount stores.
2. Last 12 months.
Omnichannel is ascendant | Current as of September 2021
~30%
Increase in
online
penetration
since Mar 2020,
based on credit-
card and debit-
card spend
Retail-oriented online credit-card and debit-card spend as % of total1
19
20
27 27
25
26
25 25 25
29
30
27
26 26
25
24
26
24
25 25
LTM2 Mar
2020
June
Apr Aug
May Sept
July Oct Nov Dec Jan Feb Mar Apr May June July Aug Sept
2021
~30%
Online penetration holds steady at about 30 percent above
pre-COVID-19 levels
McKinsey & Company 19
E-commerce share of total retail sales1
%
Omnichannel is ascendant | Current as of September 2021
Source: Affinity credit card spend data for Feb 2019–Sept 2021; Stackline Amazon spend data for Feb 2019–Sept 2021
1. Year-over-year growth for Mar–Sept 2021 relative to estimate of Mar–Sept 2020 had COVID not occurred. Re-forecasted Mar–Sept 2020 spend calculated by growing Feb–Sept 2020 spend by the same 1-month growth rate
observed for Feb–Sept 2019.
2. Excludes sales in automotive, beauty, grocery, home improvement, home and furniture, pet supplies, apparel and accessories, electronics, sports and outdoors, as these categories are embedded into subsequent rows.
3. Includes Amazon sales.
2021
(May–
June)
25
12
1
67
20
8
34
62
10
37
76
45
11
(July)
24
11
1
66
20
7
33
61
9
36
74
43
10
Current
(Sept)
25
12
1
68
22
8
35
63
9
36
73
44
10
Total e-commerce penetration by retailer category2
Mass
Discount stores
Cosmetics3
Drugstores, pharmacies3
Grocery stores3
Home3
Pet supplies3
Restaurants
Retail apparel3
Software and electronics3
Sporting apparel3
Wholesale clubs
E-commerce penetration
20 30 40 50+
10
0
19
6
1
53
16
5
30
55
4
33
68
38
8
Pre-
COVID-19
(Feb)
20
8
0
68
19
6
32
60
7
43
78
49
8
Early
shelter in
place
(Mar)
27
12
0
90
21
7
36
67
10
67
89
66
11
E-
commerce
acceleration
(Apr–May)
25
11
0
72
20
7
34
61
9
43
82
50
10
Early
summer
(June–
July)
25
11
1
67
20
7
35
60
9
41
79
47
10
Fall
(Aug–Oct)
25
11
1
70
20
7
36
61
8
44
80
50
10
Holiday
(Nov–Dec)
27
13
1
70
21
8
38
63
11
45
79
50
11
Early 2021
(Jan–Feb)
26
12
1
70
20
9
35
63
10
39
77
46
11
Start of
recovery
(Mar–Apr)
Essentials
Discretionary
Online penetration remains stable across all channels
25
11
1
67
22
8
34
62
10
39
75
46
12
(Aug)
McKinsey & Company 20
Omnichannel is ascendant | Current as of September 2021
Source: Affinity Solutions credit-card and debit-card spend data for Feb 2019–Sept 2021; Facteus debit-card spend data for Feb 2019–Sept 2021; Stackline Amazon spend data, Feb 2019–Sept 2021
46
83
55
Pre-
COVID-19,
last 12
months5
Apr 2020
spike
Sept 2021
+20%
13
19 19
Pre-
COVID-19,
last 12
months5
Apr 2020
spike
Sept 2021
+46%
5
9 10
Pre-
COVID-19,
last 12
months5
Apr 2020
spike
Sept 2021
+100%
High penetration2
(>20%)
Moderate penetration3
(7–20%)
Low penetration4
(<7%)
Categories with lower pre-COVID-19 online penetration saw higher e-commerce growth in March and may be
more likely to sustain online penetration rates seen during the pandemic
Categories with already high online penetration saw a
dramatic spike during April’s lockdowns
1. Re-forecasted Mar–Sept 2020 spend calculated by growing Feb–Sept 2020 spend by the same 1-month growth rate observed for Feb–Sept 2019.
2. High-online-penetration retail categories include those with >20% pre-COVID-19 internet penetration: apparel, software and electronics, cosmetics, pet supplies.
3. Medium-online-penetration retail categories include those with 7–20% pre-COVID-19 internet penetration: home stores, mass stores, club stores.
4. Low-online-penetration retail categories include those with <7% pre-COVID-19 internet penetration: restaurants, grocery stores, drugstores, discount stores.
5. Online penetration from Mar 2019 to Feb 2020.
The trajectory of e-commerce penetration differs by category and
remains elevated compared with pre-COVID-19 levels
Online sales as % of overall sales for credit-card and debit-card spend,1 by level of pre-COVID-19 penetration
McKinsey & Company 21
−10
30
0
10
20
40
50
60
70
80
90
100
110
Timeline
YoY
growth,
%
Since April of this year, Amazon’s growth has decelerated but is still
higher versus pre-COVID-19 period
Omnichannel is ascendant | Current as of September 2021
Year-over-year (YoY) growth for Amazon sales, 2019–21, %
Source: Stackline Amazon spend data, Jan 2019–Sept 2021
Pre-
COVID-19
(Jan–Feb)
Early
shelter in
place
(Mar)
E-
commerce
acceleration
(Apr–May)
Early summer
(June–July)
Holiday
(Nov–Dec)
16 14 43 46 36
2020 2021
Fall
(Aug–Oct)
39
2021
(Jan–Feb)
31
Thanksgiving
July 4th
Christmas
Labor Day
Stimulus
New Year’s Day
Stimulus
2021
(Apr–May)
28
2021
(June–July)
18
2021
(Mar)
61
XX YoY growth in given period, %
Prime day
Prime Day
lapping
Negative growth rate due to
delayed Prime Day (originally
in week 29 in 2019) No data for week 1 in 2021
Negative growth due to accelerated July 4
(week 27 in 2021 vs week 28 in 2020)
2021
(Aug)
10
2021
(Sept)
8
McKinsey & Company 22
Six or seven in ten consumers shop across all categories in an
omnichannel way
Strong holiday outlook | Current as of August 2021
1. Q: Which best described how you have researched the following categories over the last 3 months?
35
33
31
24
24
22
20
20
22
20
17
17
15
16
16
13
16
12
58
60
62
63
63
70
66
65
65
60
62
69
68
65
65
61
70
65
7
7
7
13
13
8
14
15
13
20
21
14
17
19
19
26
14
23
Household supplies
Home decoration and furniture
Groceries
Pet food and supplies
Skin care and makeup
Footwear
Personal-care products
Home improvement, gardening supplies
Vitamins, supplements, OTC medicine
Accessories
Fitness and wellness services
Kitchen and dining
Jewelry
Apparel
Toys and baby supplies
Books, magazines, newspapers
Sports and outdoors equipment, supplies
Consumer electronics
Research and purchase only in-store Omnichannel Research and purchase only online
Product research and purchase by channel over the last 3 months1
% of respondents
Source: McKinsey & Company COVID-19 US Consumer Pulse Survey, 10/9–10/15/2021, n = 2,095, sampled and weighted to match the US general population 18+ years
McKinsey & Company 23
Social-media influence heaviest on Gen Z and millennials, though
influence is pervasive across generations for select categories
1. Q: Think about the purchases you have made in the following categories over the past 3 months. Were you influenced toward a certain brand by a post on social media in the following categories?.
2. Gen Z are people under 25 years old, millennials are 25–44 years old, Gen X are 45–54 years old, and baby boomers are 55 years old and above. Baby boomers includes silent generation.
49
47
44
41
39
37
34
34
34
32
30
26
25
24
23
22
Accessories
Jewelry
Household supplies
Sports and outdoors equipment and supplies
Fitness and wellness services
Skin care and makeup
Home decoration and furniture
Consumer electronics
Apparel
Footwear
Kitchen and dining
Home improvement and gardening supplies
Personal-care products
Vitamins, supplements, over-the-counter medicine
Groceries
Pet food and supplies
Millennials Gen X
Gen Z
Baby
boomers
Generational cut2
Source: McKinsey & Company COVID-19 US Consumer Pulse Survey, 10/9–10/15/2021, n = 2,095, sampled and weighted to match the US general population 18+ years
Categories
Categories where respondents were influenced by social media1
% of all respondents who purchased in these categories in the last 3 months
65 46 14
59 61 37 8
57 60 40 8
55 57 37 13
60 56 31 16
54 59 30 10
56 52 32 11
63 57 28 11
51 56 30 8
41 53 28 8
54 55 29 7
37 47 25 6
32 47 23 9
34
30
59
37
42
41
41
24
22
22
5
7
5
Top 3 categories influenced by social media
Omnichannel is ascendant | Current as of October 2021
McKinsey & Company 24
Most consumers would rather switch brands or retailers than wait
for out-of-stock items
Source: McKinsey & Company COVID-19 US Consumer Pulse Survey, 10/9–10/15/2021, n = 2,095, sampled and weighted to match the US general population 18+ years
1. Q: Over the last 3 months, have you wanted to buy something and not been able to purchase it because it was out of stock or otherwise not available?
2. Q: The most recent time this happened (when you wanted to buy something and it was not available), what did you do?
Respondents who planned to purchase something but could not, due to unavailability1
% of respondents
Switched brand
or product
62
could not
purchase at
least 1 item Did not
buy
Waited
13
16
39
32
Switched
retailer
Response of potential purchasers²
Loyalty shake-up continues | Current as of October 2021
McKinsey & Company 25
Loyalty shake-up continues | Current as of October 2021
Source: McKinsey & Company COVID-19 US Consumer Pulse Survey, 10/9–10/15/2021, n = 2,095; 2/18–2/22/2021, n = 2,076, sampled and weighted to match
the US general population 18+ years
Generational cut2
Between −3 and 3
< −3 >3
1. Q: Over the past 3 months, which of the following have you done? 28% replied “None of these.”
2. Gen Z are people under 25 years old, millennials are 25–44 years old, Gen X are 45–54 years old, and baby boomers are 55 years old and above.
3. “New digital shopping” method includes downloaded a new app, signed up for a new subscription.
4. “New shopping method” includes curbside pickup and delivery apps.
Behaviors in the past 3 months1
% of respondents
Changes in consumer behavior have been more extensive among
younger and high-income consumers
Difference from all respondents,
percentage points
72
43
36
30
25
24
Different retailer/store/website
New digital shopping method3
Any new shopping behavior
Different brand
Private label/store brand
New shopping method3
High
(>$100k/year)
Gen Z Millennials
Income cut
All consumers
84
85 87
46
49 49
46
42 48
34
30 35
34
37 36
33
37 34
McKinsey & Company 26
Reason for trying a new brand since COVID-19 began1
% of respondents who tried a new brand since COVID-19 began
Loyalty shake-up continues | Current as of October 2021
1. Q: You mentioned you tried a new/different brand than what you normally buy. What were the main reasons that drove this decision? Select up to 3 relevant reasons. “Brand” includes different brand, new
private label/store brand. Over-arching reason based on % of individual respondents responding to at least 1 reason in the group.
2. Gen Z are people under 25 years old, millennials are 25–44 years old, Gen X are people 45–54 years old, and baby boomers are 55 years old and above. Baby boomers includes silent generation.
Source: McKinsey & Company COVID-19 US Consumer Pulse Survey, 10/9–10/15/2021, n = 2,095; 2/18–2/22/2021, n = 2,076, sampled and weighted to match
the US general population 18+ years
Better prices, promotions
20
Better shipping, delivery cost
Products are in stock
Larger package sizes
Shares my values
Supporting local businesses
More sustainable, better for the environment
The company treats its employees well
Better quality
Natural, organic
12
Wanted to try a new brand I found
21
Wanted to try a type of product I’ve never tried before
8
Better value
Wanted variety, change from my normal routine
Available where I’m shopping (ie, in store or online)
Cleaner, safer
5
34
34
12
9
11
10
7
21
16
12
14
9
Wanted to treat myself
Novelty
Personal choice
Purpose-driven
Quality/organic
Convenience
Health/hygiene
Availability 19
Value 66
26
28
33
14
10
23
Baby
boomers
Gen Z +
millennials2 Gen X
All consumers
Between −3 and 3
< −3 >3
Older consumers focus most on value and prices, while younger
consumers are most interested in quality
x Net % of respondents per category
Difference from all respondents,
percentage points
42
35
44
38
7
11
8
7
26
19
8
7
5
9
1
11
2
2
12
25
5
6
25
17
17
18
10
13
11
15
18
12
5
10
28
24
17
15
16
12
8
12
8
26
13
19
15
14
11
11
13
McKinsey & Company 27
Source: McKinsey Sept 2019–Sept 2021 Global Sentiment Surveys
US consumers are trading down almost three times more in 2021
than pre-pandemic levels, but less than in 2020
Loyalty shake-up continues | Current as of October 2021
4
16
11
5
5
6
2.75X
US income tiers, household, annual
$50k–100k >$100k
<$50k
1. Q: Please indicate how your buying behavior has changed in a standard shopping basket for the items shown in the past 12 months (since September 2020). Select all that apply with option 7 being mutually exclusive and option 1 exclusive
from option 2. Possible answers: (1) “Switching to less expensive brands”; (2) “Buying the same brand as I bought 12 months ago but at stores with lower prices”; (3) “Buying only when on sale or with coupon”; (4) “Buying less frequently or
lower quantity of the same brand”; (5) “Switching to more expensive/premium brands”;( 6) “Have made some other change in how I buy these products”; (7) “Have not made changes in how I buy these products.” Trade down reflects option 1
as a percentage of all consumers, while trade up reflects option 5 as a percentage of all consumers.
Total
2019
2020
2021
3
10
7
6
10
10
3
17
10
6
3
6
6
18
15
4
3
3
Trade down Trade up
Trade-off behavior in a standard shopping basket among all consumers by income tier1
% of consumers, Sept 2021, Sept 2020, and Sept 2019
McKinsey & Company 28
Out-of-home/homebody economy | Current as of October 2021
Overall
1. Q: Which best describes when you will regularly return to stores, restaurants, and other out-of-home activities? Chart shows those saying they are already participating in these activities.
2. Gen Z are people under 25 years old, millennials are 25–44 years old, Gen X are 45–54 years old, and baby boomers are 55 years old and above.
3. Baby boomers includes silent generation.
Source: McKinsey & Company COVID-19 US Consumer Pulse Survey, 10/9–10/15/2021, n = 2,095; 8/25–8/31/2021, n = 2,004; 2/18–2/22/2021, n = 2,076; 11/9–11/13/2020,
n = 2,024; 9/18–9/24/2020, n = 1,026; 6/15–6/21/2020, n = 2,006; 5/18–5/24/2020, n = 1,975, sampled and weighted to match the US general population 18+ years
By
generation2
By
vaccination
adoption
By income
53%
of baby boomers are
doing out-of-home
activities
47%
of medium-income
households are doing
out-of-home activities
51%
of people who are
unvaccinated are doing
out-of-home activities
Consumers engaging in ‘normal’ out-of-home activities,1 % of respondents
Consumer engagement in out-of-home activities increased
meaningfully since February but declined slightly since August
45
48
33
36
36
27
20
Sept 2020
Nov 2020
Oct 2021
Feb 2021
Aug 2021
June 2020
May 2020
43
51
Vaccinated Unvaccinated
39 39
44
53
Gen Z Gen X
Millennials Baby boomers3
46 47
41
Low (<$50k) High (>$100k)
Medium
($50k–100k)
McKinsey & Company 29
Out-of-home activities done in the past 2 weeks1
% shown for respondents who engaged in the activity at least once prior to COVID-19
Out-of-home/homebody economy | Current as of October 2021
Source: McKinsey & Company COVID-19 US Consumer Pulse Survey, 10/9–10/15/2021, n = 2,095; 2/18–2/22/2021, n = 2,076, sampled and weighted to match the US general population 18+ years
1. Q: Did you leave your house for the following activities over the past 2 weeks?
Social
Personal
care
Entertain-
ment
56
26
28
28
31
35
47
54
51
Dine in at a restaurant or bar
Get together with family
Visit a crowded outdoor public place
Go out for family entertainment
Go to a hair or nail salon
Attend an indoor cultural event
Attend an outdoor event
Go to the gym or fitness studio
Get together with friends
62
88
75
41
34
41
39
17
32
22
25
Use public transportation
Go to a shopping mall
Work outside my home
Shop for groceries/necessities
Shop for non-necessities
Travel more than 2 hours by car
Travel by airplane
Stay in a hotel
Use ride-sharing service
Rent a short-term home
Travel by train
Work
Shopping
Transport/
travel
12
15
7
16
15
11
6
10
9
12
10
14
19
18
21
16
11
17
19
21
≥50%
<50%
Change >10 pp
Change from
Feb 2021,
percentage points
Change from
Feb 2021,
percentage points
Since February, consumer engagement increased outside of the home
with notable spikes in social, dining, and fitness activities
McKinsey & Company 30
Main life events done in the last 12 months as a result of COVID,1 % of respondents
Out-of-home/homebody economy | Current as of October 2021
Source: McKinsey & Company COVID-19 US Consumer Pulse Survey, 10/9–10/15/2021, n = 2,095, sampled and weighted to match the US general population 18+ years
Change >2 pp
25
10
9
14
14
13
15
6
7
6
5
Worked more from home
Decided to change jobs
Set up a gym at home
Moved into a smaller home
Started homeschooling children3
Renovated/remodeled my home
Moved into a bigger home
Set up a specific work-from-home space
Got a new pet at home (eg, dog, cat)
Bought a property
Sold a property
Work/study
change
Oct 2021
Pet adoption
House move
Home
renovation
Investments/
divestments
Total2
Change from
Feb 2021,
percentage points
15
36
12
31
10
1. Q: Which of the following have you done in the last 12 months as a result of the COVID-19 crisis?
2. Total percentage of people who choose option(s) in the category.
3. Data about starting homeschooling not available from Feb 2021.
Home renovations and job switching are elevated from February
2021
−1
−2
1
2
4
1
1
1
1
3
N/A
McKinsey & Company 31
Three themes are emerging among US consumers for the 2021
holiday shopping season
Expected strong demand
and omnichannel shopping
Consumer demand over the
holidays will likely be strong and
increasingly omnichannel
Spend pulled forward Loyalty switching at play
Consumers are spending earlier than
before, due to potential product
shortages, shipping delays, and
increased excitement to shop
Consumers are likely to switch
retailers and brands when products
are unavailable; companies will need
to prioritize consumer loyalty
1 2 3
Strong holiday outlook | Current as of October 2021
McKinsey & Company 32
While consumers have mixed attitudes toward the upcoming
holidays, higher-income consumers and millennials are excited
Strong holiday outlook | Current as of October 2021
1. Q: Which best describes your general attitude toward the holiday shopping season? Selected from "Anxious," "Stressed," "Neutral," "Eager," "Excited," and "Other.“
2. Gen Z are people under 25 years old, millennials are 25–44 years old, Gen X are 45–54 years old, and baby boomers are 55 years old and above.
3. Baby boomers includes silent generation.
Consumer attitudes toward the 2021 holiday shopping season,1 % of respondents
By income By generation2
36
28 33 27
26
25
33
52
38
47
34
21
Gen Z Gen X
Millennials Baby
boomers3
30
36
34
Overall
Excited,
eager
Neutral
Stressed,
anxious
35 31
21
40
38
29
25 31
50
Low (<$50k) Medium
($50k–100k)
High (>$100k)
Source: McKinsey & Company COVID-19 US Consumer Pulse Survey, 10/9–10/15/2021, n = 2,095, sampled and weighted to match the US general population 18+ years
McKinsey & Company 33
Spending is expected to be strong in the fourth quarter, particularly
for the discretionary, travel, and entertainment categories
Estimated year-over-year growth,1 % growth
1. Estimates are based on an analysis of historical credit- or debit-card spending data at the category level and expert analysis of current trends
2. Mass, cosmetics, discount stores, drug stores and pharmacies, grocery stores, home, out-of-home entertainment, pet supplies, restaurants, retail apparel, software and electronics, sporting apparel, travel, wholesale clubs
3. Cosmetics, home, pet supplies, retail apparel, software and electronics, sporting apparel
4. Restaurants, out-of-home entertainment, and travel.
5. Online portion of the consumer-spending categories.
Consumer
spending2
Discretionary
spending3
Travel and
entertainment spending4
E-commerce
spending5
2021 Q4 vs
2019 Q4
2021 Q4 vs
2020 Q4
7 11 8
40
9 26 25
-2
Source: Affnity Solutions credit-card and debit-card spend data from February 2019 to August 2021; Facteus debit-card spend data from February 2019 to August 2021; Stackline Amazon spend data from
February 2019 to August 2021
Strong Holiday Demand | Current as of August 2021
McKinsey & Company 34
On a year-over-year basis, Q4 spend on many
discretionary categories could see double-digit growth
Source: Affinity Solutions credit-card and debit-card spend Feb 2019–Aug 2021; Facteus debit-card spend data for Feb 2019–Aug 2021; Stackline Amazon spend data for Feb 2019–Aug 2021
Year-over-year spending,
forecasted Q4 2021 vs Q4 2020
Discretionary categories
Restaurants
Sporting apparel1
Home1
Cosmetics1
Pet supplies1
Retail apparel1
Out-of-home entertainment
Telecom/cable
Travel
Software and electronics1
Total discretionary
Year-over-year spending,
forecasted Q4 2021 vs Q4 2020
Essentials categories
Total essentials
Drugstores and pharmacies1
Grocery stores1
Wholesale clubs
Mass
Discount stores
1. Includes Amazon sales.
>5%
< −5% >10%
< −10% −5% to 5%
Strong holiday outlook | Current as of August 2021
McKinsey & Company 35
Holiday travel will likely increase in 2021 relative to 2020,
especially among higher-income consumers
1. Q: What best describes what you expect to do for the holidays this year [2021]? Figures may not sum to 100% because of rounding.
2. Q: What best describes your holiday get-togethers last year [2020]? Figures may not sum to 100% because of rounding.
3. Gen Z are people under 25 years old, millennials are 25–44 years old, Gen X are 45–54 years old, and baby boomers are 55 years old and above.
4. Baby boomers includes silent generation.
14
30
18
39
Will travel to and attend a large get-together
with family and friends
Will travel to a limited family get-together
Will not travel but will have a family/friends
get-together outside my immediate family
Do not plan to travel and will limit getting
together to immediate family only
Change by annual income Change by generation3
1 9 6
6 5 5 9 4
6 6 9 9 1 12
8 8
−3 0 −1 −3 −1 −8
−2 3
−8 −11 −16 −7 −9 −10
−11 −15
Medium
($50k–
100k)
Low
(<$50k)
High
(>$100k) Millennials Gen X
Gen Z
Baby
boomers4
Change
from 2020,2
percentage
points
Holiday plans in 20211
% of respondents
< −5 Between −5 and 5 >5
Difference from all respondents, percentage points
Source: McKinsey & Company COVID-19 US Consumer Pulse Survey, 10/9–10/15/2021, n = 2,095, sampled and weighted to match the US general population 18+ years
Strong holiday outlook | Current as of October 2021
McKinsey & Company 36
Compared with pre-COVID-19 levels, consumers plan to attend
slightly fewer in-person holiday events
1. Q: About how many in-person holiday-related events do you attend in a typical year without COVID-19?
2. Q: Compared with the number of in-person events you attended pre-COVID-19, about how many in-person events do you expect to attend over the holidays this coming year [2021]?
3. Gen Z are people under 25 years old, millennials are 25–44 years old, Gen X are 45–54 years old, and baby boomers are 55 years old and above.
4. Baby boomers includes silent generation.
6.7
4.0
2.7
Family gatherings
Work-related gatherings
Parties with friends
Event type
Between −1 and 1
< −1 >1
Millennials Gen X
Gen Z
Baby
boomers4
Generational cut3
7.8 8.9 6.5 4.7
5.2 5.9 3.7 2.1
3.3 4.9 2.8 0.5
Difference in
number vs
pre-COVID-19
−0.5
−0.8
−0.5
Holiday-related events consumers attended1 or expect to attend2 in 2021
Average number of events
Difference from all respondents, percentage points
Source: McKinsey & Company COVID-19 US Consumer Pulse Survey, 10/9–10/15/2021, n = 2,095, sampled and weighted to match the US general population 18+ years
Strong holiday outlook | Current as of October 2021
McKinsey & Company 37
Consumers have been shopping heavily omnichannel since the
COVID-19 pandemic started
Strong holiday outlook | Current as of August 2021
1. Q: Which best described how you have researched the following categories over the last 3 months?
34
32
30
25
25
24
21
21
21
20
18
17
17
16
15
16
14
14
60
61
64
63
62
69
64
65
67
59
64
69
65
67
69
60
71
64
6
7
6
12
13
7
15
14
12
21
18
14
18
17
16
24
15
22
Footwear
Pet food and supplies
Fitness and wellness services
Home improvement, gardening supplies
Groceries
Household supplies
Personal-care products
Skin care and makeup
Vitamins, supplements, OTC medicine
Kitchen and dining
Jewelry
Home decoration and furniture
Apparel
Accessories
Toys and baby supplies
Books, magazines, newspapers
Sports and outdoors equipment, supplies
Consumer electronics
Research and purchase only in-store Omnichannel Research and purchase only online
Product research and purchase by channel over the last 3 months1
% of respondents
Source: McKinsey & Company COVID-19 US Consumer Pulse Survey, 8/25–8/31/2021, n = 2,004, sampled and weighted to match the US general population 18+ years
McKinsey & Company 38
Consumers report planning to use a heavily omnichannel
approach for holiday research
37
33
33
27
25
21
16
15
10
Browsing in stores
Emails from relevant retailers
Brand websites
Social media
Retailer websites
Advertisements on TV or streaming media
Offline advertisements2
Browsing through holiday markets
Browsing in pop-up stores
Generational cut3
Gen Z
34
30
Millennials
37
28
Gen X
38
26
Baby
boomers4
39
18 14 11 3
18 17 17 13
13 18 16 30
60 50 33 11
22
23 30 37 37
14 17 14 14
36 33 28 18
Research channels
Between −3 and 3
< −3 >3
Difference from all respondents, percentage points
1. Q: Which channels are you planning to use to get new ideas and do research for your holiday shopping? Please select top 3.
2. Offline advertisements include catalogs, fliers, magazines, and newspaper advertisements.
3. Gen Z are people under 25 years old, millennials are 25–44 years old, Gen X are 45–54 years old, and baby boomers are 55 years old and above.
4. Baby boomers includes silent generation.
Consumer research plans by channel for holiday 20211
% of all respondents
Source: McKinsey & Company COVID-19 US Consumer Pulse Survey, 10/9–10/15/2021, n = 2,095, sampled and weighted to match the US general population 18+ years
Strong holiday outlook | Current as of October 2021
McKinsey & Company 39
Social media is influencing a majority of consumers’ holiday-buying
decisions and inspires over 80 percent of younger consumers
Source: McKinsey & Company COVID-19 US Consumer Pulse Survey, 10/9–10/15/2021, n = 2,095, sampled and weighted to match the US general population 18+ years
1. Q: How much influence do you expect social media to have on your holiday-purchase decisions this season? Selected from respondents who chose “significant influence” or “some influence.” Q: Which channels do you think will
influence your holiday purchase decisions? Asked of respondents indicating social media will influence their 2021 holiday purchases.
2. Gen Z are people under 25 years old, millennials are 25–44 years old, Gen X are 45–54 years old, and baby boomers are 55 years old and above. Baby boomers includes silent generation.
Expected influence by social media on 2021 holiday purchases, 1 % of respondents by generation2
Overall Gen Z Millennials Gen X
67
57 52
33
58
Baby boomers
44
67 63 61
87
71
60 64
36
83
76
59
43
27
60
66
35
25
4
25
Instagram
Facebook YouTube
All social media¹ TikTok
Strong holiday outlook | Current as of October 2021
McKinsey & Company 40
Consumers say they plan to shop more online as well as in person
47
24
27
Shop more online
Shop more in person
Shop earlier
Income cut
Gen Z
Millen-
nials Gen X
Baby
boom-
ers3
Shopping behaviors
Between −3 and 3
< −3 >3
Difference from all respondents, percentage points
1. Q: Please select all the ways you anticipate your holiday shopping might be different compared to last year. Figures may not sum to 100% because of rounding.
2. Gen Z are people under 25 years old, millennials are 25–44 years old, Gen X are 45–54 years old, and baby boomers are 55 years old and above.
3. Baby boomers includes silent generation.
Anticipated shopping behavior change for holiday 20211
% of all respondents Generational cut2
53 49
49 39
29 32 20 17
27 29 29 23
40 46 56
24 24 24
26 28 28
Medium
($50k–
100k)
Low
(<$50k)
High
(>$100k)
Source: McKinsey & Company COVID-19 US Consumer Pulse Survey, 10/9–10/15/2021, n = 2,095, sampled and weighted to match the US general population 18+ years
Strong holiday outlook | Current as of October 2021
McKinsey & Company 41
1. Q: Do you plan to shop for the holidays earlier or later in 2021 compared to last year’s holiday season (in 2020)? Possible answers: “significantly earlier”; “slightly earlier”; “starting at about the same time”; “slightly later”; “significantly
later”; “I am not planning to do any holiday season shopping.” Figures may not sum to 100% because of rounding.
2. Gen Z are people under 25 years old, millennials are 25–44 years old, Gen X are 45–54 years old, and baby boomers are 55 years old and above. Baby boomers includes silent generation.
7
39
52 51
9
Low
(<$50k)
42
Medium
($50k–100k)
50
40
10
High
(>$100k)
43
About the
same time
48
Later 9
Overall
Earlier
Overall By income By generation2
54
37
9
Gen Z
37
50
Baby
boomers
Millennials
13
45
48
63
8
Gen X
31
5
Compared with last year, over 40 percent of consumers plan to
start holiday shopping earlier
Holiday shopping start compared with last year1
% of respondents with intent of holiday shopping
Source: McKinsey & Company COVID-19 US Consumer Pulse Survey, 10/9–10/15/2021, n = 2,095, sampled and weighted to match the US general population 18+ years
15 7 5 1 5 9 16
9
No intent
of holiday
shopping
Strong holiday outlook | Current as of October 2021
McKinsey & Company 42
Almost half of consumers have started holiday shopping already
45
42
11
2
I already started
In November
In December
In January
3
2
−2
−3
22
31
47
75–100% of my shopping
50–74% of my shopping
1–49% of my shopping
Change from
Oct 2020
percentage points
1. Q: When do you plan to start your shopping for the seasonal holidays this year? Excludes 9% of consumers who indicated they do not plan to shop for the holidays this year. Figures may not sum to 100% because of rounding.
2. Q: How much of your holiday season shopping have you done so far? Asked of respondents who have indicated already started.
Holiday shopping timing 20211
% of respondents with intent for holiday shopping
Holiday season shopping status, 20212
% of respondents having already started
Source: McKinsey & Company COVID-19 US Consumer Pulse Survey, 10/9–10/15/2021, n = 2,095; 10/23–10/27/2020, n = 2,021, sampled and weighted to match the US general population 18+ years
Strong holiday outlook | Current as of October 2021
McKinsey & Company 43
US consumers plan to shop earlier because of supply-chain issues
and unexpected COVID-19 challenges
Source: McKinsey & Company COVID-19 US Consumer Pulse Survey, 10/9–10/15/2021, n = 2,095, sampled and weighted to match the US general population 18+ years
1. Q: What are the primary reasons you plan to shop earlier for the holidays in 2021?
2. Of the 43% of consumers who stated they plan to shop earlier in 2021.
Reasons for consumers to start shopping earlier in 2021,1 % of respondents2
45
are concerned about
shipping lead time
51
are concerned about
availability
29
just want to do
something fun
right now
38
of high-income and
millennial consumers
want to do something
fun right now
Concerns
44
are concerned about
unexpected challenges
from COVID-19
Excitement
Strong holiday outlook | Current as of October 2021
McKinsey & Company 44
Supply-chain challenges are expected to persist through and well
past this year’s holiday shopping season
Higher freight
costs
Port delays on the
inbound are now running
over and taking up to 30
days to unload; costs
across ocean, middle
mile, and last
mile rising amid
tightening capacity
Supply
assurance risk
64% of the international
sourcing community
believes volatility in
supply will continue to
lead to fragmentation
of retailers’ supplier
networks, potentially
resulting in additional
costs
Warehousing
rate volatility
Warehousing vacancies
have dropped to the
lowest levels on record,
leading to higher costs
per square foot, and
wages are expanding to
peak pandemic levels
Sustainability and
circularity
65% of consumers say
they want to buy
purpose-driven brands
that advocate
sustainability, and 24%
have followed through
with their wallet, placing
additional emphasis on
end-to-end supply-chain
visibility
Demand-driven
inventory pressures
As consumer spending
shifts from services to
goods for the first time in
over 60 years, this is
placing pressure on
traditional inventory
management methods,
which need to be nimble
and agile
Source: Achim Berg, Lara Haug, Saskia Hedrich, and Karl-Hendrik Magnus, “Time for change: How to use the crisis to make fashion sourcing more agile and sustainable,“ May 2020, McKinsey.com;
McKinsey CPO survey; McKinsey analysis
Strong holiday outlook | Current as of October 2021
McKinsey & Company 45
Labor shortage is at record-high levels, which are likely to persist
into 2022
1. Number of job openings divided by the sum of total employment and number of job openings.
6.0
1.0
5.0
0
2.0
3.0
4.0
7.0
US job openings rate1
%, through Aug 2021
2017 2018 2019 2020 Aug
2021
132
140
130
134
136
138
146
142
148
144
150
152
154
Nonfarm payroll employment
Millions, through Sept 2021
153
148
5
2017 2018 2019 2020 Sept
2021
Early shelter
in place due
to COVID-19
Source: US Bureau of Labor Statistics
Strong holiday outlook | Current as of October 2021
McKinsey & Company 46
This holiday season, roughly half of consumers expect to shop at
different retailers than in 2020
16
14
14
More value for money
Safety
Check more
things off my
list at once
Change from
Oct 2020
Percentage
points
−1
−14
−1
47
44
27
24
19
Shop more online
Shop earlier
Shop at a different place
Shop more in person
Shop more at local/independent stores
1. Q: Please select all the ways you anticipate your holiday shopping might be different compared to last year. Figures may not sum to 100% because of rounding.
Reasons to change place to
shop during holiday season
% of respondents
Anticipated holiday shopping behaviors1
% of respondents
Source: McKinsey & Company COVID-19 US Consumer Pulse Survey, 10/9–10/15/2021, n = 2,095; 10/23–10/27/2020, n = 2,021, sampled and weighted to
match the US general population 18+ years
Strong holiday outlook | Current as of October 2021
McKinsey & Company 47
Consumers prioritize better value and convenience when deciding
where to shop; younger consumers seek better quality
Source: McKinsey & Company COVID-19 US Consumer Pulse Survey, 10/9–10/15/2021, n = 2,095, sampled and weighted to match the US general population 18+ years
Event types
40
20
34
18
31
16
18
23
15
12
14
7
Ability to purchase most gifts from one place
Better prices/promotions
Better shipping/delivery costs
Product availability
Convenience
Easy to shop across store and online
Better quality
Ability to see products in person
Offers unique items
Cleaner/better hygiene measures
Supporting local businesses
Companies treating its employees well
Generational cut2
34
45
20
42
17
22
13
3
9
15
10
Gen Z
28
32
23
26
15
14
15
12
18
33
15
23
Millennials
29
34
20
30
17
20
14
10
18
33
15
19
Gen X
31
42
20
32
15
15
15
8
18
20
11
19
Baby
boomers
15
1. Q: Please tell us what your primary considerations will be when deciding where to shop. Please select up to 3.
2. Gen Z are people under 25 years old, millennials are 25–44 years old, Gen X are 45–54 years old, and baby boomers are 55 years old and above. Baby boomers includes silent generation.
Between −3 and 3
< −3 >3
Difference from all respondents, percentage points
Availability
Value
Convenience
Quality
Health/hygiene
Purpose-driven
Uniqueness
Primary considerations when deciding where to shop1
% of respondents
Strong holiday outlook | Current as of October 2021
McKinsey & Company 48
Actions retailers can take to retain consumer loyalty
Since consumers are
already shopping for
the holidays, it’s critical
to make sure
promotions happen
early
Prioritize fulfillment
Encourage consumers
to order early
Enable consumers to
check whether items
are in stock
When unexpected
supply-chain issues
pop up, communicate
alternative options as
well as dates when
items will come back in
stock
Turn to social media
early to influence
consideration and
purchase
Given how
omnichannel
consumers shop,
invest more in social
and digital channels
Prioritize positive and
meaningful customer
experiences to
strengthen brand and
reputation
Look beyond “saving
the sale” to focus on
creating brand
relationships and
enabling future sales
opportunities
With employee
retention at risk and
retail having famously
high turnover rates
even during non-
pandemic times, find
creative ways to hold
onto existing staff
Prioritize procuring the
most essential items
for this holiday season
Invest in a resilience
mindset and prepare
for new cost realities—
eg, diversify suppliers,
localize certain
fulfillment, and build
greater real-time
visibility into inventory
positions
Face supply-
chain pain with
short-term fixes
and long-term
planning
Take care of your
workforce
Get creative to
drive meaningful
experience
Make it a social
holiday
Move up the
promotion
schedule
Communicate
early and often
1 2 5
4
3 6
Strong holiday outlook | Current as of October 2021
McKinsey & Company 49
Examples of actions taken by retailers to retain consumers this
holiday season
Face supply-
chain pain with
short-term fixes
and long-term
planning
Take care of your
workforce
Get creative to
drive meaningful
experience
Make it a social
holiday
Move up the
promotion
schedule
Communicate
early and often
1 2 5
4
3 6
Costco has chartered
three of its own ships
to move goods
between Asia and
North America next
year
Walmart provided
employees who
worked on
Thanksgiving a free
meal and offered them
15 percent off a variety
of products in addition
to their usual 10
percent employee
discount
Carter’s prioritized
customer loyalty with
an email saying, “With
so much cyber cheer, it
could take a little extra
time to ship but we’re
working like elves to
make it as fast as
possible!” and offering
a discount on their
next order
Old Navy and other
clothing retailers are
creating TikTok videos,
hoping they will go
viral to drive sales to
younger consumers
Amazon started
offering limited-time
discounts throughout
October and
November
In October, the CEO of
children’s apparel
maker Hanna
Andersson emailed
customers to alert
them of potential
inventory challenges
and suggest they place
orders very early
Strong holiday outlook | Current as of October 2021
Examples

Mais conteúdo relacionado

Mais procurados

Mais procurados (20)

Liquidity for advanced manufacturing and automotive sectors in the face of Co...
Liquidity for advanced manufacturing and automotive sectors in the face of Co...Liquidity for advanced manufacturing and automotive sectors in the face of Co...
Liquidity for advanced manufacturing and automotive sectors in the face of Co...
 
MAPS2018 Keynote address on EY report: Life Sciences 4.0 – Securing value thr...
MAPS2018 Keynote address on EY report: Life Sciences 4.0 – Securing value thr...MAPS2018 Keynote address on EY report: Life Sciences 4.0 – Securing value thr...
MAPS2018 Keynote address on EY report: Life Sciences 4.0 – Securing value thr...
 
Economy SEA 2019 by google
Economy SEA 2019 by googleEconomy SEA 2019 by google
Economy SEA 2019 by google
 
Chinese Internet Economy White Paper 2.0 - Decoding the Chinese Internet 2.0:...
Chinese Internet Economy White Paper 2.0 - Decoding the Chinese Internet 2.0:...Chinese Internet Economy White Paper 2.0 - Decoding the Chinese Internet 2.0:...
Chinese Internet Economy White Paper 2.0 - Decoding the Chinese Internet 2.0:...
 
McKinsey Survey: US consumer sentiment during the coronavirus crisis
McKinsey Survey: US consumer sentiment during the coronavirus crisisMcKinsey Survey: US consumer sentiment during the coronavirus crisis
McKinsey Survey: US consumer sentiment during the coronavirus crisis
 
#BainWebinar Scenarios and Implications for Brazil
#BainWebinar Scenarios and Implications for Brazil#BainWebinar Scenarios and Implications for Brazil
#BainWebinar Scenarios and Implications for Brazil
 
Urban Mobility Is Evolving in Unexpected Ways Due to COVID-19
Urban Mobility Is Evolving in Unexpected Ways Due to COVID-19Urban Mobility Is Evolving in Unexpected Ways Due to COVID-19
Urban Mobility Is Evolving in Unexpected Ways Due to COVID-19
 
McKinsey Survey: Australian consumer sentiment during the coronavirus crisis
McKinsey Survey: Australian consumer sentiment during the coronavirus crisisMcKinsey Survey: Australian consumer sentiment during the coronavirus crisis
McKinsey Survey: Australian consumer sentiment during the coronavirus crisis
 
Mckinsey trends 2021
Mckinsey trends 2021Mckinsey trends 2021
Mckinsey trends 2021
 
20200610 Covid 19 - Global Auto Consumer Insights_Wave 2
20200610 Covid 19 - Global Auto Consumer Insights_Wave 220200610 Covid 19 - Global Auto Consumer Insights_Wave 2
20200610 Covid 19 - Global Auto Consumer Insights_Wave 2
 
Seven Forces Reshaping Enterprise Software
Seven Forces Reshaping Enterprise SoftwareSeven Forces Reshaping Enterprise Software
Seven Forces Reshaping Enterprise Software
 
Russian Consumers and the New Economic Reality
Russian Consumers and the New Economic RealityRussian Consumers and the New Economic Reality
Russian Consumers and the New Economic Reality
 
The Great Mobility Tech Race: Winning the battle for future profits
The Great Mobility Tech Race: Winning the battle for future profitsThe Great Mobility Tech Race: Winning the battle for future profits
The Great Mobility Tech Race: Winning the battle for future profits
 
Employee Inspiration: How to Create Energy That Drives Better Customer Outcomes
Employee Inspiration: How to Create Energy That Drives Better Customer OutcomesEmployee Inspiration: How to Create Energy That Drives Better Customer Outcomes
Employee Inspiration: How to Create Energy That Drives Better Customer Outcomes
 
What’s Chipping Away at Automotive Production
What’s Chipping Away at Automotive ProductionWhat’s Chipping Away at Automotive Production
What’s Chipping Away at Automotive Production
 
New horizons in transportation: mobility, innovation, economic development an...
New horizons in transportation: mobility, innovation, economic development an...New horizons in transportation: mobility, innovation, economic development an...
New horizons in transportation: mobility, innovation, economic development an...
 
Infrastructure Victoria - AZ/ZEV International Scan
Infrastructure Victoria - AZ/ZEV International ScanInfrastructure Victoria - AZ/ZEV International Scan
Infrastructure Victoria - AZ/ZEV International Scan
 
COVID-19 Auto & Mobility Consumer Insights
COVID-19 Auto & Mobility Consumer InsightsCOVID-19 Auto & Mobility Consumer Insights
COVID-19 Auto & Mobility Consumer Insights
 
What Does the Recovery of Demand for Urban Mobility Look Like Post-COVID-19?
What Does the Recovery of Demand for Urban Mobility Look Like Post-COVID-19?What Does the Recovery of Demand for Urban Mobility Look Like Post-COVID-19?
What Does the Recovery of Demand for Urban Mobility Look Like Post-COVID-19?
 
Global Asset Management 2014: Steering the Course to Growth
Global Asset Management 2014: Steering the Course to GrowthGlobal Asset Management 2014: Steering the Course to Growth
Global Asset Management 2014: Steering the Course to Growth
 

Semelhante a McKinsey Survey: US consumer sentiment during the coronavirus crisis

Semelhante a McKinsey Survey: US consumer sentiment during the coronavirus crisis (20)

McKinsey Survey: US consumer sentiment during the coronavirus crisis
McKinsey Survey: US consumer sentiment during the coronavirus crisisMcKinsey Survey: US consumer sentiment during the coronavirus crisis
McKinsey Survey: US consumer sentiment during the coronavirus crisis
 
McKinsey Survey: UK consumer sentiment during the coronavirus crisis
McKinsey Survey: UK consumer sentiment during the coronavirus crisisMcKinsey Survey: UK consumer sentiment during the coronavirus crisis
McKinsey Survey: UK consumer sentiment during the coronavirus crisis
 
McKinsey Survey: Chinese consumer sentiment during the coronavirus crisis
McKinsey Survey: Chinese consumer sentiment during the coronavirus crisisMcKinsey Survey: Chinese consumer sentiment during the coronavirus crisis
McKinsey Survey: Chinese consumer sentiment during the coronavirus crisis
 
McKinsey Survey: German consumer sentiment during the coronavirus crisis
McKinsey Survey: German consumer sentiment during the coronavirus crisisMcKinsey Survey: German consumer sentiment during the coronavirus crisis
McKinsey Survey: German consumer sentiment during the coronavirus crisis
 
McKinsey Survey: German consumer sentiment during the coronavirus crisis
McKinsey Survey: German consumer sentiment during the coronavirus crisisMcKinsey Survey: German consumer sentiment during the coronavirus crisis
McKinsey Survey: German consumer sentiment during the coronavirus crisis
 
McKinsey Survey: Spanish consumer sentiment during the coronavirus crisis
McKinsey Survey: Spanish consumer sentiment during the coronavirus crisisMcKinsey Survey: Spanish consumer sentiment during the coronavirus crisis
McKinsey Survey: Spanish consumer sentiment during the coronavirus crisis
 
McKinsey Survey: Italian consumer sentiment during the coronavirus crisis
McKinsey Survey: Italian consumer sentiment during the coronavirus crisisMcKinsey Survey: Italian consumer sentiment during the coronavirus crisis
McKinsey Survey: Italian consumer sentiment during the coronavirus crisis
 
McKinsey Survey: Italian consumer sentiment during the coronavirus crisis
McKinsey Survey: Italian consumer sentiment during the coronavirus crisisMcKinsey Survey: Italian consumer sentiment during the coronavirus crisis
McKinsey Survey: Italian consumer sentiment during the coronavirus crisis
 
McKinsey Survey: Indian consumer sentiment during the coronavirus crisis
McKinsey Survey: Indian consumer sentiment during the coronavirus crisisMcKinsey Survey: Indian consumer sentiment during the coronavirus crisis
McKinsey Survey: Indian consumer sentiment during the coronavirus crisis
 
McKinsey Survey: Japanese consumer sentiment during the coronavirus crisis
McKinsey Survey: Japanese consumer sentiment during the coronavirus crisisMcKinsey Survey: Japanese consumer sentiment during the coronavirus crisis
McKinsey Survey: Japanese consumer sentiment during the coronavirus crisis
 
McKinsey Survey: Australian consumer sentiment during the coronavirus crisis
McKinsey Survey: Australian consumer sentiment during the coronavirus crisisMcKinsey Survey: Australian consumer sentiment during the coronavirus crisis
McKinsey Survey: Australian consumer sentiment during the coronavirus crisis
 
McKinsey Survey: Australian consumer sentiment during the coronavirus crisis
McKinsey Survey: Australian consumer sentiment during the coronavirus crisisMcKinsey Survey: Australian consumer sentiment during the coronavirus crisis
McKinsey Survey: Australian consumer sentiment during the coronavirus crisis
 
McKinsey: Survey: Indonesian consumer sentiment during the coronavirus crisis
McKinsey: Survey: Indonesian consumer sentiment during the coronavirus crisisMcKinsey: Survey: Indonesian consumer sentiment during the coronavirus crisis
McKinsey: Survey: Indonesian consumer sentiment during the coronavirus crisis
 
McKinsey: Survey: Indonesian consumer sentiment during the coronavirus crisis
McKinsey: Survey: Indonesian consumer sentiment during the coronavirus crisisMcKinsey: Survey: Indonesian consumer sentiment during the coronavirus crisis
McKinsey: Survey: Indonesian consumer sentiment during the coronavirus crisis
 
McKinsey Survey: Chinese consumer sentiment during the coronavirus crisis
McKinsey Survey: Chinese consumer sentiment during the coronavirus crisisMcKinsey Survey: Chinese consumer sentiment during the coronavirus crisis
McKinsey Survey: Chinese consumer sentiment during the coronavirus crisis
 
McKinsey Survey: US consumer sentiment during the coronavirus crisis
McKinsey Survey: US consumer sentiment during the coronavirus crisisMcKinsey Survey: US consumer sentiment during the coronavirus crisis
McKinsey Survey: US consumer sentiment during the coronavirus crisis
 
McKinsey Survey: Indian consumer sentiment during the coronavirus crisis
McKinsey Survey: Indian consumer sentiment during the coronavirus crisisMcKinsey Survey: Indian consumer sentiment during the coronavirus crisis
McKinsey Survey: Indian consumer sentiment during the coronavirus crisis
 
McKinsey Survey: Indian consumer sentiment during the coronavirus crisis
McKinsey Survey: Indian consumer sentiment during the coronavirus crisisMcKinsey Survey: Indian consumer sentiment during the coronavirus crisis
McKinsey Survey: Indian consumer sentiment during the coronavirus crisis
 
McKinsey Survey: US consumer sentiment during the coronavirus crisis
McKinsey Survey: US consumer sentiment during the coronavirus crisisMcKinsey Survey: US consumer sentiment during the coronavirus crisis
McKinsey Survey: US consumer sentiment during the coronavirus crisis
 

Mais de McKinsey on Marketing & Sales

Mais de McKinsey on Marketing & Sales (20)

McKinsey European consumer sentiment survey: How current events are shaping S...
McKinsey European consumer sentiment survey: How current events are shaping S...McKinsey European consumer sentiment survey: How current events are shaping S...
McKinsey European consumer sentiment survey: How current events are shaping S...
 
McKinsey European consumer sentiment survey: How current events are shaping U...
McKinsey European consumer sentiment survey: How current events are shaping U...McKinsey European consumer sentiment survey: How current events are shaping U...
McKinsey European consumer sentiment survey: How current events are shaping U...
 
McKinsey European consumer sentiment survey: How current events are shaping I...
McKinsey European consumer sentiment survey: How current events are shaping I...McKinsey European consumer sentiment survey: How current events are shaping I...
McKinsey European consumer sentiment survey: How current events are shaping I...
 
McKinsey European consumer sentiment survey: How current events are shaping G...
McKinsey European consumer sentiment survey: How current events are shaping G...McKinsey European consumer sentiment survey: How current events are shaping G...
McKinsey European consumer sentiment survey: How current events are shaping G...
 
McKinsey European consumer sentiment survey: How current events are shaping F...
McKinsey European consumer sentiment survey: How current events are shaping F...McKinsey European consumer sentiment survey: How current events are shaping F...
McKinsey European consumer sentiment survey: How current events are shaping F...
 
McKinsey Survey: Indian consumer sentiment during the coronavirus crisis
McKinsey Survey: Indian consumer sentiment during the coronavirus crisisMcKinsey Survey: Indian consumer sentiment during the coronavirus crisis
McKinsey Survey: Indian consumer sentiment during the coronavirus crisis
 
McKinsey Survey: Korean consumer sentiment during the coronavirus crisis
McKinsey Survey: Korean consumer sentiment during the coronavirus crisisMcKinsey Survey: Korean consumer sentiment during the coronavirus crisis
McKinsey Survey: Korean consumer sentiment during the coronavirus crisis
 
McKinsey European consumer sentiment survey: How current events are shaping F...
McKinsey European consumer sentiment survey: How current events are shaping F...McKinsey European consumer sentiment survey: How current events are shaping F...
McKinsey European consumer sentiment survey: How current events are shaping F...
 
McKinsey European consumer sentiment survey: How current events are shaping U...
McKinsey European consumer sentiment survey: How current events are shaping U...McKinsey European consumer sentiment survey: How current events are shaping U...
McKinsey European consumer sentiment survey: How current events are shaping U...
 
McKinsey European consumer sentiment survey: How current events are shaping G...
McKinsey European consumer sentiment survey: How current events are shaping G...McKinsey European consumer sentiment survey: How current events are shaping G...
McKinsey European consumer sentiment survey: How current events are shaping G...
 
McKinsey European consumer sentiment survey: How current events in Europe are...
McKinsey European consumer sentiment survey: How current events in Europe are...McKinsey European consumer sentiment survey: How current events in Europe are...
McKinsey European consumer sentiment survey: How current events in Europe are...
 
McKinsey European consumer sentiment survey: How current events are shaping S...
McKinsey European consumer sentiment survey: How current events are shaping S...McKinsey European consumer sentiment survey: How current events are shaping S...
McKinsey European consumer sentiment survey: How current events are shaping S...
 
McKinsey European consumer sentiment survey: How current events are shaping I...
McKinsey European consumer sentiment survey: How current events are shaping I...McKinsey European consumer sentiment survey: How current events are shaping I...
McKinsey European consumer sentiment survey: How current events are shaping I...
 
McKinsey survey: European consumer sentiment survey: How current events are s...
McKinsey survey: European consumer sentiment survey: How current events are s...McKinsey survey: European consumer sentiment survey: How current events are s...
McKinsey survey: European consumer sentiment survey: How current events are s...
 
McKinsey survey: European consumer sentiment survey: How current events are s...
McKinsey survey: European consumer sentiment survey: How current events are s...McKinsey survey: European consumer sentiment survey: How current events are s...
McKinsey survey: European consumer sentiment survey: How current events are s...
 
McKinsey Survey: European consumer sentiment during the coronavirus crisis
McKinsey Survey: European consumer sentiment during the coronavirus crisisMcKinsey Survey: European consumer sentiment during the coronavirus crisis
McKinsey Survey: European consumer sentiment during the coronavirus crisis
 
McKinsey Survey: Korean consumer sentiment during the coronavirus crisis
McKinsey Survey: Korean consumer sentiment during the coronavirus crisisMcKinsey Survey: Korean consumer sentiment during the coronavirus crisis
McKinsey Survey: Korean consumer sentiment during the coronavirus crisis
 

Último

Mckinsey foundation level Handbook for Viewing
Mckinsey foundation level Handbook for ViewingMckinsey foundation level Handbook for Viewing
Mckinsey foundation level Handbook for Viewing
Nauman Safdar
 

Último (20)

Marel Q1 2024 Investor Presentation from May 8, 2024
Marel Q1 2024 Investor Presentation from May 8, 2024Marel Q1 2024 Investor Presentation from May 8, 2024
Marel Q1 2024 Investor Presentation from May 8, 2024
 
PARK STREET 💋 Call Girl 9827461493 Call Girls in Escort service book now
PARK STREET 💋 Call Girl 9827461493 Call Girls in  Escort service book nowPARK STREET 💋 Call Girl 9827461493 Call Girls in  Escort service book now
PARK STREET 💋 Call Girl 9827461493 Call Girls in Escort service book now
 
Mckinsey foundation level Handbook for Viewing
Mckinsey foundation level Handbook for ViewingMckinsey foundation level Handbook for Viewing
Mckinsey foundation level Handbook for Viewing
 
UAE Bur Dubai Call Girls ☏ 0564401582 Call Girl in Bur Dubai
UAE Bur Dubai Call Girls ☏ 0564401582 Call Girl in Bur DubaiUAE Bur Dubai Call Girls ☏ 0564401582 Call Girl in Bur Dubai
UAE Bur Dubai Call Girls ☏ 0564401582 Call Girl in Bur Dubai
 
Unveiling Falcon Invoice Discounting: Leading the Way as India's Premier Bill...
Unveiling Falcon Invoice Discounting: Leading the Way as India's Premier Bill...Unveiling Falcon Invoice Discounting: Leading the Way as India's Premier Bill...
Unveiling Falcon Invoice Discounting: Leading the Way as India's Premier Bill...
 
Ooty Call Gril 80022//12248 Only For Sex And High Profile Best Gril Sex Avail...
Ooty Call Gril 80022//12248 Only For Sex And High Profile Best Gril Sex Avail...Ooty Call Gril 80022//12248 Only For Sex And High Profile Best Gril Sex Avail...
Ooty Call Gril 80022//12248 Only For Sex And High Profile Best Gril Sex Avail...
 
HomeRoots Pitch Deck | Investor Insights | April 2024
HomeRoots Pitch Deck | Investor Insights | April 2024HomeRoots Pitch Deck | Investor Insights | April 2024
HomeRoots Pitch Deck | Investor Insights | April 2024
 
CROSS CULTURAL NEGOTIATION BY PANMISEM NS
CROSS CULTURAL NEGOTIATION BY PANMISEM NSCROSS CULTURAL NEGOTIATION BY PANMISEM NS
CROSS CULTURAL NEGOTIATION BY PANMISEM NS
 
How to Get Started in Social Media for Art League City
How to Get Started in Social Media for Art League CityHow to Get Started in Social Media for Art League City
How to Get Started in Social Media for Art League City
 
Berhampur CALL GIRL❤7091819311❤CALL GIRLS IN ESCORT SERVICE WE ARE PROVIDING
Berhampur CALL GIRL❤7091819311❤CALL GIRLS IN ESCORT SERVICE WE ARE PROVIDINGBerhampur CALL GIRL❤7091819311❤CALL GIRLS IN ESCORT SERVICE WE ARE PROVIDING
Berhampur CALL GIRL❤7091819311❤CALL GIRLS IN ESCORT SERVICE WE ARE PROVIDING
 
Pre Engineered Building Manufacturers Hyderabad.pptx
Pre Engineered  Building Manufacturers Hyderabad.pptxPre Engineered  Building Manufacturers Hyderabad.pptx
Pre Engineered Building Manufacturers Hyderabad.pptx
 
Berhampur 70918*19311 CALL GIRLS IN ESCORT SERVICE WE ARE PROVIDING
Berhampur 70918*19311 CALL GIRLS IN ESCORT SERVICE WE ARE PROVIDINGBerhampur 70918*19311 CALL GIRLS IN ESCORT SERVICE WE ARE PROVIDING
Berhampur 70918*19311 CALL GIRLS IN ESCORT SERVICE WE ARE PROVIDING
 
Organizational Transformation Lead with Culture
Organizational Transformation Lead with CultureOrganizational Transformation Lead with Culture
Organizational Transformation Lead with Culture
 
Falcon Invoice Discounting: Empowering Your Business Growth
Falcon Invoice Discounting: Empowering Your Business GrowthFalcon Invoice Discounting: Empowering Your Business Growth
Falcon Invoice Discounting: Empowering Your Business Growth
 
Call 7737669865 Vadodara Call Girls Service at your Door Step Available All Time
Call 7737669865 Vadodara Call Girls Service at your Door Step Available All TimeCall 7737669865 Vadodara Call Girls Service at your Door Step Available All Time
Call 7737669865 Vadodara Call Girls Service at your Door Step Available All Time
 
Cannabis Legalization World Map: 2024 Updated
Cannabis Legalization World Map: 2024 UpdatedCannabis Legalization World Map: 2024 Updated
Cannabis Legalization World Map: 2024 Updated
 
Nashik Call Girl Just Call 7091819311 Top Class Call Girl Service Available
Nashik Call Girl Just Call 7091819311 Top Class Call Girl Service AvailableNashik Call Girl Just Call 7091819311 Top Class Call Girl Service Available
Nashik Call Girl Just Call 7091819311 Top Class Call Girl Service Available
 
Horngren’s Cost Accounting A Managerial Emphasis, Canadian 9th edition soluti...
Horngren’s Cost Accounting A Managerial Emphasis, Canadian 9th edition soluti...Horngren’s Cost Accounting A Managerial Emphasis, Canadian 9th edition soluti...
Horngren’s Cost Accounting A Managerial Emphasis, Canadian 9th edition soluti...
 
GUWAHATI 💋 Call Girl 9827461493 Call Girls in Escort service book now
GUWAHATI 💋 Call Girl 9827461493 Call Girls in  Escort service book nowGUWAHATI 💋 Call Girl 9827461493 Call Girls in  Escort service book now
GUWAHATI 💋 Call Girl 9827461493 Call Girls in Escort service book now
 
Uneak White's Personal Brand Exploration Presentation
Uneak White's Personal Brand Exploration PresentationUneak White's Personal Brand Exploration Presentation
Uneak White's Personal Brand Exploration Presentation
 

McKinsey Survey: US consumer sentiment during the coronavirus crisis

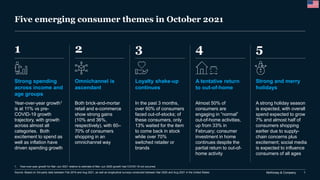
  • 1. McKinsey & Company 1 Five emerging consumer themes in October 2021 1 2 Source: Based on 3rd-party data between Feb 2019 and Aug 2021, as well as longitudinal surveys conducted between Mar 2020 and Aug 2021 in the United States 1. Year-over-year growth for Mar–Jun 2021 relative to estimate of Mar–Jun 2020 growth had COVID-19 not occurred. 5 4 3 Strong spending across income and age groups Omnichannel is ascendant Loyalty shake-up continues Strong and merry holidays A tentative return to out-of-home Year-over-year growth1 is at 11% vs pre- COVID-19 growth trajectory, with growth across almost all categories. Both excitement to spend as well as inflation have driven spending growth Both brick-and-mortar retail and e-commerce show strong gains (10% and 36%, respectively), with 60– 70% of consumers shopping in an omnichannel way In the past 3 months, over 60% of consumers faced out-of-stocks; of these consumers, only 13% waited for the item to come back in stock while over 70% switched retailer or brands Almost 50% of consumers are engaging in “normal” out-of-home activities, up from 33% in February; consumer investment in home continues despite the partial return to out-of- home activity A strong holiday season is expected, with overall spend expected to grow 7% and almost half of consumers shopping earlier due to supply- chain concerns plus excitement; social media is expected to influence consumers of all ages
  • 2. McKinsey & Company 2 Confidence in own country’s economic recovery after COVID-191 % of respondents 14 13 17 17 22 21 22 32 49 52 50 50 46 65 74 67 37 35 33 33 32 14 5 1 Mixed The economy will be impacted for 6–12 months or longer and will stagnate or show slow growth thereafter Pessimistic: COVID-19 will have lasting impact on the economy and show regression or fall into lengthy recession Optimistic: The economy will rebound within 2–3 months and grow just as strong as or stronger than before COVID-19 1. Q: What is your overall confidence level surrounding economic conditions after the coronavirus (COVID-19) crisis subsides (ie, once there is herd immunity)? Rated from 1 “very optimistic” to 6 “very pessimistic.” Bars may not sum to 100% due to rounding. Spending remains strong | Current as of October 2021 Germany 10/15–22 UK 10/15–22 Italy 10/15–22 France 10/15–22 Change in % optimistic vs Feb survey, percentage points US 10/9–15 +3 +3 +13 +14 +18 Spain 10/15–22 +16 India 10/18–25 +3 Source: McKinsey & Company COVID-19 Consumer Pulse Survey China 10/17–22 +6 +2 Japan 10/18–20 15 41 44 Sentiment ranges widely across global countries
  • 3. McKinsey & Company 3 15 16 17 17 20 18 16 14 13 14 16 15 45 48 50 48 46 46 45 44 46 45 41 41 40 36 33 35 34 36 39 42 41 41 43 44 Mar 20202 Nov 2020 May 2020 Apr 20202 June 2020 Aug 2020 Sept 2020 Oct 2020 Feb 2021 Aug 2021 Oct 2021 July 2020 Spending remains strong | Current as of October 2021 1. Q: What is your overall confidence level surrounding economic conditions after the coronavirus (COVID-19) crisis subsides (ie, once there is herd immunity)? Rated from 1 “very optimistic” to 6 “very pessimistic.” Figures may not sum to 100% because of rounding. 2. Average of weekly pulse surveys shown for March through April 2020. Optimistic: The economy will rebound within 2–3 months and grow just as strong as or stronger than before COVID-19 Mixed: The economy will be impacted for 6-12 months or longer and will stagnate or show slow growth thereafter Pessimistic: COVID- 19 will have lasting impact on the economy and show regression / fall into lengthy recession Source: McKinsey & Company COVID-19 US Consumer Pulse Survey, 10/9–10/15/2021, n = 2,095; 8/25–8/31/2021, n = 2,004; 2/18–2/22/2021, n = 2,076; 11/9–11/13/2020, n = 2,024; 10/23–10/27/2020, n = 2,021; 9/18–9/24/2020, n = 1,026; 8/19–8/23/2020, n = 2,026; 7/30–8/2/2020, n = 2,024; 7/7–7/12/2020, n = 1,923; 6/15–6/21/2020, n = 2,006; 6/1–6/7/2020, n = 1,966; 5/18–5/24/2020, n = 1,975; 5/11–5/17/2020, n = 2,002; 5/4–5/10/2020, n = 1,993; 4/27–5/3/2020, n = 2,105; 4/20–4/26/2020, n = 1,052; 4/13–4/19/2020, n = 1,052; 4/6–4/12/2020, n = 1,063; 3/30–4/5/2020, n = 1,484; 3/23–3/29/2020, n = 1,119; 3/20–3/22/2020, n = 1,073; 3/16–3/17/2020, n = 1,042, sampled and weighted to match the US general population 18+ years Overall optimism on economic recovery following the COVID-19 pandemic continues to slowly increase in 2021 Confidence in own country’s economic recovery after COVID-19,1 % of US respondents
  • 4. McKinsey & Company 4 Spending remains strong | Current as of October 2021 Confidence in own country’s economic recovery after COVID-19 by income level,1 % of respondents 30 30 35 36 32 41 38 39 39 45 48 54 57 61 0 30 65 25 15 10 5 20 50 35 40 55 45 60 July 2020 Sept 2020 Feb 2021 36 Aug 2021 Oct 2021 Low (<$50k) Medium ($50k–100k) High (>$100k) 24 21 18 20 21 18 16 15 12 10 10 7 10 0 15 5 20 30 25 35 40 45 65 50 55 60 17 July 2020 16 Sept 2020 14 Feb 2021 Oct 2021 Aug 2021 1. Q: What is your overall confidence level surrounding economic conditions after the coronavirus (COVID-19) crisis subsides (ie, once there is herd immunity)? Rated from 1 “very optimistic” to 6 “very pessimistic.” Optimism by income Pessimism by income Source: McKinsey & Company COVID-19 US Consumer Pulse Survey, 10/9–10/15/2021, n = 2,095; 8/25–8/31/2021, n = 2,004; 2/18–2/22/2021, n = 2,076; 9/18–9/24/2020, n = 1,026; 7/7–7/12/2020, n = 1,923; sampled and weighted to match the US general population 18+ years High-income consumer optimism continues to increase while middle- and low-income consumer optimism remains flat
  • 5. McKinsey & Company 5 Younger and vaccinated consumers also drive optimism Spending remains strong | Current as of October 2021 Confidence in own country’s economic recovery after COVID-191 % of respondents 1. Q: What is your overall confidence level surrounding economic conditions after the coronavirus (COVID-19) crisis subsides (ie, once there is herd immunity)? Rated from 1 “very optimistic” to 6 “very pessimistic.” 2. Gen Z are people under 25 years old, millennials are 25–44 years old, Gen X are 45–54 years old, and baby boomers are 55 years old and above. 3. Baby boomers includes silent generation. Source: McKinsey & Company COVID-19 US Consumer Pulse Survey, 10/9–10/15/2021, n = 2,095, sampled and weighted to match the US general population 18+ years By generation2 By vaccination status 9 10 26 16 Millennials 52 40 Gen Z 52 39 62 28 44 Gen X 22 Baby boomers3 Optimistic Mixed Pessimistic 11 28 42 36 47 36 Vaccinated Unvaccinated
  • 6. McKinsey & Company 6 Spending remains strong | Current as of October 2021 26 22 28 32 15 17 11 5 59 61 61 63 Gen Z Gen X Millennials Baby boomers 23 40 13 8 64 52 Unvaccinated Vaccinated 28 11 61 Overall 1. Q: When do you expect your routines will return to normal? Figures may not sum to 100% because of rounding. 2. Gen Z are people under 25 years old, millennials are 25–44 years old, Gen X are 45–54 years old, and baby boomers are 55 years old and above. Baby boomers includes silent generation. 3. Q: Which best describes your vaccination status? Source: McKinsey & Company COVID-19 US Consumer Pulse Survey, 10/9–10/15/2021, n = 2,095, sampled and weighted to match the US general population 18+ years Not affected/already returned In or after 2022 In 2021 By generation2 By vaccination status3 ~40% of unvaccinated individuals say their lives have already returned to normal Younger respondents, particularly the millennial generation, are most likely to say things have not returned to normal Approximately 60 percent of consumers expect a return to normalcy in 2022 or beyond Expectations on routines returning to normal,1 % of respondents
  • 7. McKinsey & Company 7 Household finances have improved slightly over the past year Spending remains strong | Current as of October 2021 Increased slightly/a lot About the same Reduced slightly/a lot 34 29 24 27 57 60 65 60 9 11 11 13 Past 2 weeks Past 2 weeks Past 2 weeks Past 2 weeks 41 37 34 35 45 43 49 49 14 20 17 16 Past 2 weeks Past 2 weeks Past 2 weeks Past 2 weeks 37 34 27 29 42 44 50 47 21 22 23 24 Past 2 weeks Past 2 weeks Past 2 weeks Past 2 weeks Source: McKinsey & Company COVID-19 US Consumer Pulse Survey 10/9–10/15/2021, n = 2,095; 8/25–8/31/2021, n = 2,004; 2/18–2/22/2021, n = 2,076; 11/9–11/13/2020, n = 2,024, sampled and weighted to match the US general population 18+ years 1. Q: How has the coronavirus (COVID-19) crisis affected the following over the past 2 weeks? Figures may not sum to 100% because of rounding. Household income Household spending Household savings Feb 18–22 Aug 25–31 Oct 9–15 Nov 9–13 Feb 18–22 Aug 25–31 Oct 9–15 Nov 9–13 Feb 18–22 Aug 25–31 Oct 9–15 Nov 9–13 COVID-19 impact on household finances,1 % of respondents
  • 8. McKinsey & Company 8 About 50 percent of consumers say it will take until 2022 for household finances to return to normal Spending remains strong | Current as of October 2021 1. Q: When do you expect your personal/household finances will return to normal? Figures may not sum to 100% because of rounding. 2. Gen Z are people under 25 years old, millennials are 25–44 years old, Gen X are 45–54 years old, and baby boomers are 55 years old and above. Baby boomers includes silent generation. 3. Q: Which best describes your vaccination status? Source: McKinsey & Company COVID-19 US Consumer Pulse Survey, 10/9–10/15/2021, n = 2,095, sampled and weighted to match the US general population 18+ years By generation2 By vaccination status3 ~60% of baby boomers say their finances either were not affected or are back to normal, vs ~30% for Gen Z and millennials Expectations on personal/household finances returning to normal,1 % of respondents 42 42 10 7 48 51 Vaccinated Unvaccinated 28 28 38 63 12 14 11 60 58 51 34 Millennials Baby boomers Gen Z Gen X 3 In or after 2022 Not affected/already returned In 2021 42 9 49 Overall
  • 9. McKinsey & Company 9 Spending remains strong | Current as of October 2021 Younger and higher-income consumers plan to spend more than older consumers and those with lower incomes 1. Q: With regard to products and services you will spend money on, do you plan to splurge/treat yourself in 2021? For example, are there categories of products or services you have spent less on over the last year and half which you feel you will spend more on now? 2. Gen Z are people under 25 years old, millennials are 25–44 years old, Gen X are 45–54 years old, and baby boomers are 55 years old and above. Baby boomers includes silent generation. Source: McKinsey & Company COVID-19 US Consumer Pulse Survey, 10/9–10/15/2021, n = 2,095; 8/25–8/31/2021, n = 2,004; 2/18–2/22/2021, n = 2,076, sampled and weighted to match the US general population 18+ years 59 41 42 51 49 Feb 2021 Aug 2021 58 Oct 2021 Plan on splurging Do not plan on splurging Millennials Gen X Baby boomers 49 −4 68 5 Gen Z 72 6 42 −8 63 −3 70 −10 22 −5 22 −11 29 −18 28 −4 34 −17 51 −14 Generation 2 Respondents who plan/do not plan to splurge/treat themselves in 20211 % of respondents Low (<$50k/year) Middle ($50–100k/year) High (>$100k/year) >70% <30% 50–70% 30–50% pp change from Feb 21 XX Respondents who plan to splurge, by household income, % Change < −10 pp .
  • 10. McKinsey & Company 10 Consumers’ intentions to splurge are moderating since early 2021; baby boomers indicate intent to spend on travel and experiences Spending remains strong | Current as of October 2021 Categories where consumers intend to treat themselves1 % of all respondents with intent to splurge 1. Q: You mentioned that you plan to splurge/treat yourself in next 6 months. Which categories do you intend to treat yourself to? Please select all that apply. 2. Gen Z are people under 25 years old, millennials are 25–44 years old, Gen X are 45–54 years old, and baby boomers are 55 years old and above. Baby boomers includes silent generation. 41 37 32 30 29 28 27 26 24 24 21 19 17 Apparel, shoes, and accessories Electronics Restaurants, dining out, bars Personal services Items for your home Makeup and skin-care products Travel, lodging, and vacation Household essentials Fitness Sports apparel and equipment Out-of-home entertainment Pets Outdoor living Millennials Gen X Gen Z Baby boomers Generational cut2 Change from Feb 2021, percentage points Source: McKinsey & Company COVID-19 US Consumer Pulse Survey, 10/9–10/15/2021, n = 2,095; 2/18–2/22/2021, n = 2,076, sampled and weighted to match the US general population 18+ years Between −3 and +3 < −3 > +3 Categories Difference from all respondents, percentage points 47 44 39 31 31 36 37 43 33 37 30 23 40 35 26 16 28 32 34 19 24 27 30 34 22 31 26 22 19 29 28 22 28 28 25 11 18 28 28 12 19 24 18 19 30 19 19 12 19 21 20 6 2 –9 –5 N/A –3 –16 –3 –2 –3 N/A –7 N/A N/A
  • 11. McKinsey & Company 11 Spending remains strong | Current as of September 2021 Source: Affinity Solutions credit-card spend data for 2/2019–9/2021 1. Includes credit-card and some debit-card spending data among banked consumers; does not include spending that is difficult to track (eg, at small businesses) and/or for channels where non-credit-card forms of payment (cash, check, bank transfers, etc) are common (healthcare, insurance, utilities, housing, etc). Year-over-year growth in monthly sales during current period (2/2020–9/2021) compared with monthly sales in prior period (2/2019–9/2020). 2. Year-over-year spend in Mar–Sept 2020 decreased by 8% compared with same period in previous year, whereas Sept–Feb remained flat compared with same period in previous year. 3. Re-forecasted Mar–Sept 2020 spend calculated by growing Feb–Sept 2020 spend by the same 1-month growth rate observed between Feb and Sept 2019. 10 −6 −18 −9 −6 −5 −3 1 2 1 −2 3 −4 4 5 5 7 6 6 11 July Aug Mar Feb July 21 Apr Feb May May June Sept Dec Oct Nov Jan Mar 27 June Apr Aug Sept 20 20 40 25 22 1st round of stimulus 2nd round of stimulus Holiday pull- forward spend 3rd round of stimulus vs re- forecasted Sept 2020 spend had COVID-19 not occurred3 vs Sept 2020 actual spend Comparison to pre-COVID-19 months Comparison to COVID-affected months Mar–Aug 6-month YoY: -8%2 Sept–Feb 6-month YoY: 0%2 Year-over-year credit-card spend,1 % September continues trend of strong growth, with an uptick potentially due to inflation and an earlier start on holiday spending
  • 12. McKinsey & Company 12 Spending remains strong | Current as of September 2021 Source: Affinity Solutions credit-card spend data from 2/2019–9/2021; US Bureau of Labor Statistics 1. Includes credit-card and some debit-card spending data among banked consumers; does not include spending that is difficult to track (e.g., at small businesses) and/or for channels where non-credit card forms of payment (cash, check, banks transfers, etc.) are common (healthcare, insurance, utilities, housing, etc.). Year-over-year growth in monthly sales during current period (2/2020–9/2021) compared to monthly sales in prior period (2/2019–9/2020). Re-forecasted Mar-Sept 2020 spend calculated by growing Feb-Sept 2020 spend by the same 1-month growth rate observed between Feb-Sept 2019. 10 -6 -18 -9 -6 -5 -3 2 1 -2 3 -4 4 5 5 7 6 6 11 -15 -5 -20 -10 0 5 10 15 Apr Feb Mar May June July Aug 1 Mar Dept Oct Nov Dec Jan Feb Apr May June July Aug Sept Change in US Consumer Price Index (CPI) per annum, % Adjusted year-over-year credit-card spend1, % As spending has increased, inflation has also gone up
  • 13. McKinsey & Company 13 Spending remains strong | Current as of September 2021 Source: Affinity credit card spend data for Feb 2019–Sept 2021; spend samples cardholders and underrepresents highest- and lowest-income bands Year-over-year credit-card spend by population subsegment,1 % 20 −30 −20 −10 10 0 30 June Feb Mar Apr Dec May June Oct July Sept Aug Apr Sept Nov Jan Feb Mar May July Aug Low (<$35k) Medium ($35k–80k) High (>$80,000) Stimulus payment Low-income consumers Medium-income consumers High-income consumers Change in spend, by income level,1 % 2020 2021 1. Re-forecasted Mar–Sept 2020 spend calculated by growing Feb–Sept 2020 spend by the same 1-month growth rate observed for Feb–Sept 2019. Sept 2021 vs Sept 2020 year-over-year change 19 9 12 US consumer spending shows continued, robust growth across all income groups > 5% < −5%
  • 14. McKinsey & Company 14 Spending remains strong | Current as of September 2021 Source: Affinity credit card spend data for Feb 2019–Sept 2021; spend samples cardholders and underrepresents highest- and lowest-income bands −30 20 −10 −20 30 0 10 Jan Apr Oct Mar June Mar Feb Apr May July June July Aug Sept Sept Nov Dec Feb May Aug 18–37 (millennials) 52+ (baby boomers) 38–51 (Gen X) Year-over-year credit-card spend by population subsegment,1 % Stimulus payment Baby boomers Gen X Millennials Change in spend,1 by age group,2 % 2020 2021 Sept 2021 vs Sept 2020 year-over-year change 7 18 13 > 5% < −5% While millennials’ spending growth outpaces other cohorts, baby boomers’ trajectory is on the rise 1. Re-forecasted Mar–Sept 2020 spend calculated by growing Feb–Sept 2020 spend by the same 1-month growth rate observed for Feb–Sept 2019. 2. Age brackets: baby boomers (52+), Gen X (38–51), millennials (18–37). Data for lower-income consumers (<$35,000) underrepresented across all generational groups.
  • 15. McKinsey & Company 15 Spending remains strong | Current as of September 2021 Early pandemic May–July 2020 Later 2020 Aug–Dec YTD 2021 Jan–Sept Description A Robust year-over-year growth throughout, due to larger consumer shifts (eg, homebody economy) Sustained elevation B Fast rise in early days of COVID-19, with growth subsiding over time Normalizing growth C Steady demand, not affected by COVID-19 Unaffected D Significant declines at the outset of COVID-19, with quicker recovery Approaching recovery E Larger decline (−50% or more year over year), with slower path to recovery / Larger decline Categories/channels  Software and electronics  Home  Pet supplies  Sporting apparel  Cosmetics  Grocery stores  Discount stores  Mass stores  Wholesale clubs  Drugstores and pharmacies  Telecom/cable  Retail apparel  Fuel and other auto  Restaurants  Out-of-home entertainment  Travel Channel and category performance has evolved into five distinct performance types over the course of the pandemic
  • 16. McKinsey & Company 16 Spending remains strong | Current as of September 2021 −15 0 15 30+ YoY growth, % −30 < −45 Source: Affinity credit card spend data for Feb 2019–Sept 2021; Stackline Amazon spend data for Feb 2019–Sept 2021 Sustained elevation Normalizing growth Approaching recovery Larger decline Unaffected Software and electronics3 Home3 Pet supplies3 Sporting apparel3 Restaurants Auto Retail apparel3 Out-of-home entertainment Travel Total Discount stores Wholesale clubs Mass Drugstores, pharmacies3 Cosmetics3 Grocery stores3 Telecom/cable 13 15 15 6 9 10 5 30 5 10 4 15 10 7 14 9 7 Pre- COVID- 19 Feb 2020 9 2 24 −14 −24 −21 −43 −52 −46 −6 18 20 15 22 −9 36 −4 Early shelter in place, Mar 28 35 21 27 −1 −16 −9 −78 −49 0 13 13 8 10 8 10 1 Fall Aug–Oct 29 24 18 −6 −26 −41 −53 −79 −72 −13 9 0 9 2 1 15 2 E- commerce acceleration Apr–May 23 28 19 25 −10 −22 −15 −79 −56 −5 9 9 3 9 9 9 0 Early summer June–July 26 34 24 36 3 −3 3 −62 −28 4 31 13 7 4 30 5 2 Mar–Apr adjusted2 20 28 6 22 11 16 7 8 −6 −18 −12 5 −78 9 −48 0 2 Holiday Nov–Dec 25 21 22 36 5 −1 7 −28 −12 6 10 12 7 7 25 6 −1 May–Jun adjusted2 12 15 26 30 7 4 6 −26 −8 6 15 15 6 13 26 8 0 Jul-Aug adjusted2 22 30 22 21 −2 −8 −5 −75 −48 −1 13 12 10 1 14 9 2 2021 Jan–Feb 1. Excludes sales in automotive, beauty, grocery, home improvement, home and furniture, pet supplies, apparel and accessories, electronics, sports and outdoors, as these categories are embedded into subsequent rows. 2. YoY growth for Mar–Sept 2021 relative to estimate of Mar–Sept 2020 had COVID not occurred. Re-forecasted Mar–Sept 2020 spend calculated by growing Feb–Sept 2020 spend by the same 1-month growth rate observed for Feb– Sept 2019. 3. Includes Amazon sales. Spending growth in most categories other than out-of-home entertainment and travel is now at or past pre-COVID levels Year-over-year (YoY) sales growth,1 % 16 26 32 40 9 12 10 −25 −11 11 19 25 9 20 33 13 4 Sept adjusted2 Sept sees a split in spending performance in categories having had sustained elevation
  • 17. McKinsey & Company 17 Omnichannel is ascendant | Current as of September 2021 1. Includes credit-card and some debit-card spending data among banked consumers. While card spending represents only a part of overall consumer spending (such as housing, utilities, and other major categories excluded from credit-card spending), the changes in card data closely track changes in official consumption figures reported by the Bureau of Economic Analysis. This is because the share of unaffected categories in card spending is comparable with the share of categories not affected negatively by COVID-19 in overall consumption (which includes housing). Year-over-year growth in monthly sales during current period (Feb 2020–Sept 2021) compared with monthly sales in prior period (Feb 2019– Sept 2020). 2. Year-over-year growth for Mar–Sept 2021 relative to estimate of Mar–Sept 2020 had COVID not occurred. Re-forecasted Mar–Sept 2020 spend calculated by growing Feb–Sept 2020 spend by the same 1-month growth rate observed for Feb–Sept 2019. 3. Includes the following retail channels: Amazon brick and mortar; apparel; software and electronics; cosmetics; pet supplies; home stores; mass stores; club stores; restaurants; grocery stores; drugstores; discount stores; auto and cable/telecom (not shown separately); and experiences, including out-of-home entertainment and travel. 4. Includes the following retailer categories: Amazon; apparel; software and electronics; cosmetics; pet supplies; home stores; mass stores; club stores; restaurants; grocery stores; drugstores; and discount stores. Source: Affinity Solutions credit-card spend data from Feb 2019–Sept 2021; Stackline Amazon spend data, Feb 2019–Sept 2021 Year-over-year sales growth, % −10 0 10 20 −20 −30 30 Total3 Brick- and- mortar sales3 E-com- merce sales4 Year-over- year change, last 12 mos vs last 13–24 mos E-com- merce accele- ration Apr–May Early summer June–July Holiday Nov–Dec Early 2021 Jan–Feb Fall Aug–Oct May2 Early shelter in place Mar Pre- COVID-19 Feb 2020 Start of recovery2 Mar–Apr June- July2 −13 −5 0 −1 0 11 −6 10 5 5 7 7 −13 −3 −2 2 3 10 1 7 5 6 5 5 62 52 41 44 49 36 27 24 48 34 32 32 Aug2 Retail channel, year-over-year growth in spend,1 2019–21, % Growth in spend shifts to e-commerce in September as total spend grows 11 percent year-over-year 4 4 40 Sept2
  • 18. McKinsey & Company 18 Source: Affinity Solutions credit-card and debit-card spend data for Feb 2019–Sept 2021; Facteus debit-card spend data for Feb 2019–Sept 2021; Stackline Amazon spend data for Feb 2019–Sept 2021 1. Includes the following retailer categories: Amazon, apparel, software and electronics, cosmetics stores, pet supplies, home stores, mass stores, club stores, restaurants, grocery stores, drugstores, discount stores. 2. Last 12 months. Omnichannel is ascendant | Current as of September 2021 ~30% Increase in online penetration since Mar 2020, based on credit- card and debit- card spend Retail-oriented online credit-card and debit-card spend as % of total1 19 20 27 27 25 26 25 25 25 29 30 27 26 26 25 24 26 24 25 25 LTM2 Mar 2020 June Apr Aug May Sept July Oct Nov Dec Jan Feb Mar Apr May June July Aug Sept 2021 ~30% Online penetration holds steady at about 30 percent above pre-COVID-19 levels
  • 19. McKinsey & Company 19 E-commerce share of total retail sales1 % Omnichannel is ascendant | Current as of September 2021 Source: Affinity credit card spend data for Feb 2019–Sept 2021; Stackline Amazon spend data for Feb 2019–Sept 2021 1. Year-over-year growth for Mar–Sept 2021 relative to estimate of Mar–Sept 2020 had COVID not occurred. Re-forecasted Mar–Sept 2020 spend calculated by growing Feb–Sept 2020 spend by the same 1-month growth rate observed for Feb–Sept 2019. 2. Excludes sales in automotive, beauty, grocery, home improvement, home and furniture, pet supplies, apparel and accessories, electronics, sports and outdoors, as these categories are embedded into subsequent rows. 3. Includes Amazon sales. 2021 (May– June) 25 12 1 67 20 8 34 62 10 37 76 45 11 (July) 24 11 1 66 20 7 33 61 9 36 74 43 10 Current (Sept) 25 12 1 68 22 8 35 63 9 36 73 44 10 Total e-commerce penetration by retailer category2 Mass Discount stores Cosmetics3 Drugstores, pharmacies3 Grocery stores3 Home3 Pet supplies3 Restaurants Retail apparel3 Software and electronics3 Sporting apparel3 Wholesale clubs E-commerce penetration 20 30 40 50+ 10 0 19 6 1 53 16 5 30 55 4 33 68 38 8 Pre- COVID-19 (Feb) 20 8 0 68 19 6 32 60 7 43 78 49 8 Early shelter in place (Mar) 27 12 0 90 21 7 36 67 10 67 89 66 11 E- commerce acceleration (Apr–May) 25 11 0 72 20 7 34 61 9 43 82 50 10 Early summer (June– July) 25 11 1 67 20 7 35 60 9 41 79 47 10 Fall (Aug–Oct) 25 11 1 70 20 7 36 61 8 44 80 50 10 Holiday (Nov–Dec) 27 13 1 70 21 8 38 63 11 45 79 50 11 Early 2021 (Jan–Feb) 26 12 1 70 20 9 35 63 10 39 77 46 11 Start of recovery (Mar–Apr) Essentials Discretionary Online penetration remains stable across all channels 25 11 1 67 22 8 34 62 10 39 75 46 12 (Aug)
  • 20. McKinsey & Company 20 Omnichannel is ascendant | Current as of September 2021 Source: Affinity Solutions credit-card and debit-card spend data for Feb 2019–Sept 2021; Facteus debit-card spend data for Feb 2019–Sept 2021; Stackline Amazon spend data, Feb 2019–Sept 2021 46 83 55 Pre- COVID-19, last 12 months5 Apr 2020 spike Sept 2021 +20% 13 19 19 Pre- COVID-19, last 12 months5 Apr 2020 spike Sept 2021 +46% 5 9 10 Pre- COVID-19, last 12 months5 Apr 2020 spike Sept 2021 +100% High penetration2 (>20%) Moderate penetration3 (7–20%) Low penetration4 (<7%) Categories with lower pre-COVID-19 online penetration saw higher e-commerce growth in March and may be more likely to sustain online penetration rates seen during the pandemic Categories with already high online penetration saw a dramatic spike during April’s lockdowns 1. Re-forecasted Mar–Sept 2020 spend calculated by growing Feb–Sept 2020 spend by the same 1-month growth rate observed for Feb–Sept 2019. 2. High-online-penetration retail categories include those with >20% pre-COVID-19 internet penetration: apparel, software and electronics, cosmetics, pet supplies. 3. Medium-online-penetration retail categories include those with 7–20% pre-COVID-19 internet penetration: home stores, mass stores, club stores. 4. Low-online-penetration retail categories include those with <7% pre-COVID-19 internet penetration: restaurants, grocery stores, drugstores, discount stores. 5. Online penetration from Mar 2019 to Feb 2020. The trajectory of e-commerce penetration differs by category and remains elevated compared with pre-COVID-19 levels Online sales as % of overall sales for credit-card and debit-card spend,1 by level of pre-COVID-19 penetration
  • 21. McKinsey & Company 21 −10 30 0 10 20 40 50 60 70 80 90 100 110 Timeline YoY growth, % Since April of this year, Amazon’s growth has decelerated but is still higher versus pre-COVID-19 period Omnichannel is ascendant | Current as of September 2021 Year-over-year (YoY) growth for Amazon sales, 2019–21, % Source: Stackline Amazon spend data, Jan 2019–Sept 2021 Pre- COVID-19 (Jan–Feb) Early shelter in place (Mar) E- commerce acceleration (Apr–May) Early summer (June–July) Holiday (Nov–Dec) 16 14 43 46 36 2020 2021 Fall (Aug–Oct) 39 2021 (Jan–Feb) 31 Thanksgiving July 4th Christmas Labor Day Stimulus New Year’s Day Stimulus 2021 (Apr–May) 28 2021 (June–July) 18 2021 (Mar) 61 XX YoY growth in given period, % Prime day Prime Day lapping Negative growth rate due to delayed Prime Day (originally in week 29 in 2019) No data for week 1 in 2021 Negative growth due to accelerated July 4 (week 27 in 2021 vs week 28 in 2020) 2021 (Aug) 10 2021 (Sept) 8
  • 22. McKinsey & Company 22 Six or seven in ten consumers shop across all categories in an omnichannel way Strong holiday outlook | Current as of August 2021 1. Q: Which best described how you have researched the following categories over the last 3 months? 35 33 31 24 24 22 20 20 22 20 17 17 15 16 16 13 16 12 58 60 62 63 63 70 66 65 65 60 62 69 68 65 65 61 70 65 7 7 7 13 13 8 14 15 13 20 21 14 17 19 19 26 14 23 Household supplies Home decoration and furniture Groceries Pet food and supplies Skin care and makeup Footwear Personal-care products Home improvement, gardening supplies Vitamins, supplements, OTC medicine Accessories Fitness and wellness services Kitchen and dining Jewelry Apparel Toys and baby supplies Books, magazines, newspapers Sports and outdoors equipment, supplies Consumer electronics Research and purchase only in-store Omnichannel Research and purchase only online Product research and purchase by channel over the last 3 months1 % of respondents Source: McKinsey & Company COVID-19 US Consumer Pulse Survey, 10/9–10/15/2021, n = 2,095, sampled and weighted to match the US general population 18+ years
  • 23. McKinsey & Company 23 Social-media influence heaviest on Gen Z and millennials, though influence is pervasive across generations for select categories 1. Q: Think about the purchases you have made in the following categories over the past 3 months. Were you influenced toward a certain brand by a post on social media in the following categories?. 2. Gen Z are people under 25 years old, millennials are 25–44 years old, Gen X are 45–54 years old, and baby boomers are 55 years old and above. Baby boomers includes silent generation. 49 47 44 41 39 37 34 34 34 32 30 26 25 24 23 22 Accessories Jewelry Household supplies Sports and outdoors equipment and supplies Fitness and wellness services Skin care and makeup Home decoration and furniture Consumer electronics Apparel Footwear Kitchen and dining Home improvement and gardening supplies Personal-care products Vitamins, supplements, over-the-counter medicine Groceries Pet food and supplies Millennials Gen X Gen Z Baby boomers Generational cut2 Source: McKinsey & Company COVID-19 US Consumer Pulse Survey, 10/9–10/15/2021, n = 2,095, sampled and weighted to match the US general population 18+ years Categories Categories where respondents were influenced by social media1 % of all respondents who purchased in these categories in the last 3 months 65 46 14 59 61 37 8 57 60 40 8 55 57 37 13 60 56 31 16 54 59 30 10 56 52 32 11 63 57 28 11 51 56 30 8 41 53 28 8 54 55 29 7 37 47 25 6 32 47 23 9 34 30 59 37 42 41 41 24 22 22 5 7 5 Top 3 categories influenced by social media Omnichannel is ascendant | Current as of October 2021
  • 24. McKinsey & Company 24 Most consumers would rather switch brands or retailers than wait for out-of-stock items Source: McKinsey & Company COVID-19 US Consumer Pulse Survey, 10/9–10/15/2021, n = 2,095, sampled and weighted to match the US general population 18+ years 1. Q: Over the last 3 months, have you wanted to buy something and not been able to purchase it because it was out of stock or otherwise not available? 2. Q: The most recent time this happened (when you wanted to buy something and it was not available), what did you do? Respondents who planned to purchase something but could not, due to unavailability1 % of respondents Switched brand or product 62 could not purchase at least 1 item Did not buy Waited 13 16 39 32 Switched retailer Response of potential purchasers² Loyalty shake-up continues | Current as of October 2021
  • 25. McKinsey & Company 25 Loyalty shake-up continues | Current as of October 2021 Source: McKinsey & Company COVID-19 US Consumer Pulse Survey, 10/9–10/15/2021, n = 2,095; 2/18–2/22/2021, n = 2,076, sampled and weighted to match the US general population 18+ years Generational cut2 Between −3 and 3 < −3 >3 1. Q: Over the past 3 months, which of the following have you done? 28% replied “None of these.” 2. Gen Z are people under 25 years old, millennials are 25–44 years old, Gen X are 45–54 years old, and baby boomers are 55 years old and above. 3. “New digital shopping” method includes downloaded a new app, signed up for a new subscription. 4. “New shopping method” includes curbside pickup and delivery apps. Behaviors in the past 3 months1 % of respondents Changes in consumer behavior have been more extensive among younger and high-income consumers Difference from all respondents, percentage points 72 43 36 30 25 24 Different retailer/store/website New digital shopping method3 Any new shopping behavior Different brand Private label/store brand New shopping method3 High (>$100k/year) Gen Z Millennials Income cut All consumers 84 85 87 46 49 49 46 42 48 34 30 35 34 37 36 33 37 34
  • 26. McKinsey & Company 26 Reason for trying a new brand since COVID-19 began1 % of respondents who tried a new brand since COVID-19 began Loyalty shake-up continues | Current as of October 2021 1. Q: You mentioned you tried a new/different brand than what you normally buy. What were the main reasons that drove this decision? Select up to 3 relevant reasons. “Brand” includes different brand, new private label/store brand. Over-arching reason based on % of individual respondents responding to at least 1 reason in the group. 2. Gen Z are people under 25 years old, millennials are 25–44 years old, Gen X are people 45–54 years old, and baby boomers are 55 years old and above. Baby boomers includes silent generation. Source: McKinsey & Company COVID-19 US Consumer Pulse Survey, 10/9–10/15/2021, n = 2,095; 2/18–2/22/2021, n = 2,076, sampled and weighted to match the US general population 18+ years Better prices, promotions 20 Better shipping, delivery cost Products are in stock Larger package sizes Shares my values Supporting local businesses More sustainable, better for the environment The company treats its employees well Better quality Natural, organic 12 Wanted to try a new brand I found 21 Wanted to try a type of product I’ve never tried before 8 Better value Wanted variety, change from my normal routine Available where I’m shopping (ie, in store or online) Cleaner, safer 5 34 34 12 9 11 10 7 21 16 12 14 9 Wanted to treat myself Novelty Personal choice Purpose-driven Quality/organic Convenience Health/hygiene Availability 19 Value 66 26 28 33 14 10 23 Baby boomers Gen Z + millennials2 Gen X All consumers Between −3 and 3 < −3 >3 Older consumers focus most on value and prices, while younger consumers are most interested in quality x Net % of respondents per category Difference from all respondents, percentage points 42 35 44 38 7 11 8 7 26 19 8 7 5 9 1 11 2 2 12 25 5 6 25 17 17 18 10 13 11 15 18 12 5 10 28 24 17 15 16 12 8 12 8 26 13 19 15 14 11 11 13
  • 27. McKinsey & Company 27 Source: McKinsey Sept 2019–Sept 2021 Global Sentiment Surveys US consumers are trading down almost three times more in 2021 than pre-pandemic levels, but less than in 2020 Loyalty shake-up continues | Current as of October 2021 4 16 11 5 5 6 2.75X US income tiers, household, annual $50k–100k >$100k <$50k 1. Q: Please indicate how your buying behavior has changed in a standard shopping basket for the items shown in the past 12 months (since September 2020). Select all that apply with option 7 being mutually exclusive and option 1 exclusive from option 2. Possible answers: (1) “Switching to less expensive brands”; (2) “Buying the same brand as I bought 12 months ago but at stores with lower prices”; (3) “Buying only when on sale or with coupon”; (4) “Buying less frequently or lower quantity of the same brand”; (5) “Switching to more expensive/premium brands”;( 6) “Have made some other change in how I buy these products”; (7) “Have not made changes in how I buy these products.” Trade down reflects option 1 as a percentage of all consumers, while trade up reflects option 5 as a percentage of all consumers. Total 2019 2020 2021 3 10 7 6 10 10 3 17 10 6 3 6 6 18 15 4 3 3 Trade down Trade up Trade-off behavior in a standard shopping basket among all consumers by income tier1 % of consumers, Sept 2021, Sept 2020, and Sept 2019
  • 28. McKinsey & Company 28 Out-of-home/homebody economy | Current as of October 2021 Overall 1. Q: Which best describes when you will regularly return to stores, restaurants, and other out-of-home activities? Chart shows those saying they are already participating in these activities. 2. Gen Z are people under 25 years old, millennials are 25–44 years old, Gen X are 45–54 years old, and baby boomers are 55 years old and above. 3. Baby boomers includes silent generation. Source: McKinsey & Company COVID-19 US Consumer Pulse Survey, 10/9–10/15/2021, n = 2,095; 8/25–8/31/2021, n = 2,004; 2/18–2/22/2021, n = 2,076; 11/9–11/13/2020, n = 2,024; 9/18–9/24/2020, n = 1,026; 6/15–6/21/2020, n = 2,006; 5/18–5/24/2020, n = 1,975, sampled and weighted to match the US general population 18+ years By generation2 By vaccination adoption By income 53% of baby boomers are doing out-of-home activities 47% of medium-income households are doing out-of-home activities 51% of people who are unvaccinated are doing out-of-home activities Consumers engaging in ‘normal’ out-of-home activities,1 % of respondents Consumer engagement in out-of-home activities increased meaningfully since February but declined slightly since August 45 48 33 36 36 27 20 Sept 2020 Nov 2020 Oct 2021 Feb 2021 Aug 2021 June 2020 May 2020 43 51 Vaccinated Unvaccinated 39 39 44 53 Gen Z Gen X Millennials Baby boomers3 46 47 41 Low (<$50k) High (>$100k) Medium ($50k–100k)
  • 29. McKinsey & Company 29 Out-of-home activities done in the past 2 weeks1 % shown for respondents who engaged in the activity at least once prior to COVID-19 Out-of-home/homebody economy | Current as of October 2021 Source: McKinsey & Company COVID-19 US Consumer Pulse Survey, 10/9–10/15/2021, n = 2,095; 2/18–2/22/2021, n = 2,076, sampled and weighted to match the US general population 18+ years 1. Q: Did you leave your house for the following activities over the past 2 weeks? Social Personal care Entertain- ment 56 26 28 28 31 35 47 54 51 Dine in at a restaurant or bar Get together with family Visit a crowded outdoor public place Go out for family entertainment Go to a hair or nail salon Attend an indoor cultural event Attend an outdoor event Go to the gym or fitness studio Get together with friends 62 88 75 41 34 41 39 17 32 22 25 Use public transportation Go to a shopping mall Work outside my home Shop for groceries/necessities Shop for non-necessities Travel more than 2 hours by car Travel by airplane Stay in a hotel Use ride-sharing service Rent a short-term home Travel by train Work Shopping Transport/ travel 12 15 7 16 15 11 6 10 9 12 10 14 19 18 21 16 11 17 19 21 ≥50% <50% Change >10 pp Change from Feb 2021, percentage points Change from Feb 2021, percentage points Since February, consumer engagement increased outside of the home with notable spikes in social, dining, and fitness activities
  • 30. McKinsey & Company 30 Main life events done in the last 12 months as a result of COVID,1 % of respondents Out-of-home/homebody economy | Current as of October 2021 Source: McKinsey & Company COVID-19 US Consumer Pulse Survey, 10/9–10/15/2021, n = 2,095, sampled and weighted to match the US general population 18+ years Change >2 pp 25 10 9 14 14 13 15 6 7 6 5 Worked more from home Decided to change jobs Set up a gym at home Moved into a smaller home Started homeschooling children3 Renovated/remodeled my home Moved into a bigger home Set up a specific work-from-home space Got a new pet at home (eg, dog, cat) Bought a property Sold a property Work/study change Oct 2021 Pet adoption House move Home renovation Investments/ divestments Total2 Change from Feb 2021, percentage points 15 36 12 31 10 1. Q: Which of the following have you done in the last 12 months as a result of the COVID-19 crisis? 2. Total percentage of people who choose option(s) in the category. 3. Data about starting homeschooling not available from Feb 2021. Home renovations and job switching are elevated from February 2021 −1 −2 1 2 4 1 1 1 1 3 N/A
  • 31. McKinsey & Company 31 Three themes are emerging among US consumers for the 2021 holiday shopping season Expected strong demand and omnichannel shopping Consumer demand over the holidays will likely be strong and increasingly omnichannel Spend pulled forward Loyalty switching at play Consumers are spending earlier than before, due to potential product shortages, shipping delays, and increased excitement to shop Consumers are likely to switch retailers and brands when products are unavailable; companies will need to prioritize consumer loyalty 1 2 3 Strong holiday outlook | Current as of October 2021
  • 32. McKinsey & Company 32 While consumers have mixed attitudes toward the upcoming holidays, higher-income consumers and millennials are excited Strong holiday outlook | Current as of October 2021 1. Q: Which best describes your general attitude toward the holiday shopping season? Selected from "Anxious," "Stressed," "Neutral," "Eager," "Excited," and "Other.“ 2. Gen Z are people under 25 years old, millennials are 25–44 years old, Gen X are 45–54 years old, and baby boomers are 55 years old and above. 3. Baby boomers includes silent generation. Consumer attitudes toward the 2021 holiday shopping season,1 % of respondents By income By generation2 36 28 33 27 26 25 33 52 38 47 34 21 Gen Z Gen X Millennials Baby boomers3 30 36 34 Overall Excited, eager Neutral Stressed, anxious 35 31 21 40 38 29 25 31 50 Low (<$50k) Medium ($50k–100k) High (>$100k) Source: McKinsey & Company COVID-19 US Consumer Pulse Survey, 10/9–10/15/2021, n = 2,095, sampled and weighted to match the US general population 18+ years
  • 33. McKinsey & Company 33 Spending is expected to be strong in the fourth quarter, particularly for the discretionary, travel, and entertainment categories Estimated year-over-year growth,1 % growth 1. Estimates are based on an analysis of historical credit- or debit-card spending data at the category level and expert analysis of current trends 2. Mass, cosmetics, discount stores, drug stores and pharmacies, grocery stores, home, out-of-home entertainment, pet supplies, restaurants, retail apparel, software and electronics, sporting apparel, travel, wholesale clubs 3. Cosmetics, home, pet supplies, retail apparel, software and electronics, sporting apparel 4. Restaurants, out-of-home entertainment, and travel. 5. Online portion of the consumer-spending categories. Consumer spending2 Discretionary spending3 Travel and entertainment spending4 E-commerce spending5 2021 Q4 vs 2019 Q4 2021 Q4 vs 2020 Q4 7 11 8 40 9 26 25 -2 Source: Affnity Solutions credit-card and debit-card spend data from February 2019 to August 2021; Facteus debit-card spend data from February 2019 to August 2021; Stackline Amazon spend data from February 2019 to August 2021 Strong Holiday Demand | Current as of August 2021
  • 34. McKinsey & Company 34 On a year-over-year basis, Q4 spend on many discretionary categories could see double-digit growth Source: Affinity Solutions credit-card and debit-card spend Feb 2019–Aug 2021; Facteus debit-card spend data for Feb 2019–Aug 2021; Stackline Amazon spend data for Feb 2019–Aug 2021 Year-over-year spending, forecasted Q4 2021 vs Q4 2020 Discretionary categories Restaurants Sporting apparel1 Home1 Cosmetics1 Pet supplies1 Retail apparel1 Out-of-home entertainment Telecom/cable Travel Software and electronics1 Total discretionary Year-over-year spending, forecasted Q4 2021 vs Q4 2020 Essentials categories Total essentials Drugstores and pharmacies1 Grocery stores1 Wholesale clubs Mass Discount stores 1. Includes Amazon sales. >5% < −5% >10% < −10% −5% to 5% Strong holiday outlook | Current as of August 2021
  • 35. McKinsey & Company 35 Holiday travel will likely increase in 2021 relative to 2020, especially among higher-income consumers 1. Q: What best describes what you expect to do for the holidays this year [2021]? Figures may not sum to 100% because of rounding. 2. Q: What best describes your holiday get-togethers last year [2020]? Figures may not sum to 100% because of rounding. 3. Gen Z are people under 25 years old, millennials are 25–44 years old, Gen X are 45–54 years old, and baby boomers are 55 years old and above. 4. Baby boomers includes silent generation. 14 30 18 39 Will travel to and attend a large get-together with family and friends Will travel to a limited family get-together Will not travel but will have a family/friends get-together outside my immediate family Do not plan to travel and will limit getting together to immediate family only Change by annual income Change by generation3 1 9 6 6 5 5 9 4 6 6 9 9 1 12 8 8 −3 0 −1 −3 −1 −8 −2 3 −8 −11 −16 −7 −9 −10 −11 −15 Medium ($50k– 100k) Low (<$50k) High (>$100k) Millennials Gen X Gen Z Baby boomers4 Change from 2020,2 percentage points Holiday plans in 20211 % of respondents < −5 Between −5 and 5 >5 Difference from all respondents, percentage points Source: McKinsey & Company COVID-19 US Consumer Pulse Survey, 10/9–10/15/2021, n = 2,095, sampled and weighted to match the US general population 18+ years Strong holiday outlook | Current as of October 2021
  • 36. McKinsey & Company 36 Compared with pre-COVID-19 levels, consumers plan to attend slightly fewer in-person holiday events 1. Q: About how many in-person holiday-related events do you attend in a typical year without COVID-19? 2. Q: Compared with the number of in-person events you attended pre-COVID-19, about how many in-person events do you expect to attend over the holidays this coming year [2021]? 3. Gen Z are people under 25 years old, millennials are 25–44 years old, Gen X are 45–54 years old, and baby boomers are 55 years old and above. 4. Baby boomers includes silent generation. 6.7 4.0 2.7 Family gatherings Work-related gatherings Parties with friends Event type Between −1 and 1 < −1 >1 Millennials Gen X Gen Z Baby boomers4 Generational cut3 7.8 8.9 6.5 4.7 5.2 5.9 3.7 2.1 3.3 4.9 2.8 0.5 Difference in number vs pre-COVID-19 −0.5 −0.8 −0.5 Holiday-related events consumers attended1 or expect to attend2 in 2021 Average number of events Difference from all respondents, percentage points Source: McKinsey & Company COVID-19 US Consumer Pulse Survey, 10/9–10/15/2021, n = 2,095, sampled and weighted to match the US general population 18+ years Strong holiday outlook | Current as of October 2021
  • 37. McKinsey & Company 37 Consumers have been shopping heavily omnichannel since the COVID-19 pandemic started Strong holiday outlook | Current as of August 2021 1. Q: Which best described how you have researched the following categories over the last 3 months? 34 32 30 25 25 24 21 21 21 20 18 17 17 16 15 16 14 14 60 61 64 63 62 69 64 65 67 59 64 69 65 67 69 60 71 64 6 7 6 12 13 7 15 14 12 21 18 14 18 17 16 24 15 22 Footwear Pet food and supplies Fitness and wellness services Home improvement, gardening supplies Groceries Household supplies Personal-care products Skin care and makeup Vitamins, supplements, OTC medicine Kitchen and dining Jewelry Home decoration and furniture Apparel Accessories Toys and baby supplies Books, magazines, newspapers Sports and outdoors equipment, supplies Consumer electronics Research and purchase only in-store Omnichannel Research and purchase only online Product research and purchase by channel over the last 3 months1 % of respondents Source: McKinsey & Company COVID-19 US Consumer Pulse Survey, 8/25–8/31/2021, n = 2,004, sampled and weighted to match the US general population 18+ years
  • 38. McKinsey & Company 38 Consumers report planning to use a heavily omnichannel approach for holiday research 37 33 33 27 25 21 16 15 10 Browsing in stores Emails from relevant retailers Brand websites Social media Retailer websites Advertisements on TV or streaming media Offline advertisements2 Browsing through holiday markets Browsing in pop-up stores Generational cut3 Gen Z 34 30 Millennials 37 28 Gen X 38 26 Baby boomers4 39 18 14 11 3 18 17 17 13 13 18 16 30 60 50 33 11 22 23 30 37 37 14 17 14 14 36 33 28 18 Research channels Between −3 and 3 < −3 >3 Difference from all respondents, percentage points 1. Q: Which channels are you planning to use to get new ideas and do research for your holiday shopping? Please select top 3. 2. Offline advertisements include catalogs, fliers, magazines, and newspaper advertisements. 3. Gen Z are people under 25 years old, millennials are 25–44 years old, Gen X are 45–54 years old, and baby boomers are 55 years old and above. 4. Baby boomers includes silent generation. Consumer research plans by channel for holiday 20211 % of all respondents Source: McKinsey & Company COVID-19 US Consumer Pulse Survey, 10/9–10/15/2021, n = 2,095, sampled and weighted to match the US general population 18+ years Strong holiday outlook | Current as of October 2021
  • 39. McKinsey & Company 39 Social media is influencing a majority of consumers’ holiday-buying decisions and inspires over 80 percent of younger consumers Source: McKinsey & Company COVID-19 US Consumer Pulse Survey, 10/9–10/15/2021, n = 2,095, sampled and weighted to match the US general population 18+ years 1. Q: How much influence do you expect social media to have on your holiday-purchase decisions this season? Selected from respondents who chose “significant influence” or “some influence.” Q: Which channels do you think will influence your holiday purchase decisions? Asked of respondents indicating social media will influence their 2021 holiday purchases. 2. Gen Z are people under 25 years old, millennials are 25–44 years old, Gen X are 45–54 years old, and baby boomers are 55 years old and above. Baby boomers includes silent generation. Expected influence by social media on 2021 holiday purchases, 1 % of respondents by generation2 Overall Gen Z Millennials Gen X 67 57 52 33 58 Baby boomers 44 67 63 61 87 71 60 64 36 83 76 59 43 27 60 66 35 25 4 25 Instagram Facebook YouTube All social media¹ TikTok Strong holiday outlook | Current as of October 2021
  • 40. McKinsey & Company 40 Consumers say they plan to shop more online as well as in person 47 24 27 Shop more online Shop more in person Shop earlier Income cut Gen Z Millen- nials Gen X Baby boom- ers3 Shopping behaviors Between −3 and 3 < −3 >3 Difference from all respondents, percentage points 1. Q: Please select all the ways you anticipate your holiday shopping might be different compared to last year. Figures may not sum to 100% because of rounding. 2. Gen Z are people under 25 years old, millennials are 25–44 years old, Gen X are 45–54 years old, and baby boomers are 55 years old and above. 3. Baby boomers includes silent generation. Anticipated shopping behavior change for holiday 20211 % of all respondents Generational cut2 53 49 49 39 29 32 20 17 27 29 29 23 40 46 56 24 24 24 26 28 28 Medium ($50k– 100k) Low (<$50k) High (>$100k) Source: McKinsey & Company COVID-19 US Consumer Pulse Survey, 10/9–10/15/2021, n = 2,095, sampled and weighted to match the US general population 18+ years Strong holiday outlook | Current as of October 2021
  • 41. McKinsey & Company 41 1. Q: Do you plan to shop for the holidays earlier or later in 2021 compared to last year’s holiday season (in 2020)? Possible answers: “significantly earlier”; “slightly earlier”; “starting at about the same time”; “slightly later”; “significantly later”; “I am not planning to do any holiday season shopping.” Figures may not sum to 100% because of rounding. 2. Gen Z are people under 25 years old, millennials are 25–44 years old, Gen X are 45–54 years old, and baby boomers are 55 years old and above. Baby boomers includes silent generation. 7 39 52 51 9 Low (<$50k) 42 Medium ($50k–100k) 50 40 10 High (>$100k) 43 About the same time 48 Later 9 Overall Earlier Overall By income By generation2 54 37 9 Gen Z 37 50 Baby boomers Millennials 13 45 48 63 8 Gen X 31 5 Compared with last year, over 40 percent of consumers plan to start holiday shopping earlier Holiday shopping start compared with last year1 % of respondents with intent of holiday shopping Source: McKinsey & Company COVID-19 US Consumer Pulse Survey, 10/9–10/15/2021, n = 2,095, sampled and weighted to match the US general population 18+ years 15 7 5 1 5 9 16 9 No intent of holiday shopping Strong holiday outlook | Current as of October 2021
  • 42. McKinsey & Company 42 Almost half of consumers have started holiday shopping already 45 42 11 2 I already started In November In December In January 3 2 −2 −3 22 31 47 75–100% of my shopping 50–74% of my shopping 1–49% of my shopping Change from Oct 2020 percentage points 1. Q: When do you plan to start your shopping for the seasonal holidays this year? Excludes 9% of consumers who indicated they do not plan to shop for the holidays this year. Figures may not sum to 100% because of rounding. 2. Q: How much of your holiday season shopping have you done so far? Asked of respondents who have indicated already started. Holiday shopping timing 20211 % of respondents with intent for holiday shopping Holiday season shopping status, 20212 % of respondents having already started Source: McKinsey & Company COVID-19 US Consumer Pulse Survey, 10/9–10/15/2021, n = 2,095; 10/23–10/27/2020, n = 2,021, sampled and weighted to match the US general population 18+ years Strong holiday outlook | Current as of October 2021
  • 43. McKinsey & Company 43 US consumers plan to shop earlier because of supply-chain issues and unexpected COVID-19 challenges Source: McKinsey & Company COVID-19 US Consumer Pulse Survey, 10/9–10/15/2021, n = 2,095, sampled and weighted to match the US general population 18+ years 1. Q: What are the primary reasons you plan to shop earlier for the holidays in 2021? 2. Of the 43% of consumers who stated they plan to shop earlier in 2021. Reasons for consumers to start shopping earlier in 2021,1 % of respondents2 45 are concerned about shipping lead time 51 are concerned about availability 29 just want to do something fun right now 38 of high-income and millennial consumers want to do something fun right now Concerns 44 are concerned about unexpected challenges from COVID-19 Excitement Strong holiday outlook | Current as of October 2021
  • 44. McKinsey & Company 44 Supply-chain challenges are expected to persist through and well past this year’s holiday shopping season Higher freight costs Port delays on the inbound are now running over and taking up to 30 days to unload; costs across ocean, middle mile, and last mile rising amid tightening capacity Supply assurance risk 64% of the international sourcing community believes volatility in supply will continue to lead to fragmentation of retailers’ supplier networks, potentially resulting in additional costs Warehousing rate volatility Warehousing vacancies have dropped to the lowest levels on record, leading to higher costs per square foot, and wages are expanding to peak pandemic levels Sustainability and circularity 65% of consumers say they want to buy purpose-driven brands that advocate sustainability, and 24% have followed through with their wallet, placing additional emphasis on end-to-end supply-chain visibility Demand-driven inventory pressures As consumer spending shifts from services to goods for the first time in over 60 years, this is placing pressure on traditional inventory management methods, which need to be nimble and agile Source: Achim Berg, Lara Haug, Saskia Hedrich, and Karl-Hendrik Magnus, “Time for change: How to use the crisis to make fashion sourcing more agile and sustainable,“ May 2020, McKinsey.com; McKinsey CPO survey; McKinsey analysis Strong holiday outlook | Current as of October 2021
  • 45. McKinsey & Company 45 Labor shortage is at record-high levels, which are likely to persist into 2022 1. Number of job openings divided by the sum of total employment and number of job openings. 6.0 1.0 5.0 0 2.0 3.0 4.0 7.0 US job openings rate1 %, through Aug 2021 2017 2018 2019 2020 Aug 2021 132 140 130 134 136 138 146 142 148 144 150 152 154 Nonfarm payroll employment Millions, through Sept 2021 153 148 5 2017 2018 2019 2020 Sept 2021 Early shelter in place due to COVID-19 Source: US Bureau of Labor Statistics Strong holiday outlook | Current as of October 2021
  • 46. McKinsey & Company 46 This holiday season, roughly half of consumers expect to shop at different retailers than in 2020 16 14 14 More value for money Safety Check more things off my list at once Change from Oct 2020 Percentage points −1 −14 −1 47 44 27 24 19 Shop more online Shop earlier Shop at a different place Shop more in person Shop more at local/independent stores 1. Q: Please select all the ways you anticipate your holiday shopping might be different compared to last year. Figures may not sum to 100% because of rounding. Reasons to change place to shop during holiday season % of respondents Anticipated holiday shopping behaviors1 % of respondents Source: McKinsey & Company COVID-19 US Consumer Pulse Survey, 10/9–10/15/2021, n = 2,095; 10/23–10/27/2020, n = 2,021, sampled and weighted to match the US general population 18+ years Strong holiday outlook | Current as of October 2021
  • 47. McKinsey & Company 47 Consumers prioritize better value and convenience when deciding where to shop; younger consumers seek better quality Source: McKinsey & Company COVID-19 US Consumer Pulse Survey, 10/9–10/15/2021, n = 2,095, sampled and weighted to match the US general population 18+ years Event types 40 20 34 18 31 16 18 23 15 12 14 7 Ability to purchase most gifts from one place Better prices/promotions Better shipping/delivery costs Product availability Convenience Easy to shop across store and online Better quality Ability to see products in person Offers unique items Cleaner/better hygiene measures Supporting local businesses Companies treating its employees well Generational cut2 34 45 20 42 17 22 13 3 9 15 10 Gen Z 28 32 23 26 15 14 15 12 18 33 15 23 Millennials 29 34 20 30 17 20 14 10 18 33 15 19 Gen X 31 42 20 32 15 15 15 8 18 20 11 19 Baby boomers 15 1. Q: Please tell us what your primary considerations will be when deciding where to shop. Please select up to 3. 2. Gen Z are people under 25 years old, millennials are 25–44 years old, Gen X are 45–54 years old, and baby boomers are 55 years old and above. Baby boomers includes silent generation. Between −3 and 3 < −3 >3 Difference from all respondents, percentage points Availability Value Convenience Quality Health/hygiene Purpose-driven Uniqueness Primary considerations when deciding where to shop1 % of respondents Strong holiday outlook | Current as of October 2021
  • 48. McKinsey & Company 48 Actions retailers can take to retain consumer loyalty Since consumers are already shopping for the holidays, it’s critical to make sure promotions happen early Prioritize fulfillment Encourage consumers to order early Enable consumers to check whether items are in stock When unexpected supply-chain issues pop up, communicate alternative options as well as dates when items will come back in stock Turn to social media early to influence consideration and purchase Given how omnichannel consumers shop, invest more in social and digital channels Prioritize positive and meaningful customer experiences to strengthen brand and reputation Look beyond “saving the sale” to focus on creating brand relationships and enabling future sales opportunities With employee retention at risk and retail having famously high turnover rates even during non- pandemic times, find creative ways to hold onto existing staff Prioritize procuring the most essential items for this holiday season Invest in a resilience mindset and prepare for new cost realities— eg, diversify suppliers, localize certain fulfillment, and build greater real-time visibility into inventory positions Face supply- chain pain with short-term fixes and long-term planning Take care of your workforce Get creative to drive meaningful experience Make it a social holiday Move up the promotion schedule Communicate early and often 1 2 5 4 3 6 Strong holiday outlook | Current as of October 2021
  • 49. McKinsey & Company 49 Examples of actions taken by retailers to retain consumers this holiday season Face supply- chain pain with short-term fixes and long-term planning Take care of your workforce Get creative to drive meaningful experience Make it a social holiday Move up the promotion schedule Communicate early and often 1 2 5 4 3 6 Costco has chartered three of its own ships to move goods between Asia and North America next year Walmart provided employees who worked on Thanksgiving a free meal and offered them 15 percent off a variety of products in addition to their usual 10 percent employee discount Carter’s prioritized customer loyalty with an email saying, “With so much cyber cheer, it could take a little extra time to ship but we’re working like elves to make it as fast as possible!” and offering a discount on their next order Old Navy and other clothing retailers are creating TikTok videos, hoping they will go viral to drive sales to younger consumers Amazon started offering limited-time discounts throughout October and November In October, the CEO of children’s apparel maker Hanna Andersson emailed customers to alert them of potential inventory challenges and suggest they place orders very early Strong holiday outlook | Current as of October 2021 Examples