
Recomendados
Recomendados
Mais conteúdo relacionado
Mais procurados
Mais procurados (20)
Semelhante a Incremental Wins, Exponential Impact
Semelhante a Incremental Wins, Exponential Impact (20)
Último
Último (20)
Incremental Wins, Exponential Impact
- 1. 1031 Sterling Road, Suite 203, Herndon VA 20170 Page 1 of 10 Phone: (703) 435-5911 Fax: (703) 435-9380 © 2012, HumanR – Reproduction without permission is prohibited Incremental Wins – Exponential Impact How Employee Progress Drives Employee Engagement By Matt Evans Senior Consultant HumanR, Inc. Executive Summary In a Harvard Business Review article, “The Power of Small Wins,” Teresa Amabile and Steven Kramer (2011) highlight how important it is for workers to feel as though they are making ‘progress’ on a frequent basis, noting that progress in meaningful work is a key driver of organizational performance1 . Using Amabile’s and Kramer’s work as a foundation, HumanR sought to explore two questions: 1. What is the link between employee progress and employee engagement? 2. How should managers target their efforts to promote employee progress? In 2011, HumanR conducted a survey of sixteen professional services organizations to better understand employee engagement. In addition to asking typical engagement questions about compensation, supervision, and recognition, we asked respondents how often they make progress and how often they encounter obstacles to better understand the link between engagement and progress. Based on the data from 6,000 respondents, we found a strong link between employee perceptions of their daily progress at work and their level of engagement. The data also revealed key drivers of workplace progress as well as barriers inhibiting employees from making greater progress. Finally, the data provided clear insights on actions that managers can take to better facilitate employee progress and ultimately improve engagement and performance. 1 Teresa Amabile and Steven Kramer, “The Power of Small Wins,” Harvard Business Review May 2011: 71-80.
- 2. 1031 Sterling Road, Suite 203, Herndon VA 20170 Page 2 of 10 Phone: (703) 435-5911 Fax: (703) 435-9380 © 2012, HumanR – Reproduction without permission is prohibited Introduction The impact of employee engagement on organizations is both well documented and striking. From less unplanned leave to greater profitability2 , a highly-engaged cadre of employees delivers quantifiably better results to organizations of all types. Conversely, a disengaged workforce yields the opposite results. While compensation, buy-in to the organization’s mission, and other organization-level drivers are often the result of high-level, organization-wide actions, the individual manager is pivotal to the level of engagement of his or her employees. As a result of their research, Amabile and Kramer (2011) were able to ferret out the difference between a “good day” and a “bad day” at work. “Good days” are days in which people “feel happy, are intrinsically motivated by the work itself, and have positive perceptions of their colleagues and the organization.” “Bad days” are characterized by “frustration, fear, and sadness.” Not surprisingly, Amabile and Kramer found that people are more likely to be creative and productive on good days than bad days. Amabile and Kramer also found the single largest predictor of a good day is whether or not employees made progress in their work – that is, they took steps forward in either their own work or in their team’s work. In fact, in 76% of days in which workers report leaving work in a good mood, they report that progress was made. However, on 67% of bad days, employees reported experiencing setbacks or obstacles. The researchers further argue that “knowing what serves to catalyze and nourish progress – and what does the opposite – turns out to be the key to effectively managing people and their work.” In our research we found a strong link between employees’ perceived level of progress and their level of engagement. Additionally, we identified key drivers and barriers to employee progress. Based on our findings, we make suggestions for managers to facilitate an engaging environment by enabling and supporting employee progress. 2 “Motivating Employees to Go the Extra Mile: The Manager’s Role in Engagement,” Tom Davenport and Steven Harding, Towers Watson, 2010.
- 3. 1031 Sterling Road, Suite 203, Herndon VA 20170 Page 3 of 10 Phone: (703) 435-5911 Fax: (703) 435-9380 © 2012, HumanR – Reproduction without permission is prohibited Methodology As a part of HumanR’s ongoing engagement research, we surveyed sixteen organizations with over 6,000 respondents to further understand factors that influence employees’ engagement levels. HumanR asked employees to respond to items in several categories, including My Job, My Immediate Supervisor, Organization-Wide Leadership and Direction, Compensation and Benefits, etc. To examine the contribution ‘progress’ plays in employee engagement, the survey asked employees to respond to items on barriers to productivity, and two questions related to progress and obstacles. Those questions were: In a typical two-week period, I leave work feeling I have made progress on the following number of days (Employees could select any number from 0 through 10). In a typical two-week period, I encounter obstacles to making progress on the following number of days (Employees could select any number from 0 through 10). The HumanR Engagement Index HumanR has studied employee engagement throughout the last decade, resulting in a proprietary Employee Engagement Index. The index yields an engagement score for each survey participant and allows us to group respondents as Highly Engaged, Engaged, or Disengaged: Highly Engaged Employees demonstrate an emotional commitment to the organization. They tend to be self-starters, to take on work that is not necessarily a part of their job, and to be loyal. Engaged Employees demonstrate a rational approach to the value of their job, continuing to commit for so long as it appears to be in their best interest. Disengaged Employees are neither happy nor productive, but find it harder to leave their job than to stay; they tend to be cynical and to be harmful to morale. This survey sample resulted in the following engagement distribution, which fit within our existing normative data3 : 45 percent (n=2,758) were Highly Engaged, 39 percent (n=2,375) were Engaged, and 17 percent (n=1,022) were Disengaged. 3 HumanR’s historical normative ranges for engagement levels are: Disengaged: 6%-22%; Engaged: 32%-53%; Highly Engaged: 32%-61%
- 4. 1031 Sterling Road, Suite 203, Herndon VA 20170 Page 4 of 10 Phone: (703) 435-5911 Fax: (703) 435-9380 © 2012, HumanR – Reproduction without permission is prohibited Findings Linking Progress and Engagement As expected, the results indicate a strong relationship between engagement level and progress. The more days out of ten an individual reports making progress, the more likely he or she is to be highly engaged. Conversely, the more days out of ten an individual reports encountering obstacles, the more likely s/he is to score lower on engagement. We also combined progress and obstacles into a single measure, referred to hereafter as “Net Progress.” Net Progress is the difference between the number of days the survey respondent reports making progress and the number of days the survey respondent reports encountering obstacles. Figure 1 demonstrates the relationship between Net Progress and level of engagement. Figure 1 At the high end of Net Progress, i.e. +5 days or more, the number of employees who are highly engaged overtakes and passes the number of employees who are engaged. Managers, therefore, may wish to consider +5 Net Progress as a target. Approximately half of the survey population reports +5 Net Progress or greater, which indicates that in addition to being quantifiable and meaningful, this target is also attainable. Driving Net Progress As seen above, a relationship between Net Progress and engagement clearly exists. Delving deeper into the survey data, we found relationships between individual items and Net Progress. The five items most highly correlated to Net Progress are listed below: 1. At work my ideas and views seem to count. 2. The organization does a good job of setting customer expectations at the outset of an assignment. 3. I am able to maintain an effective balance between my personal life and my work life. 0 200 400 600 800 1000 1200 1400 1600 1800 -5 and Less (n=246) -4 to +4 (n=2909) +5 and Greater (n=2774) #ofRespondents Net Progress Range Net Progress and Engagement Level Disengaged Engaged Highly Engaged
- 5. 1031 Sterling Road, Suite 203, Herndon VA 20170 Page 5 of 10 Phone: (703) 435-5911 Fax: (703) 435-9380 © 2012, HumanR – Reproduction without permission is prohibited 4. I am satisfied with the level of teamwork provided by others in the organization outside of my immediate workgroup/department. 5. Within the scope of my job I have the appropriate level of freedom to use my own judgment and take action. To better understand the relationship between ratings of these items and progress, consider these responses from five separate survey respondents who rated them a “5” (on a scale of 1 to 5, where 5 is the highest rating). Note their verbatim responses and how they positively might affect one’s perception of progress. Table 1: Key Drivers and Representative Positive Comments Item Item Rating (1 to 5) Net Progress (-10 to 10) Verbatim Comment: What do you like best about working at your organization? Individual A At work my ideas and views seem to count. 5 6 Willingness to listen to new ideas and a culture that promotes innovation in processes 'working smarter, not harder.’ Individual B The organization does a good job of setting customer expectations at the outset of an assignment. 5 9 The work is challenging and enjoyable. My supervisor is excellent to work for and ensures I have the tools I need to succeed. My customer has placed a high priority on getting the job done, but is reasonable in their expectations. At this point, I am enjoying my job tremendously and don't expect anything to change in terms of my feelings with regard to this situation. Individual C I am able to maintain an effective balance between my personal life and my work life. 5 6 I had a work-life balance issue emerge this year that required me to adjust my schedule and responsibilities and I have been fully supported in this. I have never had a hint of worry that if I ask for more flexibility I would put my employment in jeopardy. This has motivated me to make sure I work extra hard so that the company knows that this decision to support me was a good one. Individual D I am satisfied with the level of teamwork provided by others in the organization outside of my immediate workgroup/ department. 5 6 I enjoy the collaboration between the project managers, instructional designers, artists, programmers, and QA specialists. I also like the relaxed work environment and how we pitch in when other artists are swamped with work.
- 6. 1031 Sterling Road, Suite 203, Herndon VA 20170 Page 6 of 10 Phone: (703) 435-5911 Fax: (703) 435-9380 © 2012, HumanR – Reproduction without permission is prohibited Item Item Rating (1 to 5) Net Progress (-10 to 10) Verbatim Comment: What do you like best about working at your organization? Individual E Within the scope of my job I have the appropriate level of freedom to use my own judgment and take action. 5 9 The autonomy to do my job and the support I receive to provide excellent service to our client units. I feel my supervisor's beliefs are in line with mine in regards to providing assistance beyond our sample data collection mission. For instance, I am free and encouraged to provide expertise to clients that not only makes our services more valuable but also improves the unit. Note how other individuals’ negative responses to these items might negatively affect their perception of progress. Table 2: Key Drivers and Representative Negative Comments Item Item Rating (1 to 5) Net Progress (-10 to 10) Verbatim Comment: What can be done to make the organization an even better place to work? Individual V At work my ideas and views seem to count. 2 -4 Address concerns and desires that are identified by the employee . . . overall, this organization has become the single most dissatisfying, disheartening, and demotivating workplace that I have ever experienced. Individual W The organization does a good job of setting customer expectations at the outset of an assignment. 2 -2 In my experience the management of my organization promises many things to the client and then does not provide the resources or managerial support to get them done, which means that we are always behind schedule and under budget and cutting corners. This leads to a high stress work environment. Individual X I am able to maintain an effective balance between my personal life and my work life. 2 -6 People do not take ownership of their responsibilities, thus making others take on more than they should. Some people get to go home on time, the rest struggle to keep the boat afloat for the good of all. Management's role in trying to get everything done well at once results in nothing done well.
- 7. 1031 Sterling Road, Suite 203, Herndon VA 20170 Page 7 of 10 Phone: (703) 435-5911 Fax: (703) 435-9380 © 2012, HumanR – Reproduction without permission is prohibited Item Item Rating (1 to 5) Net Progress (-10 to 10) Verbatim Comment: What can be done to make the organization an even better place to work? Individual Y I am satisfied with the level of teamwork provided by others in the organization outside of my immediate workgroup/ department. 1 -9 This year . . . has brought disrespect to our business unit as well as outright inflammatory language and frustration/defensiveness on collective conference calls etc. Corporate finance office has lack of knowledge of their accounting software and doesn't take advice from my 8 years of experience. Customer requests are being ignored, showing lack of responsiveness as well as outright disrespect for deadlines. Individual Z Within the scope of my job I have the appropriate level of freedom to use my own judgment and take action. 1 -8 The bureaucracy is a constant obstacle to meeting customer needs - the workers are made to support the bureaucrats rather than the other way around. Among other things, this results in us having a ridiculously high overhead multiplier, which makes us cost-uncompetitive. Barriers to Making Progress We noted earlier the importance of +5 days of Net Progress, the point at which high engagement becomes most prevalent. We asked respondents to select five barriers from a list of 25 that have the largest impact on their productivity. We then compared the results of individuals with less than 5 days of Net Progress with individuals with greater than 5 days of Net Progress. The following table shows those barriers that present the largest gap between each set of individuals. Table 3: Key Barriers Preventing +5 Net Progress Percentage of Respondents Mentioning Barrier as an Issue Net Progress = +5 Days or More (n=2778) Net Progress = Less Than +5 Days (n=3161) Gap Responding to crises 9.5% 20.2% 10.7% Lack of clear priorities/goals 5.9% 16.5% 10.6% Miscommunication among work groups/departments 9.2% 18.1% 8.9% Continual need to seek decisions or approval from higher authority 6.3% 15.0% 8.7% Lack of information 11.7% 20.3% 8.6%
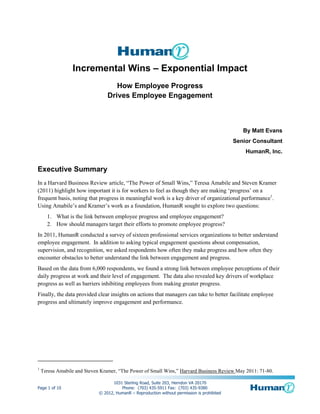
- 8. 1031 Sterling Road, Suite 203, Herndon VA 20170 Page 8 of 10 Phone: (703) 435-5911 Fax: (703) 435-9380 © 2012, HumanR – Reproduction without permission is prohibited Consider the impact that these barriers impose on employees as they attempt to make progress in their work and the high frequency in which they occur for individuals in our survey who make less than +5 days of Net Progress. To move employees into a Net Progress range where they are most likely to be highly engaged, managers can focus on these barriers which impede desired levels of progress. The Disengaged As stated previously, disengaged employees are difficult to motivate and can be harmful to morale. An additional item of interest from the data shows the effect of increased perception of progress on the disengaged population. Our findings show that regardless of their level of progress, the disengaged population remains disengaged. Figure 2 As seen in the previous chart, no clear link exists between progress and disengagement. We actually see more disengaged employees at +9 days of Net Progress than at -9 days of Net Progress. Disengaged employees report dissatisfaction across a variety of factors, where our research has shown that this is often due to poor person/job fit. Because progress likely has little effect on disengaged employees, managers should instead focus on facilitating the progress of individuals who are already engaged. 0 50 100 150 200 250 -10 -9 -8 -7 -6 -5 -4 -3 -2 -1 0 1 2 3 4 5 6 7 8 9 10 NumberofEmployees Net Progress Disengaged Population
- 9. 1031 Sterling Road, Suite 203, Herndon VA 20170 Page 9 of 10 Phone: (703) 435-5911 Fax: (703) 435-9380 © 2012, HumanR – Reproduction without permission is prohibited Implications for Managers Amabile and Kramer state that a positive inner work life drives performance, that performance is dependent on making progress in meaningful work, which in turn, yields a positive inner work life. They refer to this as the progress loop. According to Amabile and Kramer, one of the goals of managers in creating a high performance work environment is to facilitate the progress loop. Implications From Our Research Our findings lead to some practical implications for managers to help them facilitate progress. Ask employees about progress and obstacles. But, as Amabile and Kramer note, check “in” on them, do not check “up” on them. Be seen as a facilitator of success, not a micromanager. Manage customer expectations. As noted in the findings, setting customer expectations correlates with Net Progress. A poorly written set of requirements, an underwhelming service level agreement, or an inability to hold customers to what was agreed to at the outset of a project can result in rework, overwork, and a seemingly infinite cycle of frustration. Make work meaningful and rewarding to the employee. Work to match employee career and role expectations to work they are performing. Most people accept job offers based on their expectations of what the job will entail. When people find themselves in roles other than they expect, they may find the work less meaningful than the work they originally intended to pursue. This disconnect between expectations and roles can lead employees toward the perception that they are not making meaningful progress. Maximize autonomy whenever possible. Ensure employees feel they can make decisions that allow them to move forward without a burdensome approval process. Amabile and Kramer note that their model manager “checks in with,” and does not “check up on” his or her team. Our survey findings reveal, in both barriers and item ratings, the importance of empowerment as it relates to progress. From an employee perceiving that he or she must waste time while awaiting approval to an employee feeling demotivated by a perceived lack of responsibility, a lack of employee empowerment can stall progress. Promote teamwork among departments. Particularly in large, complex projects, teamwork among departments is crucial for moving forward effectively. Missed deadlines, overburdened team members, and a perception of inequitable workload are consequences of poor teamwork. Managers should advocate for their team and work with other departments’ management to ensure accountability and an equitable distribution of workload. Focus on what has been achieved. Managers who are “engaging” focus on positive outcomes rather than negatives. Focus on what has been done more than what has not been done to create an atmosphere conducive to rewarding progress. Set short term goals that are achievable. Think in terms of ten day increments. Long-term projects can seem interminable, and progress can seem nonexistent. Ensure employees can identify when they have made progress by setting frequent, reachable targets. Ensure adequate resources to achieve goals. It is the manager’s responsibility to ensure that time, money, equipment, and social and political capital are appropriately managed in a way that facilitates progress.
- 10. 1031 Sterling Road, Suite 203, Herndon VA 20170 Page 10 of 10 Phone: (703) 435-5911 Fax: (703) 435-9380 © 2012, HumanR – Reproduction without permission is prohibited Remember that some people will remain unsatisfied, regardless of progress. The disengaged will generally remain disengaged, regardless of a manager’s efforts to facilitate progress. Instead of spending resources to facilitate their progress, concentrate on helping those individuals who are already engaged become more highly engaged. Conclusion HumanR’s research establishes a strong link between progress and engagement. To improve employee engagement, managers should focus on creating an environment where each employee has the opportunity to make progress in the work s/he finds meaningful. The goal is to build a progress-oriented environment which results in higher levels of engagement, and ultimately, higher levels of performance. ------------------------- About HumanR Founded in 1975, HumanR is a management consulting firm with a focus on organizational development. Our goal is to help organizational leaders connect their people to their business results – to connect the dots between data and people, and between people and organizational performance. Since 1996 we have had a presence on the web, performing employee engagement surveys and providing customized 360s for leadership development. Over this period we have enhanced our services by developing a variety of unique value adds, including our proprietary engagement index, our normative databases, and our extensive selection of leadership and management trainings. In 2009 HumanR was named the Woman Owned Small Business of the Year by the USDA’s Food and Nutrition Service for our work in conducting 360 feedback and coaching. If you have any questions, please contact one of the following individuals: Burgess Levin Mary Saily Matt Evans Senior Executive Consultant Executive Consultatnt & CEO Senior Consultant blevin@humanr.com msaily@humanr.com mevans@humanr.com (703) 435-5911 x102 (703) 435-5911 x104 (703) 435-5911 x114