SlideShare uma empresa Scribd logo
1 de 4
Baixar para ler offline
E
Abstract Reasoning Test
x = 65 µ = 73 σ = 8.6
𝑧 =
𝑥−𝜇
𝜎
=
65−73
8.6
=
−8
8.6
z = −0.93 (rounded off to two decimal places)
Aptitude Test
x = 56.5 µ = 54.5 σ = 5.1
𝑧 =
𝑥−𝜇
𝜎
=
56.5−54.5
5.1
=
2
5.1
z = 0.39 (rounded off to two decimal places)
ANSWER. The z-score indicates the deviation of the score from the mean in each
distribution.
Highest: Aptitude Test (it has the highest z-score)
Lowest: Abstract Reasoning (it has the lowest z-score)
Computing Probabilities and Percentile Using Standard Normal Table
Standard Normal Table (Z-score Table)
Directions: Draw a normal curve. Shade the area that is being asked in each item under
the standard normal curve.
1. To the left of z=0.5 2. To the left of z=1.43
7
4. The two tails extend indefinitely in both directions coming closer and closer to the
horizontal axis but never quite touching it.
5. The curve is symmetrical about the vertical line x = µ.
6. The mean, median, and mode coincide at the exact center of the distribution.
7. The total area under the curve is 1.00, and since the curve is symmetrical about x = µ, it
follows that the area on either side of the vertical line x = µ is 0.5. This area represents the
total number of cases (N).
The Normal Curve
Reading Activity. Facts about Normal Distribution/Curve
In the above normal curve point P is the maximum where the mean, median and
mode are located. The left side is symmetrical to the right side about the mean (x = µ).
Points A and B are inflection points, the point where the curve changes directions from
downward to upward. The horizontal Distance from A (or B) to the line x = µ is one unit
of standard deviation σ.
Normal curves can describe a large number of groups of data differentiated only
by their mean and their tendency to spread.
Any normal distribution is defined by two measures: the mean which locates the
center and the standard deviation which measures the spread around the center.
The standard deviation permits us to determine quite accurately where the
values in a distribution are located relative to their mean. With the use of the standard
deviation, we can measure with great precision percentage of items that fall within
specific ranges under a normal distribution.
2
Activity 4. Lhenylene’s final examination results in the three subjects are as
follows:
Subject Grade Mean S.D.
Business Math 86 81 5.75
College Algebra 76 73 6
Business Statistics 91 93 6.5
On which test did Lhenylene perform well? worst?
Week # 3 Inclusive Dates: ____________ Quarter: Quarter 3 Score: _______
Competencies:
1. Illustrate a normal random variable and its characteristics (M11/12SP-IIIc-1);
2. Identify regions under the normal curve that correspond to different standard
normal values (M11/12SP-IIIc-3);
3. Convert a normal random variable to a standard normal variable and vice versa
(M11/12SP-IIIc-4); and
4. Compute probabilities and percentiles using standard normal distribution
(M11/12SP-IIIc-d-1);
NORMAL DISTRIBUTION CONCEPTS
A normal distribution is an arrangement of a data set in which most values cluster in the
middle of the range and the rest taper off symmetrically toward either extreme.
Characteristics of Normal Probability Distribution:
1.The curve has a single peak.
2.It is bell-shaped or shape like Mexican hat.
3.The mean lies at the center of the distribution. The distribution is symmetrical about the
mean.
3. To the right of z= - 2.54 4. In between z=0.9 and z= 2.0
 To calculate the area under the normal curve, we use the standard normal or z-score
table.
 In a z-score table, the left most column tells you how many standard deviations above
the mean to 1 decimal place, the top row gives the second decimal place, and the
intersection of a row and column gives the probability.
 For the case of negative z-score, the same manner as with the computation of
probabilities of positive z-score since the curve is symmetrical along the mean.
Activity 5
A. Directions: Find the area under the standard normal curve which lies to the following
conditions. Refer to the z-table and to your concept notes for you to be guided.{Hint: To
the right means P(x>a), to the left means P(x<a), and between means P(a<x<b)}.
1. to the right of z=0.66
2. to the left of z=-1.53
3. to the right of z=-2.34
4. to the right of z=1.30
5. between z=-0.78 and z=0.56
B. Directions: Solve the following problem that involves area under normal curve.
You are a farmer about to harvest the crop. To describe the uncertainty in the size of
the harvest, you feel that it may be described as normal distribution with a mean value of
80,000 bushels with a standard deviation of 2,500 bushels. Find the probability that your
harvest will exceed 84,400 bushels.
1
8
Division of Nueva Ecija
NEHS – Senior High School
Quezon District, Cabanatuan City
STATISTICS AND PROBABILITY
Creative & Critical Thinking Activities
Name: ____________________________________________
Grade & Section: ___________________________________
Parent / Guardian Name & Signature: __________________
Teacher: __________________________________________
1. z =− 1.5
Solution:
𝑥 = 𝑧𝑠 + 𝑥 = −1.5 8.5 + 75 = −12.75 + 75
𝒙 = −𝟔𝟐. 𝟐𝟓
2. z = 2.30
Solution:
𝑥 = 𝑧𝑠 + 𝑥 = 2.30 8.5 + 75 = 19.55 + 75
𝒙 = 𝟗𝟒. 𝟓𝟓
Application
Apply the concept of converting normal random variable to standard normal variable to
solve verbal problems.
1. Shown below are Mr. Rivera’s scores, the mean, and the standard deviation of each
three tests given to 500 applicants.
Test Mr. Rivera’s Score Mean S.D.
Personality 72.2 68.2 10.5
Abstract Reasoning 65 73 8.6
Aptitude 56.5 54.5 5.1
On which test did Mr. Rivera stand highest? lowest?
Solution:
To determine the answer, convert the scores of each test in standard score.
Personality Test
x = 72.2 µ = 68.2 σ = 10.5
𝑧 =
𝑥−𝜇
𝜎
=
72.2−68.2
10.5
=
4
10.5
z = 0.38 (rounded off to two decimal places)
Three Mathematical Facts about Normal Distribution:
1. About 68% of the values in the population fall within ±1 std. deviation from the mean
(actual value 68.27%)
2. About 95% of the values in the population within ±2 std. deviation from the mean
(actual value 95.45%)
3. About 99% of the values are in an interval ranging from 3 std. deviation below the
mean to 3 std. deviation above the mean (actual value 99.74%).
Activity 1. Directions: True or False. Write T if the statement is correct and F if
otherwise. Write you answer on the space provided.
______1. Heights and weights of people, blood pressure, test score and error in
measurements are examples of things that follow normal distribution.
______2. The curve in normal distribution is divided into two by the line x = µ.
______3. The horizontal distance of both inflection points to the line x = µ is 2 units of
standard deviation.
______4. The three important measures in normal distributions are mean, median and
mode.
______5. If you have 500 observations and it represents a normal distribution, there are
340 values in the population fall within ±2 std. deviation.
Activity 2. Directions: Choose the correct word inside the parenthesis to make the
statement correct. Underline the correct answer.
1. The normal distribution is centred at its (mean, median, standard deviation).
2. The total area under the normal curve is (1, 2, 3).
3. For a normal random variable, the probability of observing a value less than or equal
to its mean is (0, 0.5, 1).
4. The mean, median and mode in normal distribution are (equal, unequal).
5. The one that measures the location in the normal curve is (mean, variance, standard
deviation).
6 3
Activity 2. Using the derived formula, convert the following standard score (z-score) to real
score:
Given: x = 52 s = 7
1. z = 1.5 x = ____________
2. z = −2 x = ___________
3. z = −0.25 x = ___________
2. x = 50
Solution:
𝑧 =
𝑥−𝜇
𝜎
=
50−60
4
=
−10
4
𝒛 = −𝟐. 𝟓
3. x = 60
Solution:
𝑧 =
𝑥−𝜇
𝜎
=
60−60
4
=
0
4
𝒛 = 𝟎
Note that in converting normal random variable x, you have to substitute the
values given and the random variable x in the formulas: 𝒛 =
𝒙−𝝁
𝝈
or 𝒛 =
𝒙−𝒙
̅
𝒔
Converting standard normal random variable to normal random variable
Note: For convenient way of converting standard normal random variable to normal
random variable, derive the formula to solve for normal random variable x.
𝑧 =
𝑥−𝜇
𝜎
𝑧 =
𝑥−𝑥
𝑠
𝑧𝜎 = 𝑥 − 𝜇 𝑧𝑠 = 𝑥 − 𝑥
𝑧𝜎 + 𝜇 = 𝑥 𝑧𝑠 + 𝑥 = 𝑥
𝒙 = 𝒛𝝈 + 𝝁 𝒙 = 𝒛𝒔 + 𝒙
̅
Determine the real score of the following z-score.
Given: x = 75 s = 8.5
3. z = 0.35
Solution:
𝑥 = 𝑧𝑠 + 𝑥 = 0.35 8.5 + 75 = 2.975 + 75
𝒙 = 𝟕𝟕. 𝟗𝟖 (rounded off to two decimal places)
The Standard Normal Distribution
Standard normal distribution is a special case of the normal distribution. It is the
distribution that occurs when a normal random variable has a mean of zero and a standard
deviation of one.
The normal random variable of a standard normal distribution is called standard score
or z-score. Every normal random variable X can be transformed into a z-score via the following
equation:
Population: 𝒛 =
𝒙−𝝁
𝝈
Sample: 𝒛 =
𝒙−𝒙
̅
𝒔
Z-score of a normal random variable (raw score x) measures the number of standard
deviations between a raw score x and the mean of the distribution where the raw score x
came from.
Normal Curve Standardized Normal Curve
Converting normal random variable to standard normal variable
Study the following examples. Pay careful attention to the results and how the normal
random variable was converted to standard normal variable.
Covert the following real score into standard score.
Given: µ = 60 σ = 4
1. x = 68
Solution:
𝑧 =
𝑥−𝜇
𝜎
=
68−60
4
=
8
4
𝒛 = 𝟐
4 5
Activity 3. Compute for the corresponding z-score for each of the normal
random variable. (Round off your answer into two decimal places)
Given: µ = 75 σ = 5.1
1. x = 80 z = _______________
2. x = 63 z = _______________
x = 82 z = _______________

Mais conteúdo relacionado

Mais procurados

CABT SHS Statistics & Probability - The z-scores and Problems involving Norma...
CABT SHS Statistics & Probability - The z-scores and Problems involving Norma...CABT SHS Statistics & Probability - The z-scores and Problems involving Norma...
CABT SHS Statistics & Probability - The z-scores and Problems involving Norma...Gilbert Joseph Abueg
 
Chapter 2 understanding the normal curve distribution
Chapter 2   understanding the normal curve distributionChapter 2   understanding the normal curve distribution
Chapter 2 understanding the normal curve distributionAntonio F. Balatar Jr.
 
STATISTICS: Normal Distribution
STATISTICS: Normal Distribution STATISTICS: Normal Distribution
STATISTICS: Normal Distribution jundumaug1
 
The standard normal curve & its application in biomedical sciences
The standard normal curve & its application in biomedical sciencesThe standard normal curve & its application in biomedical sciences
The standard normal curve & its application in biomedical sciencesAbhi Manu
 
8. normal distribution qt pgdm 1st semester
8. normal distribution qt pgdm 1st  semester8. normal distribution qt pgdm 1st  semester
8. normal distribution qt pgdm 1st semesterKaran Kukreja
 
Normal Probabilty Distribution and its Problems
Normal Probabilty Distribution and its ProblemsNormal Probabilty Distribution and its Problems
Normal Probabilty Distribution and its ProblemsAli Raza
 
the normal curve
the normal curvethe normal curve
the normal curveSajan Ks
 
The Normal Distribution Curve
The Normal Distribution CurveThe Normal Distribution Curve
The Normal Distribution CurvePaul John Argarin
 
Statistik 1 6 distribusi probabilitas normal
Statistik 1 6 distribusi probabilitas normalStatistik 1 6 distribusi probabilitas normal
Statistik 1 6 distribusi probabilitas normalSelvin Hadi
 
Normal distribution
Normal distributionNormal distribution
Normal distributionCamilleJoy3
 
Normal probability distribution
Normal probability distributionNormal probability distribution
Normal probability distributionNadeem Uddin
 
Some study materials
Some study materialsSome study materials
Some study materialsSatishH5
 
Normal distribution
Normal distributionNormal distribution
Normal distributionGlobal Polis
 
Lecture 01 probability distributions
Lecture 01 probability distributionsLecture 01 probability distributions
Lecture 01 probability distributionsmohamed ali
 

Mais procurados (20)

CABT SHS Statistics & Probability - The z-scores and Problems involving Norma...
CABT SHS Statistics & Probability - The z-scores and Problems involving Norma...CABT SHS Statistics & Probability - The z-scores and Problems involving Norma...
CABT SHS Statistics & Probability - The z-scores and Problems involving Norma...
 
Chapter 2 understanding the normal curve distribution
Chapter 2   understanding the normal curve distributionChapter 2   understanding the normal curve distribution
Chapter 2 understanding the normal curve distribution
 
Normal distribution
Normal distributionNormal distribution
Normal distribution
 
STATISTICS: Normal Distribution
STATISTICS: Normal Distribution STATISTICS: Normal Distribution
STATISTICS: Normal Distribution
 
The standard normal curve & its application in biomedical sciences
The standard normal curve & its application in biomedical sciencesThe standard normal curve & its application in biomedical sciences
The standard normal curve & its application in biomedical sciences
 
8. normal distribution qt pgdm 1st semester
8. normal distribution qt pgdm 1st  semester8. normal distribution qt pgdm 1st  semester
8. normal distribution qt pgdm 1st semester
 
Normal Curve
Normal CurveNormal Curve
Normal Curve
 
Normal Probabilty Distribution and its Problems
Normal Probabilty Distribution and its ProblemsNormal Probabilty Distribution and its Problems
Normal Probabilty Distribution and its Problems
 
the normal curve
the normal curvethe normal curve
the normal curve
 
The Normal Distribution Curve
The Normal Distribution CurveThe Normal Distribution Curve
The Normal Distribution Curve
 
Statistik 1 6 distribusi probabilitas normal
Statistik 1 6 distribusi probabilitas normalStatistik 1 6 distribusi probabilitas normal
Statistik 1 6 distribusi probabilitas normal
 
Normal distribution
Normal distributionNormal distribution
Normal distribution
 
Basic stat review
Basic stat reviewBasic stat review
Basic stat review
 
Central Tendency
Central TendencyCentral Tendency
Central Tendency
 
Probability Distribution
Probability DistributionProbability Distribution
Probability Distribution
 
Normal probability distribution
Normal probability distributionNormal probability distribution
Normal probability distribution
 
Some study materials
Some study materialsSome study materials
Some study materials
 
Normal distribution
Normal distributionNormal distribution
Normal distribution
 
Lecture 01 probability distributions
Lecture 01 probability distributionsLecture 01 probability distributions
Lecture 01 probability distributions
 
Z scores
Z scoresZ scores
Z scores
 

Semelhante a LAS-3.pdf

St201 d normal distributions
St201 d normal distributionsSt201 d normal distributions
St201 d normal distributionsSharayah Becker
 
Real Applications of Normal Distributions
Real Applications of Normal Distributions  Real Applications of Normal Distributions
Real Applications of Normal Distributions Long Beach City College
 
Normal Probability Distribution
Normal Probability DistributionNormal Probability Distribution
Normal Probability Distributionmandalina landy
 
04.NORMAL DISTRIBUTION stat and probab.pptx
04.NORMAL DISTRIBUTION stat and probab.pptx04.NORMAL DISTRIBUTION stat and probab.pptx
04.NORMAL DISTRIBUTION stat and probab.pptxninosulit
 
Estimating a Population Standard Deviation or Variance
Estimating a Population Standard Deviation or VarianceEstimating a Population Standard Deviation or Variance
Estimating a Population Standard Deviation or VarianceLong Beach City College
 
Estimating a Population Standard Deviation or Variance
Estimating a Population Standard Deviation or Variance Estimating a Population Standard Deviation or Variance
Estimating a Population Standard Deviation or Variance Long Beach City College
 
02 PSBE3_PPT.Ch01_2_Examining Distribution.ppt
02 PSBE3_PPT.Ch01_2_Examining Distribution.ppt02 PSBE3_PPT.Ch01_2_Examining Distribution.ppt
02 PSBE3_PPT.Ch01_2_Examining Distribution.pptBishoyRomani
 
Mean, median, and mode ug
Mean, median, and mode ugMean, median, and mode ug
Mean, median, and mode ugAbhishekDas15
 
Gerstman_PP07.ppt
Gerstman_PP07.pptGerstman_PP07.ppt
Gerstman_PP07.pptkarthiksmp
 
biostatistics normal.ppt
biostatistics normal.pptbiostatistics normal.ppt
biostatistics normal.pptswetachaudhari7
 
Lecture 4 The Normal Distribution.pptx
Lecture 4 The Normal Distribution.pptxLecture 4 The Normal Distribution.pptx
Lecture 4 The Normal Distribution.pptxshakirRahman10
 
Gerstman_PP07.ppt
Gerstman_PP07.pptGerstman_PP07.ppt
Gerstman_PP07.pptTemporary57
 
The-Normal-Distribution, Statics and Pro
The-Normal-Distribution, Statics and ProThe-Normal-Distribution, Statics and Pro
The-Normal-Distribution, Statics and ProGiancarloMercado2
 
Gerstman_PP07.ppt
Gerstman_PP07.pptGerstman_PP07.ppt
Gerstman_PP07.pptINDRAJJEPH
 

Semelhante a LAS-3.pdf (20)

The Standard Normal Distribution
The Standard Normal DistributionThe Standard Normal Distribution
The Standard Normal Distribution
 
St201 d normal distributions
St201 d normal distributionsSt201 d normal distributions
St201 d normal distributions
 
Real Applications of Normal Distributions
Real Applications of Normal Distributions  Real Applications of Normal Distributions
Real Applications of Normal Distributions
 
Normal Probability Distribution
Normal Probability DistributionNormal Probability Distribution
Normal Probability Distribution
 
04.NORMAL DISTRIBUTION stat and probab.pptx
04.NORMAL DISTRIBUTION stat and probab.pptx04.NORMAL DISTRIBUTION stat and probab.pptx
04.NORMAL DISTRIBUTION stat and probab.pptx
 
Ch05
Ch05Ch05
Ch05
 
Normal Distribution.pptx
Normal Distribution.pptxNormal Distribution.pptx
Normal Distribution.pptx
 
Estimating a Population Standard Deviation or Variance
Estimating a Population Standard Deviation or VarianceEstimating a Population Standard Deviation or Variance
Estimating a Population Standard Deviation or Variance
 
Estimating a Population Standard Deviation or Variance
Estimating a Population Standard Deviation or Variance Estimating a Population Standard Deviation or Variance
Estimating a Population Standard Deviation or Variance
 
Normal Distribution.ppt
Normal Distribution.pptNormal Distribution.ppt
Normal Distribution.ppt
 
02 PSBE3_PPT.Ch01_2_Examining Distribution.ppt
02 PSBE3_PPT.Ch01_2_Examining Distribution.ppt02 PSBE3_PPT.Ch01_2_Examining Distribution.ppt
02 PSBE3_PPT.Ch01_2_Examining Distribution.ppt
 
Mean, median, and mode ug
Mean, median, and mode ugMean, median, and mode ug
Mean, median, and mode ug
 
Gerstman_PP07.ppt
Gerstman_PP07.pptGerstman_PP07.ppt
Gerstman_PP07.ppt
 
biostatistics normal.ppt
biostatistics normal.pptbiostatistics normal.ppt
biostatistics normal.ppt
 
Lecture 4 The Normal Distribution.pptx
Lecture 4 The Normal Distribution.pptxLecture 4 The Normal Distribution.pptx
Lecture 4 The Normal Distribution.pptx
 
Gerstman_PP07.ppt
Gerstman_PP07.pptGerstman_PP07.ppt
Gerstman_PP07.ppt
 
wk-2.pptx
wk-2.pptxwk-2.pptx
wk-2.pptx
 
The-Normal-Distribution, Statics and Pro
The-Normal-Distribution, Statics and ProThe-Normal-Distribution, Statics and Pro
The-Normal-Distribution, Statics and Pro
 
Gerstman_PP07.ppt
Gerstman_PP07.pptGerstman_PP07.ppt
Gerstman_PP07.ppt
 
Normal Distribution
Normal DistributionNormal Distribution
Normal Distribution
 

Último

HiFi Call Girl Service Delhi Phone ☞ 9899900591 ☜ Escorts Service at along wi...
HiFi Call Girl Service Delhi Phone ☞ 9899900591 ☜ Escorts Service at along wi...HiFi Call Girl Service Delhi Phone ☞ 9899900591 ☜ Escorts Service at along wi...
HiFi Call Girl Service Delhi Phone ☞ 9899900591 ☜ Escorts Service at along wi...poojakaurpk09
 
Jigani Call Girls Service: 🍓 7737669865 🍓 High Profile Model Escorts | Bangal...
Jigani Call Girls Service: 🍓 7737669865 🍓 High Profile Model Escorts | Bangal...Jigani Call Girls Service: 🍓 7737669865 🍓 High Profile Model Escorts | Bangal...
Jigani Call Girls Service: 🍓 7737669865 🍓 High Profile Model Escorts | Bangal...amitlee9823
 
call girls in Kaushambi (Ghaziabad) 🔝 >༒8448380779 🔝 genuine Escort Service 🔝...
call girls in Kaushambi (Ghaziabad) 🔝 >༒8448380779 🔝 genuine Escort Service 🔝...call girls in Kaushambi (Ghaziabad) 🔝 >༒8448380779 🔝 genuine Escort Service 🔝...
call girls in Kaushambi (Ghaziabad) 🔝 >༒8448380779 🔝 genuine Escort Service 🔝...Delhi Call girls
 
How to Build a Simple Shopify Website
How to Build a Simple Shopify WebsiteHow to Build a Simple Shopify Website
How to Build a Simple Shopify Websitemark11275
 
Booking open Available Pune Call Girls Nanded City 6297143586 Call Hot India...
Booking open Available Pune Call Girls Nanded City  6297143586 Call Hot India...Booking open Available Pune Call Girls Nanded City  6297143586 Call Hot India...
Booking open Available Pune Call Girls Nanded City 6297143586 Call Hot India...Call Girls in Nagpur High Profile
 
Sector 105, Noida Call girls :8448380779 Model Escorts | 100% verified
Sector 105, Noida Call girls :8448380779 Model Escorts | 100% verifiedSector 105, Noida Call girls :8448380779 Model Escorts | 100% verified
Sector 105, Noida Call girls :8448380779 Model Escorts | 100% verifiedDelhi Call girls
 
❤Personal Whatsapp Number 8617697112 Samba Call Girls 💦✅.
❤Personal Whatsapp Number 8617697112 Samba Call Girls 💦✅.❤Personal Whatsapp Number 8617697112 Samba Call Girls 💦✅.
❤Personal Whatsapp Number 8617697112 Samba Call Girls 💦✅.Nitya salvi
 
Verified Trusted Call Girls Adugodi💘 9352852248 Good Looking standard Profil...
Verified Trusted Call Girls Adugodi💘 9352852248  Good Looking standard Profil...Verified Trusted Call Girls Adugodi💘 9352852248  Good Looking standard Profil...
Verified Trusted Call Girls Adugodi💘 9352852248 Good Looking standard Profil...kumaririma588
 
call girls in Vaishali (Ghaziabad) 🔝 >༒8448380779 🔝 genuine Escort Service 🔝✔️✔️
call girls in Vaishali (Ghaziabad) 🔝 >༒8448380779 🔝 genuine Escort Service 🔝✔️✔️call girls in Vaishali (Ghaziabad) 🔝 >༒8448380779 🔝 genuine Escort Service 🔝✔️✔️
call girls in Vaishali (Ghaziabad) 🔝 >༒8448380779 🔝 genuine Escort Service 🔝✔️✔️Delhi Call girls
 
Editorial design Magazine design project.pdf
Editorial design Magazine design project.pdfEditorial design Magazine design project.pdf
Editorial design Magazine design project.pdftbatkhuu1
 
💫✅jodhpur 24×7 BEST GENUINE PERSON LOW PRICE CALL GIRL SERVICE FULL SATISFACT...
💫✅jodhpur 24×7 BEST GENUINE PERSON LOW PRICE CALL GIRL SERVICE FULL SATISFACT...💫✅jodhpur 24×7 BEST GENUINE PERSON LOW PRICE CALL GIRL SERVICE FULL SATISFACT...
💫✅jodhpur 24×7 BEST GENUINE PERSON LOW PRICE CALL GIRL SERVICE FULL SATISFACT...sonalitrivedi431
 
RT Nagar Call Girls Service: 🍓 7737669865 🍓 High Profile Model Escorts | Bang...
RT Nagar Call Girls Service: 🍓 7737669865 🍓 High Profile Model Escorts | Bang...RT Nagar Call Girls Service: 🍓 7737669865 🍓 High Profile Model Escorts | Bang...
RT Nagar Call Girls Service: 🍓 7737669865 🍓 High Profile Model Escorts | Bang...amitlee9823
 
Booking open Available Pune Call Girls Kirkatwadi 6297143586 Call Hot Indian...
Booking open Available Pune Call Girls Kirkatwadi  6297143586 Call Hot Indian...Booking open Available Pune Call Girls Kirkatwadi  6297143586 Call Hot Indian...
Booking open Available Pune Call Girls Kirkatwadi 6297143586 Call Hot Indian...Call Girls in Nagpur High Profile
 
Peaches App development presentation deck
Peaches App development presentation deckPeaches App development presentation deck
Peaches App development presentation decktbatkhuu1
 
Sector 104, Noida Call girls :8448380779 Model Escorts | 100% verified
Sector 104, Noida Call girls :8448380779 Model Escorts | 100% verifiedSector 104, Noida Call girls :8448380779 Model Escorts | 100% verified
Sector 104, Noida Call girls :8448380779 Model Escorts | 100% verifiedDelhi Call girls
 
Call Girls Basavanagudi Just Call 👗 7737669865 👗 Top Class Call Girl Service ...
Call Girls Basavanagudi Just Call 👗 7737669865 👗 Top Class Call Girl Service ...Call Girls Basavanagudi Just Call 👗 7737669865 👗 Top Class Call Girl Service ...
Call Girls Basavanagudi Just Call 👗 7737669865 👗 Top Class Call Girl Service ...amitlee9823
 
Q4-W4-SCIENCE-5 power point presentation
Q4-W4-SCIENCE-5 power point presentationQ4-W4-SCIENCE-5 power point presentation
Q4-W4-SCIENCE-5 power point presentationZenSeloveres
 
Real service provider college girl Mira Road 8976425520
Real service provider college girl Mira Road 8976425520Real service provider college girl Mira Road 8976425520
Real service provider college girl Mira Road 8976425520modelanjalisharma4
 
Whitefield Call Girls Service: 🍓 7737669865 🍓 High Profile Model Escorts | Ba...
Whitefield Call Girls Service: 🍓 7737669865 🍓 High Profile Model Escorts | Ba...Whitefield Call Girls Service: 🍓 7737669865 🍓 High Profile Model Escorts | Ba...
Whitefield Call Girls Service: 🍓 7737669865 🍓 High Profile Model Escorts | Ba...amitlee9823
 
UI:UX Design and Empowerment Strategies for Underprivileged Transgender Indiv...
UI:UX Design and Empowerment Strategies for Underprivileged Transgender Indiv...UI:UX Design and Empowerment Strategies for Underprivileged Transgender Indiv...
UI:UX Design and Empowerment Strategies for Underprivileged Transgender Indiv...RitikaRoy32
 

Último (20)

HiFi Call Girl Service Delhi Phone ☞ 9899900591 ☜ Escorts Service at along wi...
HiFi Call Girl Service Delhi Phone ☞ 9899900591 ☜ Escorts Service at along wi...HiFi Call Girl Service Delhi Phone ☞ 9899900591 ☜ Escorts Service at along wi...
HiFi Call Girl Service Delhi Phone ☞ 9899900591 ☜ Escorts Service at along wi...
 
Jigani Call Girls Service: 🍓 7737669865 🍓 High Profile Model Escorts | Bangal...
Jigani Call Girls Service: 🍓 7737669865 🍓 High Profile Model Escorts | Bangal...Jigani Call Girls Service: 🍓 7737669865 🍓 High Profile Model Escorts | Bangal...
Jigani Call Girls Service: 🍓 7737669865 🍓 High Profile Model Escorts | Bangal...
 
call girls in Kaushambi (Ghaziabad) 🔝 >༒8448380779 🔝 genuine Escort Service 🔝...
call girls in Kaushambi (Ghaziabad) 🔝 >༒8448380779 🔝 genuine Escort Service 🔝...call girls in Kaushambi (Ghaziabad) 🔝 >༒8448380779 🔝 genuine Escort Service 🔝...
call girls in Kaushambi (Ghaziabad) 🔝 >༒8448380779 🔝 genuine Escort Service 🔝...
 
How to Build a Simple Shopify Website
How to Build a Simple Shopify WebsiteHow to Build a Simple Shopify Website
How to Build a Simple Shopify Website
 
Booking open Available Pune Call Girls Nanded City 6297143586 Call Hot India...
Booking open Available Pune Call Girls Nanded City  6297143586 Call Hot India...Booking open Available Pune Call Girls Nanded City  6297143586 Call Hot India...
Booking open Available Pune Call Girls Nanded City 6297143586 Call Hot India...
 
Sector 105, Noida Call girls :8448380779 Model Escorts | 100% verified
Sector 105, Noida Call girls :8448380779 Model Escorts | 100% verifiedSector 105, Noida Call girls :8448380779 Model Escorts | 100% verified
Sector 105, Noida Call girls :8448380779 Model Escorts | 100% verified
 
❤Personal Whatsapp Number 8617697112 Samba Call Girls 💦✅.
❤Personal Whatsapp Number 8617697112 Samba Call Girls 💦✅.❤Personal Whatsapp Number 8617697112 Samba Call Girls 💦✅.
❤Personal Whatsapp Number 8617697112 Samba Call Girls 💦✅.
 
Verified Trusted Call Girls Adugodi💘 9352852248 Good Looking standard Profil...
Verified Trusted Call Girls Adugodi💘 9352852248  Good Looking standard Profil...Verified Trusted Call Girls Adugodi💘 9352852248  Good Looking standard Profil...
Verified Trusted Call Girls Adugodi💘 9352852248 Good Looking standard Profil...
 
call girls in Vaishali (Ghaziabad) 🔝 >༒8448380779 🔝 genuine Escort Service 🔝✔️✔️
call girls in Vaishali (Ghaziabad) 🔝 >༒8448380779 🔝 genuine Escort Service 🔝✔️✔️call girls in Vaishali (Ghaziabad) 🔝 >༒8448380779 🔝 genuine Escort Service 🔝✔️✔️
call girls in Vaishali (Ghaziabad) 🔝 >༒8448380779 🔝 genuine Escort Service 🔝✔️✔️
 
Editorial design Magazine design project.pdf
Editorial design Magazine design project.pdfEditorial design Magazine design project.pdf
Editorial design Magazine design project.pdf
 
💫✅jodhpur 24×7 BEST GENUINE PERSON LOW PRICE CALL GIRL SERVICE FULL SATISFACT...
💫✅jodhpur 24×7 BEST GENUINE PERSON LOW PRICE CALL GIRL SERVICE FULL SATISFACT...💫✅jodhpur 24×7 BEST GENUINE PERSON LOW PRICE CALL GIRL SERVICE FULL SATISFACT...
💫✅jodhpur 24×7 BEST GENUINE PERSON LOW PRICE CALL GIRL SERVICE FULL SATISFACT...
 
RT Nagar Call Girls Service: 🍓 7737669865 🍓 High Profile Model Escorts | Bang...
RT Nagar Call Girls Service: 🍓 7737669865 🍓 High Profile Model Escorts | Bang...RT Nagar Call Girls Service: 🍓 7737669865 🍓 High Profile Model Escorts | Bang...
RT Nagar Call Girls Service: 🍓 7737669865 🍓 High Profile Model Escorts | Bang...
 
Booking open Available Pune Call Girls Kirkatwadi 6297143586 Call Hot Indian...
Booking open Available Pune Call Girls Kirkatwadi  6297143586 Call Hot Indian...Booking open Available Pune Call Girls Kirkatwadi  6297143586 Call Hot Indian...
Booking open Available Pune Call Girls Kirkatwadi 6297143586 Call Hot Indian...
 
Peaches App development presentation deck
Peaches App development presentation deckPeaches App development presentation deck
Peaches App development presentation deck
 
Sector 104, Noida Call girls :8448380779 Model Escorts | 100% verified
Sector 104, Noida Call girls :8448380779 Model Escorts | 100% verifiedSector 104, Noida Call girls :8448380779 Model Escorts | 100% verified
Sector 104, Noida Call girls :8448380779 Model Escorts | 100% verified
 
Call Girls Basavanagudi Just Call 👗 7737669865 👗 Top Class Call Girl Service ...
Call Girls Basavanagudi Just Call 👗 7737669865 👗 Top Class Call Girl Service ...Call Girls Basavanagudi Just Call 👗 7737669865 👗 Top Class Call Girl Service ...
Call Girls Basavanagudi Just Call 👗 7737669865 👗 Top Class Call Girl Service ...
 
Q4-W4-SCIENCE-5 power point presentation
Q4-W4-SCIENCE-5 power point presentationQ4-W4-SCIENCE-5 power point presentation
Q4-W4-SCIENCE-5 power point presentation
 
Real service provider college girl Mira Road 8976425520
Real service provider college girl Mira Road 8976425520Real service provider college girl Mira Road 8976425520
Real service provider college girl Mira Road 8976425520
 
Whitefield Call Girls Service: 🍓 7737669865 🍓 High Profile Model Escorts | Ba...
Whitefield Call Girls Service: 🍓 7737669865 🍓 High Profile Model Escorts | Ba...Whitefield Call Girls Service: 🍓 7737669865 🍓 High Profile Model Escorts | Ba...
Whitefield Call Girls Service: 🍓 7737669865 🍓 High Profile Model Escorts | Ba...
 
UI:UX Design and Empowerment Strategies for Underprivileged Transgender Indiv...
UI:UX Design and Empowerment Strategies for Underprivileged Transgender Indiv...UI:UX Design and Empowerment Strategies for Underprivileged Transgender Indiv...
UI:UX Design and Empowerment Strategies for Underprivileged Transgender Indiv...
 

LAS-3.pdf

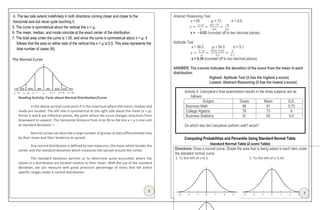
  • 1. E Abstract Reasoning Test x = 65 µ = 73 σ = 8.6 𝑧 = 𝑥−𝜇 𝜎 = 65−73 8.6 = −8 8.6 z = −0.93 (rounded off to two decimal places) Aptitude Test x = 56.5 µ = 54.5 σ = 5.1 𝑧 = 𝑥−𝜇 𝜎 = 56.5−54.5 5.1 = 2 5.1 z = 0.39 (rounded off to two decimal places) ANSWER. The z-score indicates the deviation of the score from the mean in each distribution. Highest: Aptitude Test (it has the highest z-score) Lowest: Abstract Reasoning (it has the lowest z-score) Computing Probabilities and Percentile Using Standard Normal Table Standard Normal Table (Z-score Table) Directions: Draw a normal curve. Shade the area that is being asked in each item under the standard normal curve. 1. To the left of z=0.5 2. To the left of z=1.43 7 4. The two tails extend indefinitely in both directions coming closer and closer to the horizontal axis but never quite touching it. 5. The curve is symmetrical about the vertical line x = µ. 6. The mean, median, and mode coincide at the exact center of the distribution. 7. The total area under the curve is 1.00, and since the curve is symmetrical about x = µ, it follows that the area on either side of the vertical line x = µ is 0.5. This area represents the total number of cases (N). The Normal Curve Reading Activity. Facts about Normal Distribution/Curve In the above normal curve point P is the maximum where the mean, median and mode are located. The left side is symmetrical to the right side about the mean (x = µ). Points A and B are inflection points, the point where the curve changes directions from downward to upward. The horizontal Distance from A (or B) to the line x = µ is one unit of standard deviation σ. Normal curves can describe a large number of groups of data differentiated only by their mean and their tendency to spread. Any normal distribution is defined by two measures: the mean which locates the center and the standard deviation which measures the spread around the center. The standard deviation permits us to determine quite accurately where the values in a distribution are located relative to their mean. With the use of the standard deviation, we can measure with great precision percentage of items that fall within specific ranges under a normal distribution. 2 Activity 4. Lhenylene’s final examination results in the three subjects are as follows: Subject Grade Mean S.D. Business Math 86 81 5.75 College Algebra 76 73 6 Business Statistics 91 93 6.5 On which test did Lhenylene perform well? worst?
  • 2. Week # 3 Inclusive Dates: ____________ Quarter: Quarter 3 Score: _______ Competencies: 1. Illustrate a normal random variable and its characteristics (M11/12SP-IIIc-1); 2. Identify regions under the normal curve that correspond to different standard normal values (M11/12SP-IIIc-3); 3. Convert a normal random variable to a standard normal variable and vice versa (M11/12SP-IIIc-4); and 4. Compute probabilities and percentiles using standard normal distribution (M11/12SP-IIIc-d-1); NORMAL DISTRIBUTION CONCEPTS A normal distribution is an arrangement of a data set in which most values cluster in the middle of the range and the rest taper off symmetrically toward either extreme. Characteristics of Normal Probability Distribution: 1.The curve has a single peak. 2.It is bell-shaped or shape like Mexican hat. 3.The mean lies at the center of the distribution. The distribution is symmetrical about the mean. 3. To the right of z= - 2.54 4. In between z=0.9 and z= 2.0  To calculate the area under the normal curve, we use the standard normal or z-score table.  In a z-score table, the left most column tells you how many standard deviations above the mean to 1 decimal place, the top row gives the second decimal place, and the intersection of a row and column gives the probability.  For the case of negative z-score, the same manner as with the computation of probabilities of positive z-score since the curve is symmetrical along the mean. Activity 5 A. Directions: Find the area under the standard normal curve which lies to the following conditions. Refer to the z-table and to your concept notes for you to be guided.{Hint: To the right means P(x>a), to the left means P(x<a), and between means P(a<x<b)}. 1. to the right of z=0.66 2. to the left of z=-1.53 3. to the right of z=-2.34 4. to the right of z=1.30 5. between z=-0.78 and z=0.56 B. Directions: Solve the following problem that involves area under normal curve. You are a farmer about to harvest the crop. To describe the uncertainty in the size of the harvest, you feel that it may be described as normal distribution with a mean value of 80,000 bushels with a standard deviation of 2,500 bushels. Find the probability that your harvest will exceed 84,400 bushels. 1 8 Division of Nueva Ecija NEHS – Senior High School Quezon District, Cabanatuan City STATISTICS AND PROBABILITY Creative & Critical Thinking Activities Name: ____________________________________________ Grade & Section: ___________________________________ Parent / Guardian Name & Signature: __________________ Teacher: __________________________________________
  • 3. 1. z =− 1.5 Solution: 𝑥 = 𝑧𝑠 + 𝑥 = −1.5 8.5 + 75 = −12.75 + 75 𝒙 = −𝟔𝟐. 𝟐𝟓 2. z = 2.30 Solution: 𝑥 = 𝑧𝑠 + 𝑥 = 2.30 8.5 + 75 = 19.55 + 75 𝒙 = 𝟗𝟒. 𝟓𝟓 Application Apply the concept of converting normal random variable to standard normal variable to solve verbal problems. 1. Shown below are Mr. Rivera’s scores, the mean, and the standard deviation of each three tests given to 500 applicants. Test Mr. Rivera’s Score Mean S.D. Personality 72.2 68.2 10.5 Abstract Reasoning 65 73 8.6 Aptitude 56.5 54.5 5.1 On which test did Mr. Rivera stand highest? lowest? Solution: To determine the answer, convert the scores of each test in standard score. Personality Test x = 72.2 µ = 68.2 σ = 10.5 𝑧 = 𝑥−𝜇 𝜎 = 72.2−68.2 10.5 = 4 10.5 z = 0.38 (rounded off to two decimal places) Three Mathematical Facts about Normal Distribution: 1. About 68% of the values in the population fall within ±1 std. deviation from the mean (actual value 68.27%) 2. About 95% of the values in the population within ±2 std. deviation from the mean (actual value 95.45%) 3. About 99% of the values are in an interval ranging from 3 std. deviation below the mean to 3 std. deviation above the mean (actual value 99.74%). Activity 1. Directions: True or False. Write T if the statement is correct and F if otherwise. Write you answer on the space provided. ______1. Heights and weights of people, blood pressure, test score and error in measurements are examples of things that follow normal distribution. ______2. The curve in normal distribution is divided into two by the line x = µ. ______3. The horizontal distance of both inflection points to the line x = µ is 2 units of standard deviation. ______4. The three important measures in normal distributions are mean, median and mode. ______5. If you have 500 observations and it represents a normal distribution, there are 340 values in the population fall within ±2 std. deviation. Activity 2. Directions: Choose the correct word inside the parenthesis to make the statement correct. Underline the correct answer. 1. The normal distribution is centred at its (mean, median, standard deviation). 2. The total area under the normal curve is (1, 2, 3). 3. For a normal random variable, the probability of observing a value less than or equal to its mean is (0, 0.5, 1). 4. The mean, median and mode in normal distribution are (equal, unequal). 5. The one that measures the location in the normal curve is (mean, variance, standard deviation). 6 3 Activity 2. Using the derived formula, convert the following standard score (z-score) to real score: Given: x = 52 s = 7 1. z = 1.5 x = ____________ 2. z = −2 x = ___________ 3. z = −0.25 x = ___________
  • 4. 2. x = 50 Solution: 𝑧 = 𝑥−𝜇 𝜎 = 50−60 4 = −10 4 𝒛 = −𝟐. 𝟓 3. x = 60 Solution: 𝑧 = 𝑥−𝜇 𝜎 = 60−60 4 = 0 4 𝒛 = 𝟎 Note that in converting normal random variable x, you have to substitute the values given and the random variable x in the formulas: 𝒛 = 𝒙−𝝁 𝝈 or 𝒛 = 𝒙−𝒙 ̅ 𝒔 Converting standard normal random variable to normal random variable Note: For convenient way of converting standard normal random variable to normal random variable, derive the formula to solve for normal random variable x. 𝑧 = 𝑥−𝜇 𝜎 𝑧 = 𝑥−𝑥 𝑠 𝑧𝜎 = 𝑥 − 𝜇 𝑧𝑠 = 𝑥 − 𝑥 𝑧𝜎 + 𝜇 = 𝑥 𝑧𝑠 + 𝑥 = 𝑥 𝒙 = 𝒛𝝈 + 𝝁 𝒙 = 𝒛𝒔 + 𝒙 ̅ Determine the real score of the following z-score. Given: x = 75 s = 8.5 3. z = 0.35 Solution: 𝑥 = 𝑧𝑠 + 𝑥 = 0.35 8.5 + 75 = 2.975 + 75 𝒙 = 𝟕𝟕. 𝟗𝟖 (rounded off to two decimal places) The Standard Normal Distribution Standard normal distribution is a special case of the normal distribution. It is the distribution that occurs when a normal random variable has a mean of zero and a standard deviation of one. The normal random variable of a standard normal distribution is called standard score or z-score. Every normal random variable X can be transformed into a z-score via the following equation: Population: 𝒛 = 𝒙−𝝁 𝝈 Sample: 𝒛 = 𝒙−𝒙 ̅ 𝒔 Z-score of a normal random variable (raw score x) measures the number of standard deviations between a raw score x and the mean of the distribution where the raw score x came from. Normal Curve Standardized Normal Curve Converting normal random variable to standard normal variable Study the following examples. Pay careful attention to the results and how the normal random variable was converted to standard normal variable. Covert the following real score into standard score. Given: µ = 60 σ = 4 1. x = 68 Solution: 𝑧 = 𝑥−𝜇 𝜎 = 68−60 4 = 8 4 𝒛 = 𝟐 4 5 Activity 3. Compute for the corresponding z-score for each of the normal random variable. (Round off your answer into two decimal places) Given: µ = 75 σ = 5.1 1. x = 80 z = _______________ 2. x = 63 z = _______________ x = 82 z = _______________