The Arithmetic of Shale Gas
•
1 gostou•1,286 visualizações

A paper written by Yale economists looking in detail and both the costs and benefits of shale gas drilling. They quantify the benefits and conclude that shale gas drilling's benefits outweigh its costs (including environmental costs) by a factor of 400 to 1.

Recomendados
Recomendados
Mais conteúdo relacionado
Destaque
Destaque (6)
Semelhante a The Arithmetic of Shale Gas
Semelhante a The Arithmetic of Shale Gas (20)
Mais de Marcellus Drilling News
Mais de Marcellus Drilling News (20)
Último
Último (10)
The Arithmetic of Shale Gas
- 1. The Arithmetic of Shale Gas Yale Graduates in Energy Study Group 1 On May 11, 2012, The New York Times published an editorial on making natural gas extraction technology “safer” for the neighbors and landowners where new wells are being drilled. The first sentence said that “There is little doubt that the (new shale) gas is plentiful and cleaner than coal (and) could help with the country’s energy and climate problems” but the Times went on to deny this economic gain…”unless the public can be sure that it will not pollute water supplies or the air.” This approach to new technology is in the tradition of cost-benefit analysis (“CBA”) as required for all Federal regulation that certifies beneficial gains to the economy. When justifying acceptance of new energy technology, then in most cases, the findings are that benefits are substantially in excess of the cost, indeed by as much as is required to compensate those on whom the costs are imposed. The New York Times however dispenses with assessment of benefits. There is no mention of gains to industry from lower-cost fuel and raw material supplies, of gains to home consumers from lower monthly heating, air conditioning and power costs as new shale gas expands supplies lowering prices delivered through the national large-scale pipeline network. Instead the Times focuses on contamination of groundwater, failures in the disposal of contaminated water used in the drilling process, failures to deal with the chemicals used in the drilling process, and last but not least on air pollution from escaping methane (i.e. the natural gas itself). The orders of magnitude of these costs to the economy are not estimated nor are they compared to benefits. There are methods proposed for reducing costs, such as preventing any drilling 1 Robert Ames, Solazyme Corporation; Anthony Corridore, Lafarge North America; Joel N. Ephross, Duane Morris LLP; Edward A. Hirs III, Hillhouse Resources, LLC and University of Houston; Paul W. MacAvoy, Professor Emeritus Yale University; and Richard Tavelli, private energy consultant Page 1 Electronic copy available at: http://ssrn.com/abstract=2085027
- 2. where it is anticipated that costs could be imposed, or adding production taxes to pay for regulation that might prevent social costs. The approach taken in this note is to go beyond the complaints, however profuse and loud and include those where the new gas wells have not only caused spills, made excessive noise, and produced disagreeable odors. We attempt here to assess the scale of benefits as well, including substantial front end royalties paid to the complainants and increased amounts of lower cost energy resources for manufacturing, trade and household consumption as well as increased tax revenues of state and local governments generated from the sale of more (shale) gas. We have not been able to specify most of these gains, but we can find numbers for the order of magnitude of total quantities going to market. The Concepts of Revenues and Costs in Shale Well Drilling At this point to begin it is appropriate to ask whether there is more than local land, water and air quality decay to be derived from drilling shale gas wells. In the most general sense, there must be gas-based product from which consumers derive benefits. The question then becomes whether the costs (both production costs and environmental costs) exceed the benefits from the purchase and sale and ultimate consumption of this new supply of natural gas. The process of production, from recent rapid spread of decades old shale fracturing technology, is not different in kind from natural gas production methods developed over the last century for extracting gas from non-shale formations. Wells are drilled some distance underground and the vertical hole encased by pipe and sealed with cement to produce gas under great temperature and pressure. The technology for shale formations uses pipes stretched horizontally from the base of the vertical pipe to inject at high pressure liquids (water plus proppants and surfactants specific to the well) to fracture the shale formation that allows the movement of additional methane (and any concomitant natural gas liquids and oil) to the base of the vertical pipe. Production costs incurred are very likely to be in the Page 2 Electronic copy available at: http://ssrn.com/abstract=2085027
- 3. range of one dollar per thousand cubic feet (mcf) of gas produced plus or minus 50-cents depending upon specific drilling and pressure conditions. Table One shows these costs for five shale gas production companies for which there is information publicly available. In some instances production cost outlays are less than amortization expenses or interest expenses on capital outlays. Our estimate of marginal costs of $1.00 per mcf however is similar to those from company to company based on the operations of thousands of wells in various shale basins. In 2010 the natural gas average sales price per company including all gains/losses on financial gas derivatives ($ per mcf) at the wellhead, regional pipeline market and delivery point was between $4.64 and $5.57 per mcf. Because of substantial differences in the locations of basins across the country of shale, and new wellhead production points, sales prices differed because of varied delivery costs into pipeline hubs. Prices also varied because of differences between short and long-term contracts and spot sales. Even so one can make a judgment that in that year all natural gas together (conventional vertical well gas and shale gas) sold at a hypothetical central market for $5.00 per mcf. This is because natural gas from various sources all sold in a competitive market both at the wellhead and in commodity exchanges after incurring marginal costs of production of $1.00 per mcf. 2 2 EIA has calculated the average U.S. Natural Gas Wellhead Price (Dollars per Thousand Cubic Feet) at $4.48 for 2010. Page 3 Electronic copy available at: http://ssrn.com/abstract=2085027
- 4. Table One: 5 Company Chesapeake Carrizo Southwestern Energy Cabot WPX Energy Weighted Average Year End Nine Months Ended Year End Year End Year End December 30, September 30, December 30, December 30, December 30, 2010 2010 2010 2010 2010 2010 Natural Gas Average Sales Price* ($ per mcf) 5.57 5.37 4.64 5.54 5.15 Expenses ($ per mcf): Production expenses 0.99 0.86 0.70 0.83 1.09 1.45 Production taxes 0.18 0.15 0.18 0.11 0.29 0.27 General and administrative expenses 0.46 0.44 0.93 0.30 0.61 0.60 Natural gas and oil depreciation, depletion and amortization 0.66 1.35 Impairment 0.00 0.10 Depreciation and amortization of other assets 1.02 0.21 1.19 1.34 2.50 2.10 (d) Interest expense 0.10 0.08 1.14 0.52 Total Expenses 3.41 3.09 4.25 2.58 5.01 4.42 MC(1) = Production expenses + Production taxes ($/mcf) 1.17 1.01 0.88 0.94 1.38 1.72 Total Production (full year) - Gas Only (bcf) 924.9 35.8 403.6 125.5 403.9 Total "Net" Gas Production Wells (full year) - Gas Only 20600 251 2474 4613 7890 Average Production per Well (mmcf/well) 72.12 44.9 142.7 163.1 27.2 51.2 Source: Company Annual Reports Page 4
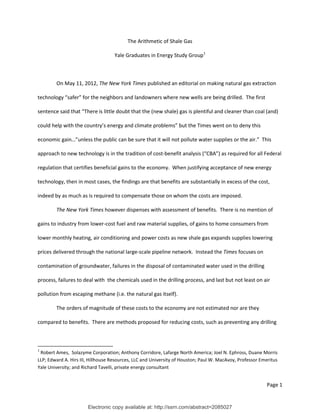
- 5. The operating income margin of $4.00 ($5.00 operating revenues minus $1.00 marginal costs) would appear to be economic gain, but it is not what we mean by benefits. As indicated in Table One, general expenses, depreciation and amortization of assets, and interest expense comprise parts of total expenses that are in addition to marginal costs. If the (representative) company were to sustain its operations at current production rates expenses making up average total cost of $2.58 to $5.01 per mcf would have to be included. The operating income margin (Price minus Average Total Cost) in the long run would have to exceed $2.48 per mcf for Chesapeake and $0.53 per mcf for Cabot. In the last year that prices were “normal”, i.e. relatively unaffected by the surge of new supplies from shale formations and reduced demand from mild winter weather, producer positive net returns ranged from $2.293 billion at Chesapeake to $66.515 million at Cabot (as estimated by multiplying the operating margin by annual gas production). Benefits for Users and Consumers from Shale Gas This net income from production accumulated by producers is hardly the amount of benefits of greatest interest). It is the gain to consumers of the gas that determines benefits since the consumers incur the environmental costs. Manufacturers of chemicals and materials, household users of heating, air conditioning and electricity purchased more gas for less payment to realize these benefits. The traditional measure of such benefit, Consumer Surplus, is the “B” of CBA in our view and equals the difference between the market price and what a consumer is willing to pay. In the traditional supply demand diagram, with declining demand (illustrated by a line stretching from a price at which zero units would be demanded down to the price at current consumption rates). The area above the current price as illustrated in Diagram One, consists of a measure of such benefits. That is, the difference between an all or nothing offer to pay for the entire quantity and the amount actually paid at current price is the “benefit” from having the production available. With both linear supply and demand curves, the supply curve with a positive slope and the demand curve A to B with a negative slope, and equilibrium price Page 5
- 6. where supply equals demand, then consumer surplus is illustrated by the triangle (A – P)Q/2 for the volume Q taken at price P. This is the sum of the (vertical) amounts that consumers would pay—their total benefit minus actual market price paid. (See Price Theory, 3rd edition, Jack Hirshliefer, pp 218 – 219) Page 6
- 7. Diagram One: Economy-wide Benefits from Shale Gas Induced Gas Price Reductions Price ($/Mcf) A $9 2008 U.S. Natural Gas Wellhead Price ($7.97/mcf) $7 SUPPLY CURVE consumer surplus $5 2010 U.S. Natural Gas Wellhead Price ($4.48/mcf) P $3 producer surplus DEMAND CURVE $1 MARGINAL COST B Quantity (TCF) 12.5 25 Q 37.5 49.5 2010 Total Natural Gas Withdrawals of 26.8 Trillion cf Page 7
- 8. Then what are the gains for consumers from the production distributed from its gas wells by Chesapeake, say, in 2010? To answer this question we would have to know the slope of the demand curve facing Chesapeake at various locations. There is no such demand curve. In current markets, that slope is zero because, with large numbers of other sources of both shale gas and conventional production gas in the same basins, any price specific to Chesapeake, net of transportation and other costs unique to Chesapeake’s well will be approximately the same as for any other producer. But consider that each producer faces the same demand condition, then the hypothetical demand is a pro rata share of the basin demand and is downward sloping. The hypothetical demand curve at the well has the same slope at any price. Then assuming that the market wide elasticity of demand were -.20, consumer surplus on Chesapeake’s gas sales approximates $4.217 billion (924.9 million mcf *($5.57 - $1.01)/mcf). In at least this one example, involving consumer gains in one year, for one company’s production, the surplus of consumers is expected to exceed the producer’s costs and gains by a factor of two. Benefits for the Economy for One Year from Shale Gas There is some indication of very large gains for the economy from shale gas from comparing year to year total consumption. Within the triangle of consumer surplus there is a rectangle of the difference in prices in successive years times the quantity of earlier year’s sales. This is a conservative estimate of consumer surplus since it takes no account of the increased consumption that occurs in response to the reduction in price. But since the elasticity of demand is quite low, that increase is small. The nominal price (that is, the Henry Hub spot price) in 2008 was $7.97 per mcf and in 2011 was $3.95 per mcf (US Energy Information Administration,) 3 so that the difference in price over three successive years was $4.02 per mcf. Gas production in 2008 was 25.6 tcf so that the surplus to consumers by the price reduction from shale gas equaled $102.9 billion. 3 http://www.eia.gov/dnav/ng/ng_pri_sum_dcu_nus_a.htm Page 8
- 9. This very large amount of consumer gain—over $100 billion—from the new technology induced price reduction in gas is the elephant in the room. It comprised a substantial majority of total expenditures on this fuel nationwide. In past years those expenditures were limited by the higher costs of production of gas produced from vertical wells. These were in part producer surplus but most were the costs of sustaining well operations in the old technology. Even so it is startling to acknowledge that consumer benefits from the technology of shale gas drilling and new gas production can be expected to exceed $100 billion per year, year in and year out as long as present production rates are maintained. Economy-Wide Costs of Shale Well Drilling But as we have indicated already in this assessment there are adverse affects—costs against these benefits—on water, ground conditions and air quality from shale fracking. To complete even the rough approximate CBA requires these costs be estimated and subtracted from the $100 billion of the year to year consumer gains. To undertake such an assessment of costs, we have reviewed current studies and reports on accidents, misuse of technology and poor well design and installation. A 2011 report for the Secretary of Energy (“Deutch Report”) counted 19 instances of problems with frackwater over the previous few years, amid thousands of wells drilled. 4 The Deutch Report could not confirm any instances of groundwater contamination from fracking but it found incidences of some remediated surface spills. The Oklahoma Corporations Commission, the regulatory authority for all oil and gas drilling in that state with more than 100,000 oil and gas wells hydraulically fractured, documented no incidents of groundwater contamination. The EPA has reported an instance of hydraulic fracturing contamination at two deep (more than 7,000 feet) water wells (in Wyoming) as a matter of concern (it is useful to note 4 Secretary of Energy Advisory Board, Chaired by John Deutch, “Shale Gas Production Ninety Day Report” August 18, 2011. The Secretary of Energy Advisory Board also included Stephen Holditch, Texas A & M; Fred Krupp, Environmental Defense Fund; Kathleen McGinty, Weston Solutions; Susan Tierney, Analysis Group; and Mark Zoback, Stanford University. Page 9
- 10. that many underground aquifers in Wyoming, as well as across the nation, are saltwater aquifers with heavily mineralized waters which are unsuitable for agriculture, livestock or human consumption without significant gains from purification). At this stage, then, consider the known contamination that hypothetically could occur on a micro scale, that of one well and one property owner. Would fracking impair the property owners’ domestic water resources? What is the cleanup cost if a tanker truck turns over and spills the tank’s contents in the rancher’s pasture? In this instance, there is not likely to be impairment of a ranch’s well water due to spatial and geologic separation of water resources. Nor would there be a case of intrusion of fracking liquids in the well water. Well water supplies are drawn from aquifers usually no more than 500-feet below the surface and generally well separated by many stratifications of geologic formations from oil and gas resources at depths in excess of 4,000-plus feet. This makes contamination extremely unlikely. In addition current state by state regulations require steel and cement sealed casing for oil and gas wells passing through the shallow aquifers. In addition, as a matter of course, in the contracting process for drilling rights private landowners can and do require even more safeguards. 5 However, there is always a potential for even the greatest of redundancies in safeguards to fail. Assuming that there is a failure during fracking or production, the well crew would be able to detect the failure by a loss of pressure and fluid return. Engineering calculations can be done to determine the fluid loss and the extent of the damage. Cleanup efforts would begin on the well, and the gas company would compensate the rancher by trucking in quantities of potable water for ongoing ranch operations. The cost of trucking in potable water can range from $0.50 per barrel to $2.00 per barrel. The damage costs would be determined by the number of barrels until either the aquifer self-cleans by its natural 5 A study underway at Yale University in the Marcellus basin on the East Coast will drill through the 500- feet of surface aquifers to set up monitoring wells to detect any hydrologic changes in the surface aquifers due to fracking at depths of 7,000. Page 10
- 11. flow of water through the pores of the subsurface rock or the gas company drills a new water well— ordinarily a task accomplished within weeks at a cost of less than $5,000. But a 5,000 gallon tanker truck turning over in a rancher’s pasture could mean a release of the whole 5,000 gallon load. Most of this would be water and sand, which could be eliminated with absorbents and shovels. In the Wyoming basins, the cost of removing contaminated water for either deepwell disposal or remediation has been up to $3.00 per barrel (a barrel containing 42 gallons). In Texas, the costs would be less. Depending on how porous the soil is in the yard, the wastes seep down into the earth. Once there, the concentrations in the soil determine the level of cleanup. Again, most of these are likely to be hydrocarbons, which may stay on the surface in thick masses, or slowly leach into the soil, if they do not first evaporate and disperse into the air. Heavy metals, unless moved by the liquid portion of the waste or rainfall, are not likely to move deep into the soil. These contaminated soils can be scraped up and trucked offsite. A key factor is the distance of the remediation site to the landfill. A rough estimate is that 5,000 cubic yards of material disposed of at an offsite landfill at $500 per cubic yard, including on site sampling, crew protection, transportation, and disposal comes to a total outlay of $2.5 million. This example, of course, may vary greatly due to site specific conditions. However, based on our direct experience with environmental remediation efforts in oil and gas operations, it is clear that the cost of a discrete spill event would not impair the economic value of a drilling operation, especially if on the rancher’s land there is more than one oil and gas well. An Economy-Wide Estimate of Benefits and Costs From Shale Gas How then do we extrapolate individual disaster scenarios across an entire industry to determine the social cost of possible contamination from fracking in order to deduct it from the consumer surplus of $100 billion for each year? We consider that the reported instances of contamination from fracking relate, at most, to an extremely limited minority over hundreds of thousands of wells. Assuming the Page 11
- 12. worst—that the accidents occur in one year; that the cleanup requires a new water well at $5,000; and that one hundred spills occur at $2.5 million per spill given then that the industry drills 10,000 new wells per year. The cost of frackwater contamination is $250 million. Economic benefits, as estimated in as limited methodology as is reasonable, exceed costs to the community by 400-to-1. Consumer Surplus Due from Replacing One Barrel of Crude Oil with New Shale Gas In keeping with the national debate on the future of natural gas as a replacement for crude oil, we consider the consumer surplus of replacing one barrel of oil with its BTU equivalent of 6 mcf of shale gas. We assume that the current price of oil is $100 per bbl. If we use the gas wellhead price of $5/mcf and multiple it by 6 to get a per bbl of oil equivalent (“boe”) of $30 of cost, the savings is $100/bbl - $30/boe. Therefore, the gain to consumers of replacing one barrel of oil with a natural gas fuel equivalent is approximately $70/bbl. Current US consumption of crude oil is approximately 15.0 million bbls per day. Replacing 1.0 million bbls per day of crude oil with the 6 billion cubic feet (bcf”) equivalent of natural gas, would generate approximately $25.6 billion ($70/bbl*1 million bbls*365 days) of consumer surplus for the US economy over one year. Page 12