SlideShare uma empresa Scribd logo
1 de 5
Baixar para ler offline
Independent	Fiscal	Of ice						July	2016 	 	 	 									1	
Research	Brief	2016‐3																																																																																																																			July	2016 
Impact Fee Update and 2016 Outlook
	
Pennsylvania	 collects	 an	 annual	 impact	 fee	 on	
unconventional	(i.e.,	shale)	natural	gas	wells	that	were	
drilled	or	operating	in	the	previous	calendar	year.	The	
impact	 fee	 for	 an	 unconventional	 natural	 gas	 well	 is	
determined	according	to	a	bracketed	schedule	based	
on	the	number	of	years	since	a	well	became	subject	to	
the	 impact	 fee	 (operating	 year),	 the	 type	 of	 well	
(horizontal	or	vertical)	and	the	annual	average	price	
of	natural	gas.	
Wells	that	produce	less	than	90	Mcf	(thousand	cubic	
feet)	per	day	for	the	entire	year	are	known	as	stripper	
wells.	 Horizontal	 stripper	 wells	 in	 operating	 years	
four	 or	 greater	 and	 all	 vertical	 wells	 that	 produce	
below	 the	 stripper	 well	 threshold,	 regardless	 of	
operating	 year,	 are	 exempt	 from	 the	 impact	 fee.	
Horizontal	 wells	 that	 have	 been	 plugged	 are	 exempt	
after	their	 irst	operating	year.		
The	 Public	 Utility	 Commission	 (PUC)	 recently	
reported	 collections	 of	 $187.7	 million	 for	 calendar	
year	 (CY)	 2015	 (remitted	 in	 April	 2016),	 bringing	
cumulative	collections	to	$1.04	billion.1	Proceeds	from	
the	 impact	 fee	 are	 distributed	 to	 local	 governments	
and	 state	 agencies	 to	 provide	 for	 infrastructure,	
emergency	 services,	 environmental	 initiatives	 and	
various	 other	 programs.	 (See	 Table	 1.)	 Counties	 and	
municipalities	receive	funds	based	on	the	prevalence	
of	 drilling	 activity	 in	 each	 jurisdiction	 or	 their	
proximity	 to	 jurisdictions	 in	 which	 drilling	 activity	
takes	place.	
I 	
Table	1:	Impact	Fee	Revenues	and	Distributions	
		 2011	 2012	 2013	 2014	 2015	
		Total	Revenues	 $204,210	 $202,472	 $225,752	 $223,500	 $187,712	
Counties,	Municipalities	and	HARE	Fund1	 108,726	 107,683	 123,151	 123,300	 101,800	
Marcellus	Legacy	Fund	 82,484	 79,289	 84,601	 82,200	 67,867	
Commonwealth	Agencies	 10,500	 10,500	 10,500	 10,500	 10,500	
Conservation	Districts/Commission	 2,500	 5,000	 7,500	 7,500	 7,500	
Notes:	Dollar	amounts	in	thousands.	Fees	are	remitted	in	the	following	April	and	distributed	in	July.	
Source:	Pennsylvania	Public	Utility	Commission.		
1	Housing	Affordability	and	Rehabilitation	Enhancement	Fund.	
For	CY	2015,	impact	fee	collections	were	signi icantly	
lower	 than	 the	 prior	 year.	 This	 research	 brief	 (1)	
examines	the	reasons	for	that	decline,	(2)	details	the	
number	 of	 wells	 and	 fee	 schedule	 by	 operating	 year	
and	 (3)	 discusses	 three	 potential	 scenarios	 for	 CY	
2016	collections.	It	also	translates	the	impact	fee	into	
an	annual	average	effective	tax	rate	(ETR).	This	metric	
quanti ies	 the	 implicit	 tax	 burden	 imposed	 by	 the	
impact	fee	in	a	given	year.  
2015	I 	F 	R 	
For	CY	2015,	impact	fee	revenues	were	$187.7	million,	
which	 is	 $35.8	 million	 lower	 than	 the	 amount	
collected	 in	 the	 prior	 year.	 Table	 2	 (see	 next	 page)	
details	 the	 well	 count,	 fee	 schedule	 and	 actual	
collections	 by	 operating	 year.	 The	 decline	 in	
collections	can	be	decomposed	as	follows:	
 Lower	fee	schedule.	The	2015	impact	fee	schedule	
decreased	by	$5,000	per	well	for	horizontal	wells	
in	 operating	 years	 one,	 two,	 four	 and	 five.	 This	
adjustment	 is	 the	 result	 of	 the	 annual	 average	
price	 of	 natural	 gas	 on	 the	 New	 York	 Mercantile	
Exchange	(NYMEX)	falling	to	$2.66,	which	is	below	
the	 $3.00	 per	 MMBtu	 threshold	 that	 triggers	 a	
downward	 adjustment	 to	 the	 fee	 schedule.2		
Estimated	impact:	‐$33.0	million.	
 Collections	from	new	wells.	There	were	786	new	
wells	(operating	year	1)	subject	to	the	impact	fee	
in	2015.	Estimated	impact:	+$35.5	million.
Independent	Fiscal	Of ice						July	2016 	 	 									 									2	
 
 Reduced	collections	from	existing	wells.	Wells	pay	
lower	fees	as	they	migrate	down	the	fee	schedule	
or	become	stripper	wells.	(See	Table	2.)	Estimated	
impact:	 ‐$38.3	 million,	 including	 late	 and	 prior	
year	disputed	payments.	
The	main	driver	of	lower	impact	fee	revenues	was	the	
price	 of	 natural	 gas.	 The	 dramatic	 decline	 in	 the	
average	 price	 (1)	 reduced	 the	 fee	 schedule	 for	 CY	
2015	 (the	 irst	 such	 occurrence)	 and	 (2)	 motivated	
irms	 to	 reduce	 the	 drilling	 of	 new	 wells.	 The	 783	
horizontal	wells	spud	in	2015	(operating	year	1)	were	
less	 than	 the	 1,339	 horizontal	 wells	 spud	 in	 2014	
(currently	 operating	 year	 2).	 An	 additional	 $25.2	
million	would	have	been	collected	for	CY	2015	if	the	
number	 of	 new	 wells	 had	 remained	 constant	 from	
2014	to	2015.	
E 	T 	R 	
The	impact	fee	does	not	directly	respond	to	the	price	
of	natural	gas	or	the	volume	of	production,	and	it	does	
not	 provide	 a	 measure	 of	 tax	 burden	 relative	 to		
natural	 gas	 sales.	 Therefore,	 this	 research	 brief	
computes	an	annual	average	effective	tax	rate	(ETR)	
for	all	wells	in	operation	during	the	year.3		
The	 ETR	 is	 equal	 to	 annual	 impact	 fee	 revenues	
divided	 by	 the	 total	 market	 value	 of	 unconventional	
natural	gas	production.	 The	market	value	is	equal	to	
the	product	of	(1)	the	annual	average	regional	price	of	
natural	 gas	 net	 of	 post‐production	 costs	 and	 (2)	 the	
total	production	from	all	unconventional	wells.	
	
 
Table	2:	Well	Count	and	Actual	Collections	for	2015 
Operating	 Wells	Subject	to	Fee	 Actual	
Year1  Horizontal	 Vertical	 Horizontal	 Vertical	 Collections	
1	 783	 3	 $45,300	 $9,100	 $35,497,200	
2	 1,339	 7	 35,200	 7,000	 47,181,800	
3	 1,176	 12	 30,200	 6,000	 35,587,200	
4	 1,114	 10	 15,100	 3,000	 16,851,400	
5	 3,335	 95	 15,100	 3,000	 50,643,500	
Subtotal	 7,747	 127	 	 	 			185,761,100	
Other	Payments2	 	 	 	 	 1,950,600	
Total	 7,747	 127	 	 	 	187,711,700	
Source:	Pennsylvania	Public	Utility	Commission.	
1	Refers	to	the	number	of	years	a	well	has	been	subject	to	the	impact	fee.	Horizontal	wells	are	subject	to	the	fee	for	the	 irst	
three	years	after	being	spud.	Horizontal	wells	in	other	operating	years	and	all	vertical	wells	are	subject	to	the	fee	if	they	pro‐
duce	above	the	stripper	well	threshold.	
2	Late	payments	or	resolved	disputed	payments	attributable	to	prior	calendar	years,	remitted	with	2015	collections.	The	
wells	remitting	these	payments	are	included	in	the	well	count	above.	
Fee	Amount	
The	ETR	computation	for	CY	2015	uses	these	data:	
 Annual	 production	 of	 4.6	 trillion	 cubic	 feet.	 This	
figure	is	based	on	statewide	well	production	data	
published	 by	 the	 Department	 of	 Environmental	
Protection	(DEP).	
 An	annual	average	price	of	$1.43	per	Mcf,	prior	to	
the	deduction	of	post‐production	costs.4	This	price	
is	 a	 weighted	 average	 of	 spot	 prices	 at	 the	
Dominion	 South	 and	 Leidy	 trading	 hubs,	
converted	to	dollars	per	thousand	cubic	feet.
5
		
 Post‐production	 costs	 of	 $0.84	 per	 Mcf.	 This	
amount	 reflects	 costs	 for	 gathering,	 processing	
and	 transporting	 gas	 to	 markets.	 Such	 costs	 are	
deducted	 to	 approximate	 the	 value	 of	 gas	 at	 the	
wellhead,	 the	 point	 at	 which	 other	 states	 levy	
severance	taxes.		
For	CY	2015,	the	ETR	is	6.9	percent,	an	increase	of	4.5	
percentage	points	from	2014.	The	annual	average	ETR	
for	 2011	 to	 2014	 declined	 in	 each	 successive	 year.	
(See	 Table	 3.)	 The	 main	 cause	 of	 that	 trend	 was	 the	
dramatic	increase	in	production	over	the	time	period.	
The	2015	increase	is	predominantly	motivated	by	the	
sharp	decline	of	natural	gas	prices	(54.3	percent	prior	
to	the	deduction	of	post‐production	costs).					
N ‐P 	W 	
New	production	from	formerly	non‐producing	wells	is	
a	 reason	 that	 unconventional	 gas	 production	 has	
increased	despite	a	decline	in	the	number	of	new	wells	
drilled.	 There	 are	 two	 types	 of	 non‐producing	 wells
Independent	Fiscal	Of ice						July	2016 	 	 									 									3	
 
2016	O 	
For	 CY	 2016,	 two	 factors	 will	 have	 significant	
implications	for	impact	fee	revenues.	They	include:	
(1)	The	statutory	fee	schedule.	The	schedule	is	based	
on	the	average	price	of	natural	gas	on	the	NYMEX.	If	
that	price	falls	below	$2.25	per	MMBtu	for	CY	2016,	
the	 impact	 fee	 schedule	 will	 decline	 by	 $5,000	 per	
well	(horizontal)	compared	to	CY	2015	levels.	For	the	
first	 six	 months	 of	 2016,	 the	 NYMEX	 price	 ranged	
from	$1.71	to	$2.92,	with	an	average	of	$2.11.	Bentek	
Energy	forecasts	that	the	price	 for	the	remainder	of	
the	 year	 will	 average	 $2.73,	 for	 a	 calendar	 year	
average	 of	 $2.38.	 This	 level	 is	 close	 to	 the	 $2.25	
threshold	for	a	schedule	adjustment.	
(2)	 The	 number	 of	 new	 wells.	 DEP	 spud	 data	 from	
January	 to	 June	 2016	 reveal	 an	 approximate	 60	
percent	year‐over‐year	decline	in	the	number	of	new	
horizontal	 wells	 spud	 (no	 vertical	 wells	 have	 been	
spud	 in	 2016	 to	 date).	 Wells	 in	 their	 first	 year	 of	
operation	pay	the	impact	fee	at	the	highest	level.	(See	
Table	2.)	Revenues	from	new	wells	are	important	to	
total	 impact	 fee	 collections	 because	 they	 offset	 the	
decline	 in	 fees	 received	 from	 existing	 wells	 as	 they	
age.	 For	 example,	 a	 well	 spud	 in	 2015	 paid	 a	 fee	 of	
$45,300.	That	same	well	will	pay	a	fee	of	$35,200	for	
CY	2016.8	
Table	4	displays	three	potential	scenarios	for	CY	2016	
impact	 fee	 revenues.	 The	 scenarios	 differ	 based	 on	
the	number	 of	 new	wells	spud	in	the	second	half	of	
2016	 and	 whether	 or	 not	 a	 fee	 schedule	 reduction	
occurs.	Each	scenario	contains	the	same	assumptions	
for	(1)	the	number	of	wells	that	attain	stripper	status	
for	CY	2016	and	become	exempt	and	(2)	the	number	
of	previously	non‐producing	wells	that	did	not	pay	an	
impact	fee	for	CY	2015,	but	which	will	be	brought	into	
that	are	relevant	to	this	discussion:	(1)	“spud	but	not	
completed”	wells	that	have	been	drilled	but	are	not	
yet	 producing	 and	 (2)	 “shut	 in”	 wells	 that	 have	
produced	 natural	 gas	 but	 are	 currently	 dormant.	
These	types	of	non‐producing	wells	generally	can	be	
brought	 into	 production	 at	 a	 lower	 cost	 than	 new	
drilling.	 In	 the	 current	 low‐price	 environment,	
operators	 have	 incentive	 to	 obtain	 production	 from	
non‐producing	wells	in	lieu	of	drilling	new	wells.		
According	 to	 recent	 data	 released	 by	 DEP	 and	
analyzed	 by	 the	 IFO,	 the	 number	 of	 spud	 but	 not	
completed	wells	peaked	at	the	end	of	2014,	and	the	
number	of	shut‐in	wells	peaked	in	the	second	quarter	
of	 2015.6	 These	 data	 indicate	 that	 a	 number	 of	
formerly	 non‐producing	 wells	 recently	 have	 been	
placed	into	production.	This	trend	corresponds	with	
the	decline	in	new	wells	spud	over	the	same	period.7	
New	 production	 from	 non‐producing	 wells	 affects	
impact	 fee	 collections	 differently	 than	 newly‐drilled	
wells.	 Horizontal	 wells	 must	 pay	 the	 impact	 fee	 for	
the	first	three	years	after	being	spud,	even	if	they	do	
not	 produce.	 When	 brought	 into	 production,	 a	
formerly	non‐producing	well	continues	to	be	subject	
to	the	statutory	fee	schedule	from	the	point	it	left	off,	
which	 will	 be	 less	 than	 the	 fee	 paid	 on	 a	 newly‐
drilled	well.			
If	 non‐producing	 wells	 are	 placed	 into	 production	
instead	 of	 drilling	 new	 wells,	 impact	 fee	 collections	
will	be	constrained,	even	if	production	holds	steady	
or	increases.	Due	to	the	reduction	in	the	inventory	of	
non‐producing	 wells,	 it	 is	 unclear	 how	 long	
producers	can	rely	on	those	wells	to	supply	further	
support	for	production.	
	
Table	3:	Impact	Fee	Annual	Effective	Tax	Rates 
Calendar	Year	
Impact	Fee	 Unconventional	 Price	of	 Market	 Annual	
Revenues	 Production	(MMcf)	 Gas	($/Mcf)1	 Value2	 ETR	
2011	 $204,210	 1,064,000	 	 $3.40	 	 $3,612,700	 				5.7%	
2012	 202,472	 2,042,900	 	 1.93	 	 3,937,600	 				5.1%	
2013	 225,752	 3,102,900	 	 2.70	 	 8,381,000	 				2.7%	
2014	 223,500	 4,070,400	 	 2.33	 	 9,493,100	 				2.4%	
Notes:	Dollar	amounts	in	thousands.	Mcf	is	thousand	cubic	feet.	MMcf	is	million	cubic	feet.	
Sources:	Pennsylvania	Public	Utility	Commission,	Department	of	Environmental	Protection	and	Bentek	Energy.	
1	Weighted	average	spot	price	converted	to	dollars	per	Mcf	using	Pennsylvania	heat	content,	net	of	post‐production	costs.		
2	Does	not	include	natural	gas	liquids	(NGLs).	
2015	 187,712	 4,592,900	 	 0.59	 	 2,709,800	 				6.9%
Independent	Fiscal	Of ice						July	2016 	 	 									 									4	
 
production	and	begin	paying	the	fee	for	CY	2016. 	
1.	 The	 Current	 Trends	 scenario	 assumes	 that	 the	
number	of	new	wells	spud	in	the	second	half	of	
2016	 declines	 by	 60	 percent	 compared	 to	 the	
same	period	in	the	prior	year,	consistent	with	the	
trend	 observed	 in	 the	 first	 half.	 This	 yields	 a	
calendar	 year	 total	 of	 329	 new	 wells,	 and	
represents	a	$15.2	million	reduction	in	impact	fee	
collections	under	the	current	fee	schedule.	
2.	 The	 Drilling	 Pick‐Up	 scenario	 assumes	 that	 the	
number	of	new	wells	spud	in	the	second	half	of	
2016	 is	 the	 same	 as	 the	 number	 spud	 in	 the	
second	half	of	2015.	This	yields	a	calendar	year	
total	 of	 547	 new	 wells	 (a	 30	 percent	 reduction	
from	 the	 prior	 year),	 and	 represents	 a	 $5.4	
million	reduction	in	impact	fee	collections	under	
the	current	fee	schedule.	
3.	 The	 Fee	 Reduction	 scenario	 assumes	 (1)	 an	
average	NYMEX	price	that	is	less	than	$2.25	per	
MMBtu	 and	 the	 associated	 reduction	 in	 the	 fee	
schedule	and	(2)	the	number	of	new	wells	spud	
follows	 current	 trends.	 This	 scenario	
demonstrates	that	CY	2016	impact	fee	revenues	
will	 decline	 substantially	 if	 the	 fee	 schedule	 is	
further	reduced	due	to	the	low	NYMEX	price.	This	
scenario	 yields	 a	 $56.5	 million	 reduction	 in	
impact	fee	collections.		
Impact	 fee	 collections	 decline	 under	 all	 three	
scenarios.	 The	 largest	 decline	 occurs	 under	 the	
scenario	 in	 which	 a	 fee	 schedule	 reduction	 takes	
place,	 and	 smaller	 declines	 occur	 in	 the	 other	
scenarios	based	on	new	well	assumptions	for	2016.	
An	additional	120	new	wells	beyond	those	included	
in	 the	 Drilling	 Pick‐Up	 scenario	 would	 need	 to	 be	
spud	 in	 the	 last	 six	 months	 of	 2016	 in	 order	 to	
maintain	collections	at	the	CY	2015	level.		
In	the	long	term,	new	pipeline	capacity	may	be	built	
to	connect	gas	production	to	major	demand	markets	
in	other	states.	This	would	allow	regional	prices	and	
producers’	 revenues	 to	 rebound.	 As	 a	 result,	 the	
drilling	of	new	wells	could	increase,	and	if	so,	impact	
fee	collections	would	rise	accordingly.	
Industry	 analysts	 are	 unsure	 when	 this	 anticipated	
price	inflation	will	occur.	Analysts	had	expected	that	
additional	 pipeline	 capacity	 would	 be	 completed	 by	
2018.	 However,	 several	 large	 projects	 have	 been	
delayed	 or	 cancelled.	 Currently,	 the	 NYMEX	 futures	
market	 suggests	 that	 the	 price	 will	 reach	 $3.00/
MMBtu	in	2017	and	remain	near	that	level	until	2021.	
Forecasts	 from	 Bentek	 Energy	 show	 regional	 hub	
prices	 will	 maintain	 their	 significant	 differential	
below	 the	 NYMEX	 through	 that	 time,	 so	 the	 current	
low‐price	 environment	 is	 likely	 to	 continue.	 If	 these	
conditions	 hold,	 then	 drilling	 activity	 will	 likely	
remain	 subdued	 through	 2018,	 and	 impact	 fee	
revenues	will	have	limited	opportunity	for	growth.	
Table	4:	CY	2016	Impact	Fee	Revenue	Scenarios 
	 Current	Trends	 Drilling	Pick‐Up	 Fee	Reduction	
	 Total	Revenues	 	 $170,600	 	 $180,400	 	 $129,300	
	 Difference	from	2015	 	 ‐15,200	 	 ‐5,400	 	 ‐56,500	
	 		Lower	Fee	Schedule	 	 0	 	 0	 	 ‐41,300	
	 		New	and	Existing	Wells1	 	 ‐15,200	 	 ‐5,400	 	 ‐15,200	
Notes:	Dollar	amounts	in	thousands.	Excludes	late	or	disputed	payments	from	prior	years.	
Source:	Well	counts	estimated	using	data	from	the	Public	Utility	Commission.	
1	Re lects	change	in	revenues	from	(1)	more	wells	subject	to	impact	fee	(new	wells	plus	non‐producing	wells	brought	into	
production	less	new	stripper	wells)	and	(2)	existing	wells	aging	and	migrating	down	the	fee	schedule.
Independent	Fiscal	Of ice						July	2016 	 	 									 									5	


Rachel	Carson	State	Of ice	Building,	2nd	Floor	
400	Market	Street	
Harrisburg,	PA	17105	
E‐mail:	contact@ifo.state.pa.us	
Website:	www.ifo.state.pa.us	
	
Staff	Acknowledgements:		
Neil	Bakshi	and	Matt	Lindsay	
Independent	Fiscal	Of ice	
Endnotes	
1.	 The	Pennsylvania	Public	Utility	Commission	administers	the	impact	fee	and	provides	data	on	impact	fee	assessments	and	
actual	collections.	This	was	cross‐referenced	with	unconventional	well	production	data	and	spud	data	published	monthly	
by	the	Department	of	Environmental	Protection.	
2.	 The	fee	schedule	is	adjusted	downward	if	the	price	of	gas	falls	below	$3.00	and	downward	again	if	it	falls	below	$2.25.	
See	58	Pa.C.S.	§	2302(b)	for	the	statutory	adjustments	and	46	Pa.B.	632	for	the	current	fee	schedule.	Pursuant	to	58	
Pa.C.S.	 §	 2301,	the	 price	 used	 is	 the	 annual	 average	 of	 the	 settled	 prices	 for	 near‐month	 contracts	 on	 the	 New	 York	
Mercantile	Exchange	(NYMEX)	in	million	British	thermal	units	(MMBtu).	This	is	the	national	benchmark	price	for	the	sale	
of	natural	gas.	Other	regional	hubs	exist	in	Pennsylvania,	e.g.,	Dominion	South	and	Leidy,	which	are	used	in	Table	3	to	
approximate	the	prices	received	by	producers.		
3.	 An	alternative	to	the	annual	average	ETR	is	the	lifetime	ETR,	which	is	the	average	rate	over	the	lifetime	of	a	single	new	
well;	this	measure	is	best	used	to	quantify	the	prospective	tax	burden	on	new	wells	across	states.	(See	the	IFO’s	previous	
publication,	Natural	Gas	Extraction:	An	Interstate	Tax	Comparison,	for	an	analysis	using	the	lifetime	ETR.)	
4.	 Conversion	 of	 units	 from	 dollars	 per	 MMBtu	 into	 dollars	 per	 thousand	 cubic	 feet	 (Mcf)	 was	 calculated	 using	 the	
Pennsylvania‐speci ic	 heat	 content	 of	 natural	 gas,	 as	 published	 by	 the	 U.S.	 Energy	 Information	 Administration.	 Post‐
production	cost	estimates	are	from	a	Range	Resources	investor	presentation,	March	31,	2016.	These	costs	were	adjusted	
by	 the	 IFO	 based	 on	 the	 proportion	 of	 wet	 and	 dry	 gas	 produced	 in	 Pennsylvania	 in	 2015.	 “Wet”	 gas	 from	 the	
southwestern	portion	of	the	state	incurs	higher	processing	costs	to	separate	natural	gas	liquids.	Therefore,	the	post‐
production	costs	deducted	from	the	price	are	a	weighted	average	of	$1.48	per	Mcf	for	wet	gas	and	$0.78	per	Mcf	for	dry	
gas.	
5.	 This	price	is	different	from	that	used	in	prior	research	briefs	on	the	impact	fee,	which	relied	exclusively	on	the	Dominion	
South	hub.	Changes	in	the	industry	and	availability	of	trading	information	have	made	this	weighted	price	appropriate.	In	
addition	to	spot	trading,	producers	also	hedge	prices	for	a	large	share	of	their	production,	using	futures	contracts	and	
other	more	complex	instruments.	These	strategies	may	yield	a	higher	average	price	than	the	daily	spot	price.	
6.	 See	 the	 IFO’s	 publication,	 Natural	Gas	Production	Report:	First	Quarter	2016	 for	 a	 summary	 of	 DEP	 data	 on	 production	
and	wells	drilled.	These	data	do	not	directly	correlate	to	data	published	by	the	PUC.	Both	are	submitted	to	the	agencies	
by	operators.	
7.	 According	to	DEP	data,	the	number	of	wells	spud	from	January	to	June	was	421	in	2015,	and	183	in	2016.	
8.	 Exclusive	of	any	change	in	the	fee	schedule	due	to	price.	
Data	Sources	
 Statewide	production	data	and	spud	well	counts	can	be	found	at	https://www.paoilandgasreporting.state.pa.us/
publicreports/Modules/Welcome/Welcome.aspx.	
 Act	13	impact	fee	revenues	and	distributions	can	be	found	at		http://www.puc.state.pa.us/ iling_resources/
issues_laws_regulations/act_13_impact_fee_.aspx.	
 Natural	gas	price	forecast	data	are	from	BENTEK	Energy	and	can	be	found	at	http://www.bentekenergy.com/index.aspx.

Mais conteúdo relacionado

Mais procurados

Apresentação de resultados 1 t15 master_inglês_v3
Apresentação de resultados 1 t15 master_inglês_v3Apresentação de resultados 1 t15 master_inglês_v3
Apresentação de resultados 1 t15 master_inglês_v3CPFL RI
 
Financial projections budget outlook
Financial projections budget outlook   Financial projections budget outlook
Financial projections budget outlook Ryan Smith
 
Fact Sheet Snam
Fact Sheet SnamFact Sheet Snam
Fact Sheet SnamSnam
 
Pennsylvania Gas Outlook Report - June 2015
Pennsylvania Gas Outlook Report - June 2015Pennsylvania Gas Outlook Report - June 2015
Pennsylvania Gas Outlook Report - June 2015Marcellus Drilling News
 
2020 Interim Results
2020 Interim Results2020 Interim Results
2020 Interim ResultsSnam
 
Q3 report 2015 for Vattenfall
Q3 report 2015 for VattenfallQ3 report 2015 for Vattenfall
Q3 report 2015 for VattenfallVattenfall
 
Gas Price Hike Impact Analysis_final
Gas Price Hike Impact Analysis_finalGas Price Hike Impact Analysis_final
Gas Price Hike Impact Analysis_finalPranav Awasthi, CFA
 
Q3 report 2016 for Vattenfall
Q3 report 2016 for VattenfallQ3 report 2016 for Vattenfall
Q3 report 2016 for VattenfallVattenfall
 
Trc q4 2016 earnings slides final
Trc q4 2016 earnings slides finalTrc q4 2016 earnings slides final
Trc q4 2016 earnings slides finaltrcsolutions
 
Q3 presentation 2015 for Vattenfall
Q3 presentation 2015 for VattenfallQ3 presentation 2015 for Vattenfall
Q3 presentation 2015 for VattenfallVattenfall
 
Enea 2017 Q1 - financial results (english)
Enea 2017 Q1 - financial results (english)Enea 2017 Q1 - financial results (english)
Enea 2017 Q1 - financial results (english)Enea
 
California Air Quality in 2019: What You Need to Know
California Air Quality in 2019: What You Need to KnowCalifornia Air Quality in 2019: What You Need to Know
California Air Quality in 2019: What You Need to KnowBlueScape
 
Obama Climate Action Plan to Reduce Methane
Obama Climate Action Plan to Reduce MethaneObama Climate Action Plan to Reduce Methane
Obama Climate Action Plan to Reduce MethaneMarcellus Drilling News
 
Vattenfall's Q2 and first half year results 2015
Vattenfall's Q2 and first half year results 2015Vattenfall's Q2 and first half year results 2015
Vattenfall's Q2 and first half year results 2015Vattenfall
 
Trc q3 2016 earnings slides final
Trc q3 2016 earnings slides finalTrc q3 2016 earnings slides final
Trc q3 2016 earnings slides finaltrcsolutions
 
Teekay Corporation Q2-2019 Earnings Presentation
Teekay Corporation Q2-2019 Earnings PresentationTeekay Corporation Q2-2019 Earnings Presentation
Teekay Corporation Q2-2019 Earnings PresentationTeekay Corporation
 
Capital Power March 2016 Investor Presentation
Capital Power March 2016 Investor PresentationCapital Power March 2016 Investor Presentation
Capital Power March 2016 Investor PresentationCapital Power
 

Mais procurados (19)

Apresentação de resultados 1 t15 master_inglês_v3
Apresentação de resultados 1 t15 master_inglês_v3Apresentação de resultados 1 t15 master_inglês_v3
Apresentação de resultados 1 t15 master_inglês_v3
 
Financial projections budget outlook
Financial projections budget outlook   Financial projections budget outlook
Financial projections budget outlook
 
Fact Sheet Snam
Fact Sheet SnamFact Sheet Snam
Fact Sheet Snam
 
Pennsylvania Gas Outlook Report - June 2015
Pennsylvania Gas Outlook Report - June 2015Pennsylvania Gas Outlook Report - June 2015
Pennsylvania Gas Outlook Report - June 2015
 
2020 Interim Results
2020 Interim Results2020 Interim Results
2020 Interim Results
 
Q3 report 2015 for Vattenfall
Q3 report 2015 for VattenfallQ3 report 2015 for Vattenfall
Q3 report 2015 for Vattenfall
 
Gas Price Hike Impact Analysis_final
Gas Price Hike Impact Analysis_finalGas Price Hike Impact Analysis_final
Gas Price Hike Impact Analysis_final
 
Q3 report 2016 for Vattenfall
Q3 report 2016 for VattenfallQ3 report 2016 for Vattenfall
Q3 report 2016 for Vattenfall
 
Trc q4 2016 earnings slides final
Trc q4 2016 earnings slides finalTrc q4 2016 earnings slides final
Trc q4 2016 earnings slides final
 
Q3 presentation 2015 for Vattenfall
Q3 presentation 2015 for VattenfallQ3 presentation 2015 for Vattenfall
Q3 presentation 2015 for Vattenfall
 
PDD for GTCC
PDD for GTCCPDD for GTCC
PDD for GTCC
 
Enea 2017 Q1 - financial results (english)
Enea 2017 Q1 - financial results (english)Enea 2017 Q1 - financial results (english)
Enea 2017 Q1 - financial results (english)
 
California Air Quality in 2019: What You Need to Know
California Air Quality in 2019: What You Need to KnowCalifornia Air Quality in 2019: What You Need to Know
California Air Quality in 2019: What You Need to Know
 
Obama Climate Action Plan to Reduce Methane
Obama Climate Action Plan to Reduce MethaneObama Climate Action Plan to Reduce Methane
Obama Climate Action Plan to Reduce Methane
 
Vattenfall's Q2 and first half year results 2015
Vattenfall's Q2 and first half year results 2015Vattenfall's Q2 and first half year results 2015
Vattenfall's Q2 and first half year results 2015
 
Pat rules english
Pat rules englishPat rules english
Pat rules english
 
Trc q3 2016 earnings slides final
Trc q3 2016 earnings slides finalTrc q3 2016 earnings slides final
Trc q3 2016 earnings slides final
 
Teekay Corporation Q2-2019 Earnings Presentation
Teekay Corporation Q2-2019 Earnings PresentationTeekay Corporation Q2-2019 Earnings Presentation
Teekay Corporation Q2-2019 Earnings Presentation
 
Capital Power March 2016 Investor Presentation
Capital Power March 2016 Investor PresentationCapital Power March 2016 Investor Presentation
Capital Power March 2016 Investor Presentation
 

Destaque (17)

Que Es Un Wiker
Que Es Un WikerQue Es Un Wiker
Que Es Un Wiker
 
computer education
computer educationcomputer education
computer education
 
Articol 9
Articol 9Articol 9
Articol 9
 
Question 3
Question 3Question 3
Question 3
 
Presentación
PresentaciónPresentación
Presentación
 
Fire music
Fire musicFire music
Fire music
 
articol 9
articol 9articol 9
articol 9
 
Ace symposium 2013
Ace symposium 2013Ace symposium 2013
Ace symposium 2013
 
A. cover laporan ppl
A. cover laporan pplA. cover laporan ppl
A. cover laporan ppl
 
Effective Networking For Employment
Effective Networking For EmploymentEffective Networking For Employment
Effective Networking For Employment
 
Slide
Slide Slide
Slide
 
Paula
PaulaPaula
Paula
 
Semantical Cognitive Scheduling
Semantical Cognitive SchedulingSemantical Cognitive Scheduling
Semantical Cognitive Scheduling
 
Multi agent paradigm for cognitive parameter based feature similarity for soc...
Multi agent paradigm for cognitive parameter based feature similarity for soc...Multi agent paradigm for cognitive parameter based feature similarity for soc...
Multi agent paradigm for cognitive parameter based feature similarity for soc...
 
Bbh'da pnömoni
Bbh'da pnömoniBbh'da pnömoni
Bbh'da pnömoni
 
Digital Tattoo for Teacher Candidates at UBC
Digital Tattoo for Teacher Candidates at UBC Digital Tattoo for Teacher Candidates at UBC
Digital Tattoo for Teacher Candidates at UBC
 
Cognitive assistance at work
Cognitive assistance at workCognitive assistance at work
Cognitive assistance at work
 

Semelhante a IFO Report: Impact Fee Update and 2016 Outlook

PA Independent Fiscal Office Research Brief on Marcellus Taxation
PA Independent Fiscal Office Research Brief on Marcellus TaxationPA Independent Fiscal Office Research Brief on Marcellus Taxation
PA Independent Fiscal Office Research Brief on Marcellus TaxationMarcellus Drilling News
 
Capital Power 2016 BMO Capital Markets Infrastructure & Utilities conference ...
Capital Power 2016 BMO Capital Markets Infrastructure & Utilities conference ...Capital Power 2016 BMO Capital Markets Infrastructure & Utilities conference ...
Capital Power 2016 BMO Capital Markets Infrastructure & Utilities conference ...Capital Power
 
Research: Welfare and Distributional Implications of Shale Gas
Research: Welfare and Distributional Implications of Shale GasResearch: Welfare and Distributional Implications of Shale Gas
Research: Welfare and Distributional Implications of Shale GasMarcellus Drilling News
 
Ernst & Young Analysis of Ohio Severance Tax Proposal - April 2014
Ernst & Young Analysis of Ohio Severance Tax Proposal - April 2014Ernst & Young Analysis of Ohio Severance Tax Proposal - April 2014
Ernst & Young Analysis of Ohio Severance Tax Proposal - April 2014Marcellus Drilling News
 
U.S. Midstream and Downstream Services Market Update
U.S. Midstream and Downstream Services Market UpdateU.S. Midstream and Downstream Services Market Update
U.S. Midstream and Downstream Services Market UpdateCapstone Headwaters
 
רבעון 4 2015 - נובל אנרג'י
רבעון 4 2015 - נובל אנרג'ירבעון 4 2015 - נובל אנרג'י
רבעון 4 2015 - נובל אנרג'יesty segal
 
11-2015 Jefferies Energy Conference
11-2015 Jefferies Energy Conference11-2015 Jefferies Energy Conference
11-2015 Jefferies Energy ConferenceAndrew Ziola
 
NGSA Report: Outlook for Natural Gas Demand for the Summer of 2016
NGSA Report: Outlook for Natural Gas Demand for the Summer of 2016NGSA Report: Outlook for Natural Gas Demand for the Summer of 2016
NGSA Report: Outlook for Natural Gas Demand for the Summer of 2016Marcellus Drilling News
 
National Fuel/Seneca Resources FY 2Q13 Financial & Operational Update
National Fuel/Seneca Resources FY 2Q13 Financial & Operational UpdateNational Fuel/Seneca Resources FY 2Q13 Financial & Operational Update
National Fuel/Seneca Resources FY 2Q13 Financial & Operational UpdateMarcellus Drilling News
 
Cabot Oil & Gas Presentation - March 21, 2016
Cabot Oil & Gas Presentation - March 21, 2016Cabot Oil & Gas Presentation - March 21, 2016
Cabot Oil & Gas Presentation - March 21, 2016Marcellus Drilling News
 
Cabot Oil & Gas 3Q16 Earnings Call - Oct 28, 2016
Cabot Oil & Gas 3Q16 Earnings Call - Oct 28, 2016Cabot Oil & Gas 3Q16 Earnings Call - Oct 28, 2016
Cabot Oil & Gas 3Q16 Earnings Call - Oct 28, 2016Marcellus Drilling News
 
News ReleaseINVESTOR CONTACT MEDIA CONTACT CHESAPEAKE .docx
News ReleaseINVESTOR CONTACT MEDIA CONTACT   CHESAPEAKE .docxNews ReleaseINVESTOR CONTACT MEDIA CONTACT   CHESAPEAKE .docx
News ReleaseINVESTOR CONTACT MEDIA CONTACT CHESAPEAKE .docxhenrymartin15260
 
Alliant Energy Corporation Writeup
Alliant Energy Corporation WriteupAlliant Energy Corporation Writeup
Alliant Energy Corporation WriteupDavid Cheske
 
Teekay Tankers Q1-2016 Earnings Presentation
Teekay Tankers Q1-2016 Earnings PresentationTeekay Tankers Q1-2016 Earnings Presentation
Teekay Tankers Q1-2016 Earnings PresentationTeekay Tankers Ltd
 
Energy Bulletin - PA's New Strategy for Methane Reduction
Energy Bulletin - PA's New Strategy for Methane ReductionEnergy Bulletin - PA's New Strategy for Methane Reduction
Energy Bulletin - PA's New Strategy for Methane ReductionCohenGrigsby
 
Barclays conference presentation (website) september 2016 v5
Barclays conference presentation (website)   september 2016 v5Barclays conference presentation (website)   september 2016 v5
Barclays conference presentation (website) september 2016 v5AnteroResources
 
Oil field bids in Mexico: Round 1.3. “Onshore Fields”. Commerciality evaluati...
Oil field bids in Mexico: Round 1.3. “Onshore Fields”. Commerciality evaluati...Oil field bids in Mexico: Round 1.3. “Onshore Fields”. Commerciality evaluati...
Oil field bids in Mexico: Round 1.3. “Onshore Fields”. Commerciality evaluati...Juan Diego Suarez Fromm
 
Company Overview November 2014
Company Overview November 2014Company Overview November 2014
Company Overview November 2014AnteroResources
 

Semelhante a IFO Report: Impact Fee Update and 2016 Outlook (20)

PA Independent Fiscal Office Research Brief on Marcellus Taxation
PA Independent Fiscal Office Research Brief on Marcellus TaxationPA Independent Fiscal Office Research Brief on Marcellus Taxation
PA Independent Fiscal Office Research Brief on Marcellus Taxation
 
Capital Power 2016 BMO Capital Markets Infrastructure & Utilities conference ...
Capital Power 2016 BMO Capital Markets Infrastructure & Utilities conference ...Capital Power 2016 BMO Capital Markets Infrastructure & Utilities conference ...
Capital Power 2016 BMO Capital Markets Infrastructure & Utilities conference ...
 
Research: Welfare and Distributional Implications of Shale Gas
Research: Welfare and Distributional Implications of Shale GasResearch: Welfare and Distributional Implications of Shale Gas
Research: Welfare and Distributional Implications of Shale Gas
 
Ernst & Young Analysis of Ohio Severance Tax Proposal - April 2014
Ernst & Young Analysis of Ohio Severance Tax Proposal - April 2014Ernst & Young Analysis of Ohio Severance Tax Proposal - April 2014
Ernst & Young Analysis of Ohio Severance Tax Proposal - April 2014
 
U.S. Midstream and Downstream Services Market Update
U.S. Midstream and Downstream Services Market UpdateU.S. Midstream and Downstream Services Market Update
U.S. Midstream and Downstream Services Market Update
 
רבעון 4 2015 - נובל אנרג'י
רבעון 4 2015 - נובל אנרג'ירבעון 4 2015 - נובל אנרג'י
רבעון 4 2015 - נובל אנרג'י
 
11-2015 Jefferies Energy Conference
11-2015 Jefferies Energy Conference11-2015 Jefferies Energy Conference
11-2015 Jefferies Energy Conference
 
NGSA Report: Outlook for Natural Gas Demand for the Summer of 2016
NGSA Report: Outlook for Natural Gas Demand for the Summer of 2016NGSA Report: Outlook for Natural Gas Demand for the Summer of 2016
NGSA Report: Outlook for Natural Gas Demand for the Summer of 2016
 
National Fuel/Seneca Resources FY 2Q13 Financial & Operational Update
National Fuel/Seneca Resources FY 2Q13 Financial & Operational UpdateNational Fuel/Seneca Resources FY 2Q13 Financial & Operational Update
National Fuel/Seneca Resources FY 2Q13 Financial & Operational Update
 
Cabot Oil & Gas Presentation - March 21, 2016
Cabot Oil & Gas Presentation - March 21, 2016Cabot Oil & Gas Presentation - March 21, 2016
Cabot Oil & Gas Presentation - March 21, 2016
 
Cabot Oil & Gas 3Q16 Earnings Call - Oct 28, 2016
Cabot Oil & Gas 3Q16 Earnings Call - Oct 28, 2016Cabot Oil & Gas 3Q16 Earnings Call - Oct 28, 2016
Cabot Oil & Gas 3Q16 Earnings Call - Oct 28, 2016
 
News ReleaseINVESTOR CONTACT MEDIA CONTACT CHESAPEAKE .docx
News ReleaseINVESTOR CONTACT MEDIA CONTACT   CHESAPEAKE .docxNews ReleaseINVESTOR CONTACT MEDIA CONTACT   CHESAPEAKE .docx
News ReleaseINVESTOR CONTACT MEDIA CONTACT CHESAPEAKE .docx
 
Alliant Energy Corporation Writeup
Alliant Energy Corporation WriteupAlliant Energy Corporation Writeup
Alliant Energy Corporation Writeup
 
Teekay Tankers Q1-2016 Earnings Presentation
Teekay Tankers Q1-2016 Earnings PresentationTeekay Tankers Q1-2016 Earnings Presentation
Teekay Tankers Q1-2016 Earnings Presentation
 
Energy Bulletin - PA's New Strategy for Methane Reduction
Energy Bulletin - PA's New Strategy for Methane ReductionEnergy Bulletin - PA's New Strategy for Methane Reduction
Energy Bulletin - PA's New Strategy for Methane Reduction
 
Barclays conference presentation (website) september 2016 v5
Barclays conference presentation (website)   september 2016 v5Barclays conference presentation (website)   september 2016 v5
Barclays conference presentation (website) september 2016 v5
 
Oil field bids in Mexico: Round 1.3. “Onshore Fields”. Commerciality evaluati...
Oil field bids in Mexico: Round 1.3. “Onshore Fields”. Commerciality evaluati...Oil field bids in Mexico: Round 1.3. “Onshore Fields”. Commerciality evaluati...
Oil field bids in Mexico: Round 1.3. “Onshore Fields”. Commerciality evaluati...
 
FERC 2015 State of the Markets Report
FERC 2015 State of the Markets ReportFERC 2015 State of the Markets Report
FERC 2015 State of the Markets Report
 
Company Overview November 2014
Company Overview November 2014Company Overview November 2014
Company Overview November 2014
 
Krause Fund
Krause FundKrause Fund
Krause Fund
 

Mais de Marcellus Drilling News

Five facts about shale: it’s coming back, and coming back strong
Five facts about shale: it’s coming back, and coming back strongFive facts about shale: it’s coming back, and coming back strong
Five facts about shale: it’s coming back, and coming back strongMarcellus Drilling News
 
Quarterly legislative action update: Marcellus and Utica shale region (4Q16)
Quarterly legislative action update: Marcellus and Utica shale region (4Q16)Quarterly legislative action update: Marcellus and Utica shale region (4Q16)
Quarterly legislative action update: Marcellus and Utica shale region (4Q16)Marcellus Drilling News
 
Access Northeast Pipeline Project - Dec 2016 Update
Access Northeast Pipeline Project - Dec 2016 UpdateAccess Northeast Pipeline Project - Dec 2016 Update
Access Northeast Pipeline Project - Dec 2016 UpdateMarcellus Drilling News
 
Rover Pipeline Letter to FERC Requesting Final Certificate
Rover Pipeline Letter to FERC Requesting Final CertificateRover Pipeline Letter to FERC Requesting Final Certificate
Rover Pipeline Letter to FERC Requesting Final CertificateMarcellus Drilling News
 
DOE Order Granting Elba Island LNG Right to Export to Non-FTA Countries
DOE Order Granting Elba Island LNG Right to Export to Non-FTA CountriesDOE Order Granting Elba Island LNG Right to Export to Non-FTA Countries
DOE Order Granting Elba Island LNG Right to Export to Non-FTA CountriesMarcellus Drilling News
 
LSE Study: Fracking is Revitalizing U.S. Manufacturing
LSE Study: Fracking is Revitalizing U.S. ManufacturingLSE Study: Fracking is Revitalizing U.S. Manufacturing
LSE Study: Fracking is Revitalizing U.S. ManufacturingMarcellus Drilling News
 
Letter From 24 States Asking Trump & Congress to Withdraw the Unlawful Clean ...
Letter From 24 States Asking Trump & Congress to Withdraw the Unlawful Clean ...Letter From 24 States Asking Trump & Congress to Withdraw the Unlawful Clean ...
Letter From 24 States Asking Trump & Congress to Withdraw the Unlawful Clean ...Marcellus Drilling News
 
Report: New U.S. Power Costs: by County, with Environmental Externalities
Report: New U.S. Power Costs: by County, with Environmental ExternalitiesReport: New U.S. Power Costs: by County, with Environmental Externalities
Report: New U.S. Power Costs: by County, with Environmental ExternalitiesMarcellus Drilling News
 
U.S. Crude Oil and Natural Gas Proved Reserves, Year-end 2015
U.S. Crude Oil and Natural Gas Proved Reserves, Year-end 2015U.S. Crude Oil and Natural Gas Proved Reserves, Year-end 2015
U.S. Crude Oil and Natural Gas Proved Reserves, Year-end 2015Marcellus Drilling News
 
U.S. EIA's Drilling Productivity Report - December 2015
U.S. EIA's Drilling Productivity Report - December 2015U.S. EIA's Drilling Productivity Report - December 2015
U.S. EIA's Drilling Productivity Report - December 2015Marcellus Drilling News
 
Velocys Plan to "Build the Business" - Gas-to-Liquids Plants
Velocys Plan to "Build the Business" - Gas-to-Liquids PlantsVelocys Plan to "Build the Business" - Gas-to-Liquids Plants
Velocys Plan to "Build the Business" - Gas-to-Liquids PlantsMarcellus Drilling News
 
PA DEP Revised Permit for Natural Gas Compression Stations, Processing Plants...
PA DEP Revised Permit for Natural Gas Compression Stations, Processing Plants...PA DEP Revised Permit for Natural Gas Compression Stations, Processing Plants...
PA DEP Revised Permit for Natural Gas Compression Stations, Processing Plants...Marcellus Drilling News
 
PA DEP Permit for Unconventional NatGas Well Site Operations and Remote Piggi...
PA DEP Permit for Unconventional NatGas Well Site Operations and Remote Piggi...PA DEP Permit for Unconventional NatGas Well Site Operations and Remote Piggi...
PA DEP Permit for Unconventional NatGas Well Site Operations and Remote Piggi...Marcellus Drilling News
 
PA DEP: Methane Reduction Strategies for Natural Gas Operations
PA DEP: Methane Reduction Strategies for Natural Gas OperationsPA DEP: Methane Reduction Strategies for Natural Gas Operations
PA DEP: Methane Reduction Strategies for Natural Gas OperationsMarcellus Drilling News
 
US EIA's December 2016 Short-Term Energy Outlook
US EIA's December 2016 Short-Term Energy OutlookUS EIA's December 2016 Short-Term Energy Outlook
US EIA's December 2016 Short-Term Energy OutlookMarcellus Drilling News
 
Northeast Gas Association's 2016 Statistical Guide
Northeast Gas Association's 2016 Statistical GuideNortheast Gas Association's 2016 Statistical Guide
Northeast Gas Association's 2016 Statistical GuideMarcellus Drilling News
 
PA PUC Responses to Auditor General's Act 13 Impact Fee Audit
PA PUC Responses to Auditor General's Act 13 Impact Fee AuditPA PUC Responses to Auditor General's Act 13 Impact Fee Audit
PA PUC Responses to Auditor General's Act 13 Impact Fee AuditMarcellus Drilling News
 
Pennsylvania Public Utility Commission Act 13/Impact Fees Audit by PA Auditor...
Pennsylvania Public Utility Commission Act 13/Impact Fees Audit by PA Auditor...Pennsylvania Public Utility Commission Act 13/Impact Fees Audit by PA Auditor...
Pennsylvania Public Utility Commission Act 13/Impact Fees Audit by PA Auditor...Marcellus Drilling News
 
Clyde Mine Discharge/Tenmile Creek Water Quality Final Report
Clyde Mine Discharge/Tenmile Creek Water Quality Final ReportClyde Mine Discharge/Tenmile Creek Water Quality Final Report
Clyde Mine Discharge/Tenmile Creek Water Quality Final ReportMarcellus Drilling News
 
FERC Order Denying Stay of Kinder Morgan's Broad Run Expansion Project
FERC Order Denying Stay of Kinder Morgan's Broad Run Expansion ProjectFERC Order Denying Stay of Kinder Morgan's Broad Run Expansion Project
FERC Order Denying Stay of Kinder Morgan's Broad Run Expansion ProjectMarcellus Drilling News
 

Mais de Marcellus Drilling News (20)

Five facts about shale: it’s coming back, and coming back strong
Five facts about shale: it’s coming back, and coming back strongFive facts about shale: it’s coming back, and coming back strong
Five facts about shale: it’s coming back, and coming back strong
 
Quarterly legislative action update: Marcellus and Utica shale region (4Q16)
Quarterly legislative action update: Marcellus and Utica shale region (4Q16)Quarterly legislative action update: Marcellus and Utica shale region (4Q16)
Quarterly legislative action update: Marcellus and Utica shale region (4Q16)
 
Access Northeast Pipeline Project - Dec 2016 Update
Access Northeast Pipeline Project - Dec 2016 UpdateAccess Northeast Pipeline Project - Dec 2016 Update
Access Northeast Pipeline Project - Dec 2016 Update
 
Rover Pipeline Letter to FERC Requesting Final Certificate
Rover Pipeline Letter to FERC Requesting Final CertificateRover Pipeline Letter to FERC Requesting Final Certificate
Rover Pipeline Letter to FERC Requesting Final Certificate
 
DOE Order Granting Elba Island LNG Right to Export to Non-FTA Countries
DOE Order Granting Elba Island LNG Right to Export to Non-FTA CountriesDOE Order Granting Elba Island LNG Right to Export to Non-FTA Countries
DOE Order Granting Elba Island LNG Right to Export to Non-FTA Countries
 
LSE Study: Fracking is Revitalizing U.S. Manufacturing
LSE Study: Fracking is Revitalizing U.S. ManufacturingLSE Study: Fracking is Revitalizing U.S. Manufacturing
LSE Study: Fracking is Revitalizing U.S. Manufacturing
 
Letter From 24 States Asking Trump & Congress to Withdraw the Unlawful Clean ...
Letter From 24 States Asking Trump & Congress to Withdraw the Unlawful Clean ...Letter From 24 States Asking Trump & Congress to Withdraw the Unlawful Clean ...
Letter From 24 States Asking Trump & Congress to Withdraw the Unlawful Clean ...
 
Report: New U.S. Power Costs: by County, with Environmental Externalities
Report: New U.S. Power Costs: by County, with Environmental ExternalitiesReport: New U.S. Power Costs: by County, with Environmental Externalities
Report: New U.S. Power Costs: by County, with Environmental Externalities
 
U.S. Crude Oil and Natural Gas Proved Reserves, Year-end 2015
U.S. Crude Oil and Natural Gas Proved Reserves, Year-end 2015U.S. Crude Oil and Natural Gas Proved Reserves, Year-end 2015
U.S. Crude Oil and Natural Gas Proved Reserves, Year-end 2015
 
U.S. EIA's Drilling Productivity Report - December 2015
U.S. EIA's Drilling Productivity Report - December 2015U.S. EIA's Drilling Productivity Report - December 2015
U.S. EIA's Drilling Productivity Report - December 2015
 
Velocys Plan to "Build the Business" - Gas-to-Liquids Plants
Velocys Plan to "Build the Business" - Gas-to-Liquids PlantsVelocys Plan to "Build the Business" - Gas-to-Liquids Plants
Velocys Plan to "Build the Business" - Gas-to-Liquids Plants
 
PA DEP Revised Permit for Natural Gas Compression Stations, Processing Plants...
PA DEP Revised Permit for Natural Gas Compression Stations, Processing Plants...PA DEP Revised Permit for Natural Gas Compression Stations, Processing Plants...
PA DEP Revised Permit for Natural Gas Compression Stations, Processing Plants...
 
PA DEP Permit for Unconventional NatGas Well Site Operations and Remote Piggi...
PA DEP Permit for Unconventional NatGas Well Site Operations and Remote Piggi...PA DEP Permit for Unconventional NatGas Well Site Operations and Remote Piggi...
PA DEP Permit for Unconventional NatGas Well Site Operations and Remote Piggi...
 
PA DEP: Methane Reduction Strategies for Natural Gas Operations
PA DEP: Methane Reduction Strategies for Natural Gas OperationsPA DEP: Methane Reduction Strategies for Natural Gas Operations
PA DEP: Methane Reduction Strategies for Natural Gas Operations
 
US EIA's December 2016 Short-Term Energy Outlook
US EIA's December 2016 Short-Term Energy OutlookUS EIA's December 2016 Short-Term Energy Outlook
US EIA's December 2016 Short-Term Energy Outlook
 
Northeast Gas Association's 2016 Statistical Guide
Northeast Gas Association's 2016 Statistical GuideNortheast Gas Association's 2016 Statistical Guide
Northeast Gas Association's 2016 Statistical Guide
 
PA PUC Responses to Auditor General's Act 13 Impact Fee Audit
PA PUC Responses to Auditor General's Act 13 Impact Fee AuditPA PUC Responses to Auditor General's Act 13 Impact Fee Audit
PA PUC Responses to Auditor General's Act 13 Impact Fee Audit
 
Pennsylvania Public Utility Commission Act 13/Impact Fees Audit by PA Auditor...
Pennsylvania Public Utility Commission Act 13/Impact Fees Audit by PA Auditor...Pennsylvania Public Utility Commission Act 13/Impact Fees Audit by PA Auditor...
Pennsylvania Public Utility Commission Act 13/Impact Fees Audit by PA Auditor...
 
Clyde Mine Discharge/Tenmile Creek Water Quality Final Report
Clyde Mine Discharge/Tenmile Creek Water Quality Final ReportClyde Mine Discharge/Tenmile Creek Water Quality Final Report
Clyde Mine Discharge/Tenmile Creek Water Quality Final Report
 
FERC Order Denying Stay of Kinder Morgan's Broad Run Expansion Project
FERC Order Denying Stay of Kinder Morgan's Broad Run Expansion ProjectFERC Order Denying Stay of Kinder Morgan's Broad Run Expansion Project
FERC Order Denying Stay of Kinder Morgan's Broad Run Expansion Project
 

Último

BDSM⚡Call Girls in Sector 135 Noida Escorts >༒8448380779 Escort Service
BDSM⚡Call Girls in Sector 135 Noida Escorts >༒8448380779 Escort ServiceBDSM⚡Call Girls in Sector 135 Noida Escorts >༒8448380779 Escort Service
BDSM⚡Call Girls in Sector 135 Noida Escorts >༒8448380779 Escort ServiceDelhi Call girls
 
29042024_First India Newspaper Jaipur.pdf
29042024_First India Newspaper Jaipur.pdf29042024_First India Newspaper Jaipur.pdf
29042024_First India Newspaper Jaipur.pdfFIRST INDIA
 
Gujarat-SEBCs.pdf pfpkoopapriorjfperjreie
Gujarat-SEBCs.pdf pfpkoopapriorjfperjreieGujarat-SEBCs.pdf pfpkoopapriorjfperjreie
Gujarat-SEBCs.pdf pfpkoopapriorjfperjreiebhavenpr
 
How Europe Underdeveloped Africa_walter.pdf
How Europe Underdeveloped Africa_walter.pdfHow Europe Underdeveloped Africa_walter.pdf
How Europe Underdeveloped Africa_walter.pdfLorenzo Lemes
 
28042024_First India Newspaper Jaipur.pdf
28042024_First India Newspaper Jaipur.pdf28042024_First India Newspaper Jaipur.pdf
28042024_First India Newspaper Jaipur.pdfFIRST INDIA
 
BDSM⚡Call Girls in Indirapuram Escorts >༒8448380779 Escort Service
BDSM⚡Call Girls in Indirapuram Escorts >༒8448380779 Escort ServiceBDSM⚡Call Girls in Indirapuram Escorts >༒8448380779 Escort Service
BDSM⚡Call Girls in Indirapuram Escorts >༒8448380779 Escort ServiceDelhi Call girls
 
Enjoy Night⚡Call Girls Rajokri Delhi >༒8448380779 Escort Service
Enjoy Night⚡Call Girls Rajokri Delhi >༒8448380779 Escort ServiceEnjoy Night⚡Call Girls Rajokri Delhi >༒8448380779 Escort Service
Enjoy Night⚡Call Girls Rajokri Delhi >༒8448380779 Escort ServiceDelhi Call girls
 
Julius Randle's Injury Status: Surgery Not Off the Table
Julius Randle's Injury Status: Surgery Not Off the TableJulius Randle's Injury Status: Surgery Not Off the Table
Julius Randle's Injury Status: Surgery Not Off the Tableget joys
 
Nurturing Families, Empowering Lives: TDP's Vision for Family Welfare in Andh...
Nurturing Families, Empowering Lives: TDP's Vision for Family Welfare in Andh...Nurturing Families, Empowering Lives: TDP's Vision for Family Welfare in Andh...
Nurturing Families, Empowering Lives: TDP's Vision for Family Welfare in Andh...narsireddynannuri1
 
1971 war india pakistan bangladesh liberation.ppt
1971 war india pakistan bangladesh liberation.ppt1971 war india pakistan bangladesh liberation.ppt
1971 war india pakistan bangladesh liberation.pptsammehtumblr
 
KAHULUGAN AT KAHALAGAHAN NG GAWAING PANSIBIKO.pptx
KAHULUGAN AT KAHALAGAHAN NG GAWAING PANSIBIKO.pptxKAHULUGAN AT KAHALAGAHAN NG GAWAING PANSIBIKO.pptx
KAHULUGAN AT KAHALAGAHAN NG GAWAING PANSIBIKO.pptxjohnandrewcarlos
 
Embed-2 (1).pdfb[k[k[[k[kkkpkdpokkdpkopko
Embed-2 (1).pdfb[k[k[[k[kkkpkdpokkdpkopkoEmbed-2 (1).pdfb[k[k[[k[kkkpkdpokkdpkopko
Embed-2 (1).pdfb[k[k[[k[kkkpkdpokkdpkopkobhavenpr
 
WhatsApp 📞 8448380779 ✅Call Girls In Chaura Sector 22 ( Noida)
WhatsApp 📞 8448380779 ✅Call Girls In Chaura Sector 22 ( Noida)WhatsApp 📞 8448380779 ✅Call Girls In Chaura Sector 22 ( Noida)
WhatsApp 📞 8448380779 ✅Call Girls In Chaura Sector 22 ( Noida)Delhi Call girls
 
TDP As the Party of Hope For AP Youth Under N Chandrababu Naidu’s Leadership
TDP As the Party of Hope For AP Youth Under N Chandrababu Naidu’s LeadershipTDP As the Party of Hope For AP Youth Under N Chandrababu Naidu’s Leadership
TDP As the Party of Hope For AP Youth Under N Chandrababu Naidu’s Leadershipanjanibaddipudi1
 
Lorenzo D'Emidio_Lavoro sullaNorth Korea .pptx
Lorenzo D'Emidio_Lavoro sullaNorth Korea .pptxLorenzo D'Emidio_Lavoro sullaNorth Korea .pptx
Lorenzo D'Emidio_Lavoro sullaNorth Korea .pptxlorenzodemidio01
 
Minto-Morley Reforms 1909 (constitution).pptx
Minto-Morley Reforms 1909 (constitution).pptxMinto-Morley Reforms 1909 (constitution).pptx
Minto-Morley Reforms 1909 (constitution).pptxAwaiskhalid96
 
Embed-4.pdf lkdiinlajeklhndklheduhuekjdh
Embed-4.pdf lkdiinlajeklhndklheduhuekjdhEmbed-4.pdf lkdiinlajeklhndklheduhuekjdh
Embed-4.pdf lkdiinlajeklhndklheduhuekjdhbhavenpr
 
2024 04 03 AZ GOP LD4 Gen Meeting Minutes FINAL.docx
2024 04 03 AZ GOP LD4 Gen Meeting Minutes FINAL.docx2024 04 03 AZ GOP LD4 Gen Meeting Minutes FINAL.docx
2024 04 03 AZ GOP LD4 Gen Meeting Minutes FINAL.docxkfjstone13
 
2024 02 15 AZ GOP LD4 Gen Meeting Minutes_FINAL_20240228.docx
2024 02 15 AZ GOP LD4 Gen Meeting Minutes_FINAL_20240228.docx2024 02 15 AZ GOP LD4 Gen Meeting Minutes_FINAL_20240228.docx
2024 02 15 AZ GOP LD4 Gen Meeting Minutes_FINAL_20240228.docxkfjstone13
 
AI as Research Assistant: Upscaling Content Analysis to Identify Patterns of ...
AI as Research Assistant: Upscaling Content Analysis to Identify Patterns of ...AI as Research Assistant: Upscaling Content Analysis to Identify Patterns of ...
AI as Research Assistant: Upscaling Content Analysis to Identify Patterns of ...Axel Bruns
 

Último (20)

BDSM⚡Call Girls in Sector 135 Noida Escorts >༒8448380779 Escort Service
BDSM⚡Call Girls in Sector 135 Noida Escorts >༒8448380779 Escort ServiceBDSM⚡Call Girls in Sector 135 Noida Escorts >༒8448380779 Escort Service
BDSM⚡Call Girls in Sector 135 Noida Escorts >༒8448380779 Escort Service
 
29042024_First India Newspaper Jaipur.pdf
29042024_First India Newspaper Jaipur.pdf29042024_First India Newspaper Jaipur.pdf
29042024_First India Newspaper Jaipur.pdf
 
Gujarat-SEBCs.pdf pfpkoopapriorjfperjreie
Gujarat-SEBCs.pdf pfpkoopapriorjfperjreieGujarat-SEBCs.pdf pfpkoopapriorjfperjreie
Gujarat-SEBCs.pdf pfpkoopapriorjfperjreie
 
How Europe Underdeveloped Africa_walter.pdf
How Europe Underdeveloped Africa_walter.pdfHow Europe Underdeveloped Africa_walter.pdf
How Europe Underdeveloped Africa_walter.pdf
 
28042024_First India Newspaper Jaipur.pdf
28042024_First India Newspaper Jaipur.pdf28042024_First India Newspaper Jaipur.pdf
28042024_First India Newspaper Jaipur.pdf
 
BDSM⚡Call Girls in Indirapuram Escorts >༒8448380779 Escort Service
BDSM⚡Call Girls in Indirapuram Escorts >༒8448380779 Escort ServiceBDSM⚡Call Girls in Indirapuram Escorts >༒8448380779 Escort Service
BDSM⚡Call Girls in Indirapuram Escorts >༒8448380779 Escort Service
 
Enjoy Night⚡Call Girls Rajokri Delhi >༒8448380779 Escort Service
Enjoy Night⚡Call Girls Rajokri Delhi >༒8448380779 Escort ServiceEnjoy Night⚡Call Girls Rajokri Delhi >༒8448380779 Escort Service
Enjoy Night⚡Call Girls Rajokri Delhi >༒8448380779 Escort Service
 
Julius Randle's Injury Status: Surgery Not Off the Table
Julius Randle's Injury Status: Surgery Not Off the TableJulius Randle's Injury Status: Surgery Not Off the Table
Julius Randle's Injury Status: Surgery Not Off the Table
 
Nurturing Families, Empowering Lives: TDP's Vision for Family Welfare in Andh...
Nurturing Families, Empowering Lives: TDP's Vision for Family Welfare in Andh...Nurturing Families, Empowering Lives: TDP's Vision for Family Welfare in Andh...
Nurturing Families, Empowering Lives: TDP's Vision for Family Welfare in Andh...
 
1971 war india pakistan bangladesh liberation.ppt
1971 war india pakistan bangladesh liberation.ppt1971 war india pakistan bangladesh liberation.ppt
1971 war india pakistan bangladesh liberation.ppt
 
KAHULUGAN AT KAHALAGAHAN NG GAWAING PANSIBIKO.pptx
KAHULUGAN AT KAHALAGAHAN NG GAWAING PANSIBIKO.pptxKAHULUGAN AT KAHALAGAHAN NG GAWAING PANSIBIKO.pptx
KAHULUGAN AT KAHALAGAHAN NG GAWAING PANSIBIKO.pptx
 
Embed-2 (1).pdfb[k[k[[k[kkkpkdpokkdpkopko
Embed-2 (1).pdfb[k[k[[k[kkkpkdpokkdpkopkoEmbed-2 (1).pdfb[k[k[[k[kkkpkdpokkdpkopko
Embed-2 (1).pdfb[k[k[[k[kkkpkdpokkdpkopko
 
WhatsApp 📞 8448380779 ✅Call Girls In Chaura Sector 22 ( Noida)
WhatsApp 📞 8448380779 ✅Call Girls In Chaura Sector 22 ( Noida)WhatsApp 📞 8448380779 ✅Call Girls In Chaura Sector 22 ( Noida)
WhatsApp 📞 8448380779 ✅Call Girls In Chaura Sector 22 ( Noida)
 
TDP As the Party of Hope For AP Youth Under N Chandrababu Naidu’s Leadership
TDP As the Party of Hope For AP Youth Under N Chandrababu Naidu’s LeadershipTDP As the Party of Hope For AP Youth Under N Chandrababu Naidu’s Leadership
TDP As the Party of Hope For AP Youth Under N Chandrababu Naidu’s Leadership
 
Lorenzo D'Emidio_Lavoro sullaNorth Korea .pptx
Lorenzo D'Emidio_Lavoro sullaNorth Korea .pptxLorenzo D'Emidio_Lavoro sullaNorth Korea .pptx
Lorenzo D'Emidio_Lavoro sullaNorth Korea .pptx
 
Minto-Morley Reforms 1909 (constitution).pptx
Minto-Morley Reforms 1909 (constitution).pptxMinto-Morley Reforms 1909 (constitution).pptx
Minto-Morley Reforms 1909 (constitution).pptx
 
Embed-4.pdf lkdiinlajeklhndklheduhuekjdh
Embed-4.pdf lkdiinlajeklhndklheduhuekjdhEmbed-4.pdf lkdiinlajeklhndklheduhuekjdh
Embed-4.pdf lkdiinlajeklhndklheduhuekjdh
 
2024 04 03 AZ GOP LD4 Gen Meeting Minutes FINAL.docx
2024 04 03 AZ GOP LD4 Gen Meeting Minutes FINAL.docx2024 04 03 AZ GOP LD4 Gen Meeting Minutes FINAL.docx
2024 04 03 AZ GOP LD4 Gen Meeting Minutes FINAL.docx
 
2024 02 15 AZ GOP LD4 Gen Meeting Minutes_FINAL_20240228.docx
2024 02 15 AZ GOP LD4 Gen Meeting Minutes_FINAL_20240228.docx2024 02 15 AZ GOP LD4 Gen Meeting Minutes_FINAL_20240228.docx
2024 02 15 AZ GOP LD4 Gen Meeting Minutes_FINAL_20240228.docx
 
AI as Research Assistant: Upscaling Content Analysis to Identify Patterns of ...
AI as Research Assistant: Upscaling Content Analysis to Identify Patterns of ...AI as Research Assistant: Upscaling Content Analysis to Identify Patterns of ...
AI as Research Assistant: Upscaling Content Analysis to Identify Patterns of ...
 

IFO Report: Impact Fee Update and 2016 Outlook

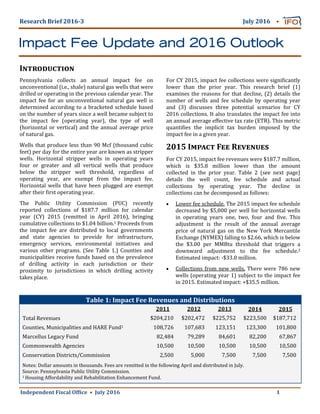
  • 1. Independent Fiscal Of ice July 2016 1 Research Brief 2016‐3 July 2016  Impact Fee Update and 2016 Outlook Pennsylvania collects an annual impact fee on unconventional (i.e., shale) natural gas wells that were drilled or operating in the previous calendar year. The impact fee for an unconventional natural gas well is determined according to a bracketed schedule based on the number of years since a well became subject to the impact fee (operating year), the type of well (horizontal or vertical) and the annual average price of natural gas. Wells that produce less than 90 Mcf (thousand cubic feet) per day for the entire year are known as stripper wells. Horizontal stripper wells in operating years four or greater and all vertical wells that produce below the stripper well threshold, regardless of operating year, are exempt from the impact fee. Horizontal wells that have been plugged are exempt after their irst operating year. The Public Utility Commission (PUC) recently reported collections of $187.7 million for calendar year (CY) 2015 (remitted in April 2016), bringing cumulative collections to $1.04 billion.1 Proceeds from the impact fee are distributed to local governments and state agencies to provide for infrastructure, emergency services, environmental initiatives and various other programs. (See Table 1.) Counties and municipalities receive funds based on the prevalence of drilling activity in each jurisdiction or their proximity to jurisdictions in which drilling activity takes place. I Table 1: Impact Fee Revenues and Distributions 2011 2012 2013 2014 2015 Total Revenues $204,210 $202,472 $225,752 $223,500 $187,712 Counties, Municipalities and HARE Fund1 108,726 107,683 123,151 123,300 101,800 Marcellus Legacy Fund 82,484 79,289 84,601 82,200 67,867 Commonwealth Agencies 10,500 10,500 10,500 10,500 10,500 Conservation Districts/Commission 2,500 5,000 7,500 7,500 7,500 Notes: Dollar amounts in thousands. Fees are remitted in the following April and distributed in July. Source: Pennsylvania Public Utility Commission. 1 Housing Affordability and Rehabilitation Enhancement Fund. For CY 2015, impact fee collections were signi icantly lower than the prior year. This research brief (1) examines the reasons for that decline, (2) details the number of wells and fee schedule by operating year and (3) discusses three potential scenarios for CY 2016 collections. It also translates the impact fee into an annual average effective tax rate (ETR). This metric quanti ies the implicit tax burden imposed by the impact fee in a given year.   2015 I F R For CY 2015, impact fee revenues were $187.7 million, which is $35.8 million lower than the amount collected in the prior year. Table 2 (see next page) details the well count, fee schedule and actual collections by operating year. The decline in collections can be decomposed as follows:  Lower fee schedule. The 2015 impact fee schedule decreased by $5,000 per well for horizontal wells in operating years one, two, four and five. This adjustment is the result of the annual average price of natural gas on the New York Mercantile Exchange (NYMEX) falling to $2.66, which is below the $3.00 per MMBtu threshold that triggers a downward adjustment to the fee schedule.2 Estimated impact: ‐$33.0 million.  Collections from new wells. There were 786 new wells (operating year 1) subject to the impact fee in 2015. Estimated impact: +$35.5 million.
  • 2. Independent Fiscal Of ice July 2016 2    Reduced collections from existing wells. Wells pay lower fees as they migrate down the fee schedule or become stripper wells. (See Table 2.) Estimated impact: ‐$38.3 million, including late and prior year disputed payments. The main driver of lower impact fee revenues was the price of natural gas. The dramatic decline in the average price (1) reduced the fee schedule for CY 2015 (the irst such occurrence) and (2) motivated irms to reduce the drilling of new wells. The 783 horizontal wells spud in 2015 (operating year 1) were less than the 1,339 horizontal wells spud in 2014 (currently operating year 2). An additional $25.2 million would have been collected for CY 2015 if the number of new wells had remained constant from 2014 to 2015. E T R The impact fee does not directly respond to the price of natural gas or the volume of production, and it does not provide a measure of tax burden relative to natural gas sales. Therefore, this research brief computes an annual average effective tax rate (ETR) for all wells in operation during the year.3 The ETR is equal to annual impact fee revenues divided by the total market value of unconventional natural gas production. The market value is equal to the product of (1) the annual average regional price of natural gas net of post‐production costs and (2) the total production from all unconventional wells.   Table 2: Well Count and Actual Collections for 2015  Operating Wells Subject to Fee Actual Year1  Horizontal Vertical Horizontal Vertical Collections 1 783 3 $45,300 $9,100 $35,497,200 2 1,339 7 35,200 7,000 47,181,800 3 1,176 12 30,200 6,000 35,587,200 4 1,114 10 15,100 3,000 16,851,400 5 3,335 95 15,100 3,000 50,643,500 Subtotal 7,747 127 185,761,100 Other Payments2 1,950,600 Total 7,747 127 187,711,700 Source: Pennsylvania Public Utility Commission. 1 Refers to the number of years a well has been subject to the impact fee. Horizontal wells are subject to the fee for the irst three years after being spud. Horizontal wells in other operating years and all vertical wells are subject to the fee if they pro‐ duce above the stripper well threshold. 2 Late payments or resolved disputed payments attributable to prior calendar years, remitted with 2015 collections. The wells remitting these payments are included in the well count above. Fee Amount The ETR computation for CY 2015 uses these data:  Annual production of 4.6 trillion cubic feet. This figure is based on statewide well production data published by the Department of Environmental Protection (DEP).  An annual average price of $1.43 per Mcf, prior to the deduction of post‐production costs.4 This price is a weighted average of spot prices at the Dominion South and Leidy trading hubs, converted to dollars per thousand cubic feet. 5  Post‐production costs of $0.84 per Mcf. This amount reflects costs for gathering, processing and transporting gas to markets. Such costs are deducted to approximate the value of gas at the wellhead, the point at which other states levy severance taxes. For CY 2015, the ETR is 6.9 percent, an increase of 4.5 percentage points from 2014. The annual average ETR for 2011 to 2014 declined in each successive year. (See Table 3.) The main cause of that trend was the dramatic increase in production over the time period. The 2015 increase is predominantly motivated by the sharp decline of natural gas prices (54.3 percent prior to the deduction of post‐production costs). N ‐P W New production from formerly non‐producing wells is a reason that unconventional gas production has increased despite a decline in the number of new wells drilled. There are two types of non‐producing wells
  • 3. Independent Fiscal Of ice July 2016 3   2016 O For CY 2016, two factors will have significant implications for impact fee revenues. They include: (1) The statutory fee schedule. The schedule is based on the average price of natural gas on the NYMEX. If that price falls below $2.25 per MMBtu for CY 2016, the impact fee schedule will decline by $5,000 per well (horizontal) compared to CY 2015 levels. For the first six months of 2016, the NYMEX price ranged from $1.71 to $2.92, with an average of $2.11. Bentek Energy forecasts that the price for the remainder of the year will average $2.73, for a calendar year average of $2.38. This level is close to the $2.25 threshold for a schedule adjustment. (2) The number of new wells. DEP spud data from January to June 2016 reveal an approximate 60 percent year‐over‐year decline in the number of new horizontal wells spud (no vertical wells have been spud in 2016 to date). Wells in their first year of operation pay the impact fee at the highest level. (See Table 2.) Revenues from new wells are important to total impact fee collections because they offset the decline in fees received from existing wells as they age. For example, a well spud in 2015 paid a fee of $45,300. That same well will pay a fee of $35,200 for CY 2016.8 Table 4 displays three potential scenarios for CY 2016 impact fee revenues. The scenarios differ based on the number of new wells spud in the second half of 2016 and whether or not a fee schedule reduction occurs. Each scenario contains the same assumptions for (1) the number of wells that attain stripper status for CY 2016 and become exempt and (2) the number of previously non‐producing wells that did not pay an impact fee for CY 2015, but which will be brought into that are relevant to this discussion: (1) “spud but not completed” wells that have been drilled but are not yet producing and (2) “shut in” wells that have produced natural gas but are currently dormant. These types of non‐producing wells generally can be brought into production at a lower cost than new drilling. In the current low‐price environment, operators have incentive to obtain production from non‐producing wells in lieu of drilling new wells. According to recent data released by DEP and analyzed by the IFO, the number of spud but not completed wells peaked at the end of 2014, and the number of shut‐in wells peaked in the second quarter of 2015.6 These data indicate that a number of formerly non‐producing wells recently have been placed into production. This trend corresponds with the decline in new wells spud over the same period.7 New production from non‐producing wells affects impact fee collections differently than newly‐drilled wells. Horizontal wells must pay the impact fee for the first three years after being spud, even if they do not produce. When brought into production, a formerly non‐producing well continues to be subject to the statutory fee schedule from the point it left off, which will be less than the fee paid on a newly‐ drilled well. If non‐producing wells are placed into production instead of drilling new wells, impact fee collections will be constrained, even if production holds steady or increases. Due to the reduction in the inventory of non‐producing wells, it is unclear how long producers can rely on those wells to supply further support for production. Table 3: Impact Fee Annual Effective Tax Rates  Calendar Year Impact Fee Unconventional Price of Market Annual Revenues Production (MMcf) Gas ($/Mcf)1 Value2 ETR 2011 $204,210 1,064,000 $3.40 $3,612,700 5.7% 2012 202,472 2,042,900 1.93 3,937,600 5.1% 2013 225,752 3,102,900 2.70 8,381,000 2.7% 2014 223,500 4,070,400 2.33 9,493,100 2.4% Notes: Dollar amounts in thousands. Mcf is thousand cubic feet. MMcf is million cubic feet. Sources: Pennsylvania Public Utility Commission, Department of Environmental Protection and Bentek Energy. 1 Weighted average spot price converted to dollars per Mcf using Pennsylvania heat content, net of post‐production costs. 2 Does not include natural gas liquids (NGLs). 2015 187,712 4,592,900 0.59 2,709,800 6.9%
  • 4. Independent Fiscal Of ice July 2016 4   production and begin paying the fee for CY 2016. 1. The Current Trends scenario assumes that the number of new wells spud in the second half of 2016 declines by 60 percent compared to the same period in the prior year, consistent with the trend observed in the first half. This yields a calendar year total of 329 new wells, and represents a $15.2 million reduction in impact fee collections under the current fee schedule. 2. The Drilling Pick‐Up scenario assumes that the number of new wells spud in the second half of 2016 is the same as the number spud in the second half of 2015. This yields a calendar year total of 547 new wells (a 30 percent reduction from the prior year), and represents a $5.4 million reduction in impact fee collections under the current fee schedule. 3. The Fee Reduction scenario assumes (1) an average NYMEX price that is less than $2.25 per MMBtu and the associated reduction in the fee schedule and (2) the number of new wells spud follows current trends. This scenario demonstrates that CY 2016 impact fee revenues will decline substantially if the fee schedule is further reduced due to the low NYMEX price. This scenario yields a $56.5 million reduction in impact fee collections. Impact fee collections decline under all three scenarios. The largest decline occurs under the scenario in which a fee schedule reduction takes place, and smaller declines occur in the other scenarios based on new well assumptions for 2016. An additional 120 new wells beyond those included in the Drilling Pick‐Up scenario would need to be spud in the last six months of 2016 in order to maintain collections at the CY 2015 level. In the long term, new pipeline capacity may be built to connect gas production to major demand markets in other states. This would allow regional prices and producers’ revenues to rebound. As a result, the drilling of new wells could increase, and if so, impact fee collections would rise accordingly. Industry analysts are unsure when this anticipated price inflation will occur. Analysts had expected that additional pipeline capacity would be completed by 2018. However, several large projects have been delayed or cancelled. Currently, the NYMEX futures market suggests that the price will reach $3.00/ MMBtu in 2017 and remain near that level until 2021. Forecasts from Bentek Energy show regional hub prices will maintain their significant differential below the NYMEX through that time, so the current low‐price environment is likely to continue. If these conditions hold, then drilling activity will likely remain subdued through 2018, and impact fee revenues will have limited opportunity for growth. Table 4: CY 2016 Impact Fee Revenue Scenarios  Current Trends Drilling Pick‐Up Fee Reduction Total Revenues $170,600 $180,400 $129,300 Difference from 2015 ‐15,200 ‐5,400 ‐56,500 Lower Fee Schedule 0 0 ‐41,300 New and Existing Wells1 ‐15,200 ‐5,400 ‐15,200 Notes: Dollar amounts in thousands. Excludes late or disputed payments from prior years. Source: Well counts estimated using data from the Public Utility Commission. 1 Re lects change in revenues from (1) more wells subject to impact fee (new wells plus non‐producing wells brought into production less new stripper wells) and (2) existing wells aging and migrating down the fee schedule.
  • 5. Independent Fiscal Of ice July 2016 5   Rachel Carson State Of ice Building, 2nd Floor 400 Market Street Harrisburg, PA 17105 E‐mail: contact@ifo.state.pa.us Website: www.ifo.state.pa.us Staff Acknowledgements: Neil Bakshi and Matt Lindsay Independent Fiscal Of ice Endnotes 1. The Pennsylvania Public Utility Commission administers the impact fee and provides data on impact fee assessments and actual collections. This was cross‐referenced with unconventional well production data and spud data published monthly by the Department of Environmental Protection. 2. The fee schedule is adjusted downward if the price of gas falls below $3.00 and downward again if it falls below $2.25. See 58 Pa.C.S. § 2302(b) for the statutory adjustments and 46 Pa.B. 632 for the current fee schedule. Pursuant to 58 Pa.C.S. § 2301, the price used is the annual average of the settled prices for near‐month contracts on the New York Mercantile Exchange (NYMEX) in million British thermal units (MMBtu). This is the national benchmark price for the sale of natural gas. Other regional hubs exist in Pennsylvania, e.g., Dominion South and Leidy, which are used in Table 3 to approximate the prices received by producers. 3. An alternative to the annual average ETR is the lifetime ETR, which is the average rate over the lifetime of a single new well; this measure is best used to quantify the prospective tax burden on new wells across states. (See the IFO’s previous publication, Natural Gas Extraction: An Interstate Tax Comparison, for an analysis using the lifetime ETR.) 4. Conversion of units from dollars per MMBtu into dollars per thousand cubic feet (Mcf) was calculated using the Pennsylvania‐speci ic heat content of natural gas, as published by the U.S. Energy Information Administration. Post‐ production cost estimates are from a Range Resources investor presentation, March 31, 2016. These costs were adjusted by the IFO based on the proportion of wet and dry gas produced in Pennsylvania in 2015. “Wet” gas from the southwestern portion of the state incurs higher processing costs to separate natural gas liquids. Therefore, the post‐ production costs deducted from the price are a weighted average of $1.48 per Mcf for wet gas and $0.78 per Mcf for dry gas. 5. This price is different from that used in prior research briefs on the impact fee, which relied exclusively on the Dominion South hub. Changes in the industry and availability of trading information have made this weighted price appropriate. In addition to spot trading, producers also hedge prices for a large share of their production, using futures contracts and other more complex instruments. These strategies may yield a higher average price than the daily spot price. 6. See the IFO’s publication, Natural Gas Production Report: First Quarter 2016 for a summary of DEP data on production and wells drilled. These data do not directly correlate to data published by the PUC. Both are submitted to the agencies by operators. 7. According to DEP data, the number of wells spud from January to June was 421 in 2015, and 183 in 2016. 8. Exclusive of any change in the fee schedule due to price. Data Sources  Statewide production data and spud well counts can be found at https://www.paoilandgasreporting.state.pa.us/ publicreports/Modules/Welcome/Welcome.aspx.  Act 13 impact fee revenues and distributions can be found at http://www.puc.state.pa.us/ iling_resources/ issues_laws_regulations/act_13_impact_fee_.aspx.  Natural gas price forecast data are from BENTEK Energy and can be found at http://www.bentekenergy.com/index.aspx.