SlideShare uma empresa Scribd logo
1 de 54
Baixar para ler offline
The Fundamental Factors of the PE Ratio and Future Returns
An Empirical Analysis of the Belgian Stock Market
Maarten Gielis
Master toegepaste economische wetenschappen: Handelsingenieur
Promotor : Prof. dr. K. Smedts
2011 - 2012
FACULTEIT ECONOMIE EN BEDRIJFSWETENSCHAPPEN
KATHOLIEKE
UNIVERSITEIT
LEUVEN
THE FUNDAMENTAL FACTORS OF THE PE RATIO AND FUTURE
RETURNS
AN EMPIRICAL ANALYSIS OF THE BELGIAN STOCK MARKET
Maarten Gielis
In samenwerking met Jonas De Keuster
Verhandeling aangeboden tot
het behalen van de graad van
Master in toegepaste economische wetenschappen: Handelsingenieur
Promotor : Prof. Dr. K. Smedts
- 2012 -
KATHOLIEKE
UNIVERSITEIT
LEUVEN
FACULTEIT ECONOMIE EN BEDRIJFSWETENSCHAPPEN
DEPARTEMENT ACCOUNTANCY, FINANCE & INSURANCE
Maarten Gielis
in samenwerking met Jonas De Keuster
The Fundamental Factors of the PE Ratio and Future Returns
An Empirical Analysis of the Belgian Stock Market
Abstract:
The PE effect is heavily studied in the past 50 years. Anderson and Brooks
(2006) find that in the UK the PE multiple is partly determined by outside
influences such as the year, the size of a company and the sector in which it is
active. This paper replicates this study for the Belgian stock market. A leverage
component and a distress component are added. Data are collected for 132
companies from 1990-2011. We find significant relationships between leverage
and returns and between distress level and returns. All influences are isolated
and we use a regression analysis to determine their explanatory power on
returns. We withhold three: the distress level, the year and an idiosyncratic
component. A new EP statistic is constructed using these three influences. It
performs significantly better than the normal EP ratio in a contrarian investment
strategy that is long in value stocks and short in glamour stocks. Last we find
that the CAPM is not able to capture the excess returns generated by the value
portfolio. On the contrary, the Fama & French three-factor-model captures the
excess returns generated by the value portfolio. But it is still not able to predict
returns of the glamour portfolio.
FACULTEIT ECONOMIE EN BEDRIJFSWETENSCHAPPEN
DEPARTEMENT ACCOUNTANCY, FINANCE & INSURANCE
KATHOLIEKE
UNIVERSITEIT
LEUVEN
Acknowledgements
First of all I would like to thank our promoter Prof. dr. Kristien Smedts for the
opportunity to write our master thesis under her supervision. Her comments
were always fair and correct. We were motivated to work hard because we
knew we would get a lot in return. She set us up with a great plan and helped
us with a lot of difficult questions. I deeply appreciate the efforts she has
made for us.
I could not have reached this point in my life without the unconditional support
and love of my mother, my father, my brother Floriaan and my sister
Marjolein. My parents always helped and supported me in everything I chose
to do. More importantly, they gave me a place to come home. My brother and
my sister are two of the most important persons in my life. Floriaan’s
determination taught me to fight for something I want. I hope he will keep on
making good decisions in his life as he has done so far. Marjolein stayed in
the USA a whole year for an exchange. I missed my little sister very much so I
can only imagine what she must have felt being away for so long. I can learn
a lot from such a kind and brave person like her.
The things I have achieved I could not have done without my girlfriend, Ling.
She has made me feel special and important every single day over the past
five years. I am inspired by the way she works in order to accomplish what
she wants. I am thankful for being with her. I am amazed by her as a person.
A special thanks to my friend Jonas, who was a magnificent partner to write
this thesis with. Not only did we never have problems or discussions, I had a
great time with him working on our thesis. It is a sure thing he will achieve
great things in life.
Last, I would like to thank all my friends in Leuven. They have made these five
years unforgettable. I will never forget all the hilarious moments with Wim,
Glenn and Jonas. The last two years were an amazing experience with my
friends from Semper Potus.
The Fundamental Factors of the PE Ratio
and Future Returns
An Empirical Analysis of the Belgian Stock Market
Jonas De Keuster & Maarten Gielis
University of Leuven
Abstract
The PE effect is heavily studied in the past 50 years. Anderson and Brooks
(2006) find that in the UK the PE multiple is partly determined by outside influ-
ences such as the year, the size of a company and the sector in which it is active.
This paper replicates this study for the Belgian stock market. A leverage compo-
nent and a distress component are added. Data are collected for 132 companies
from 1990-2011. We find significant relationships between leverage and returns and
between distress level and returns. All influences are isolated and we use a regres-
sion analysis to determine their explanatory power on returns. We withhold three:
the distress level, the year and an idiosyncratic component. A new EP statistic is
constructed using these three influences. It performs significantly better than the
normal EP ratio in a contrarian investment strategy that is long in value stocks
and short in glamour stocks. Last we find that the CAPM is not able to capture
the excess returns generated by the value portfolio. On the contrary, the Fama
& French three-factor-model captures the excess returns generated by the value
portfolio. But it is still not able to predict returns of the glamour portfolio.
1
1 Introduction
Since Graham and Dodd (1934) and Nicholson (1960) found a significant relationship be-
tween multiples and subsequent returns, a lot of research has been done on this subject.
The EP ratio of a company can be different depending on the company, the moment in
time or the sector in which it operates. Although some limited evidence supports the
opposite, most research papers find significant differences between value stocks and glam-
our (or growth) stocks i.e. stocks with high and low EP values respectively. Literature
finds significantly better returns for a so-called contrarian investment strategy which is
long on value stocks and short on glamour stocks.
In contrast to the numerous studies on the EP effect, only some research has been
done on the decomposition of the EP ratio and the search for the underlying factors
which influence this multiple. Graham and Dodd (1934) use several years of earnings to
predict returns, as opposed to the normal EP which uses only earnings of the current year.
Anderson and Brooks (2006) find that the EP ratio is not only influenced by earnings
and price, but also by the market as a whole, the sector in which the company operates
and the size of the company.
The purpose of this paper is twofold. First, we identify the underlying factors to the
EP ratio in the Belgian stock market in order to construct a new EP and second, we
use this new EP to investigate whether it outperforms the normal EP in a contrarian
investment strategy. Our intention is to make a contribution to the academic research
regarding the relationship between multiples and returns. There are several reasons why
this research paper adds value. First, to our knowledge, limited research has been done
for the Belgian stock market about a possible EP effect i.e. companies with higher EP
earn higher returns. Second, it answers to the discussion in the paper of Anderson and
Brooks (2006) who search for fundamental factors of the EP ratio. They suggest to do
a similar study for other markets than the UK stock market. Also, they add that it is
useful to investigate other factors that may influence the EP ratio. By looking at the
Belgian stock market and by adding the gearing ratio and company rating we extend
their research. Third, our research paper is useful for practical purposes. The EP ratio
2
is widely used by investors. An improved version of this multiple could lead to higher
returns on investment. Indeed, if our new EP ratio is able to widen the performance
difference between returns on value stocks and returns on glamour stocks, a contrarian
investment strategy is more profitable.
As our study is similar to the research of Anderson and Brooks (2006), the structure
of their research paper is closely followed. First, we define the different underlying factors
to the EP ratio. For each factor, the data are sorted into groups from which the average
value is calculated. We run a regression analysis using these averaged values in order to
obtain a weight for each component. These weights are used to construct our new EP.
Company/year data are assigned to quintiles according to this new sort statistic. Finally,
a portfolio analysis shows the effect on the performance difference between the value and
growth quintile of using the new EP in contrast with the actual EP.
The remainder of this paper is organized as follows. The next section reviews the
related literature. Section 3 describes the different factors which influence the EP ratio
and the assumptions with regards to subsequent returns. Section 4 describes the data
that are used and presents the empirical results. The following section uses these results
to make a portfolio analysis and investigates the profitability of the newly constructed
EP. Section 6 concludes.
2 Literature
The effect of the earnings-price ratio was first analyzed by Nicholson (1960) who finds
that there is a significant relationship between the EP ratio and subsequent returns. His
sample consists of 100 common stocks and runs from 1939 until 1959. Nicholson shows
that low multiple stocks develop on average lower returns than stocks with a high EP
ratio. He argues that this trend occurs because of overconfidence in glamour stocks, of
which prices have risen more than earnings. Several studies have shown that this value-
glamour-effect is a general phenomenon. McWilliams (1966) finds evidence in a sample
from 1952-1964 containing 390 stocks that high EP ratio stocks drastically outperform
low EP ratio stocks.
3
Basu (1977) argues that the value-glamour-effect provides evidence against the semi-
strong form of the efficient market hypothesis. Indeed, if markets are semi-strong efficient,
all public information is reflected in stock prices meaning that no fundamental or technical
analysis can be used to earn superior gains. For NYSE stocks in the period 1956-1971
he finds that value portfolios outperform glamour stocks. This evidence supports his
criticism on the efficient market hypothesis. A study of Reinganum (1981) investigates
the relation between the EP ratio and returns and between company size and returns.
He concludes that small firms on average give better returns than large firms. He also
notes that the size effect is most important and underlying to the EP effect. Accordingly,
high EP portfolios earn better returns only because they generally contain more small
companies. Basu (1983) also searches evidence for EP and size effects in a dataset
ranging from 1963-1980. In his conclusion he does not agree with Reinganum (1981) on
their relative importance. After adjusting for risk he finds that the EP effect is present
in all size categories and that it is more distinct in small firm categories. So the EP effect
remains significant after controlling for size. He also finds that the size effect is only
marginal after controlling for the EP effect. He concludes that the relationship between
both effects is at least more complicated than assumed by Reinganum (1981). Basu
(1983) notes that both might be proxies for a more fundamental determinant of returns.
Peavy and Goodman (1983) study a sample of common stocks and try to determine
whether a high EP portfolio can outperform the market while controlling for size effect,
infrequent trading effect and industry effects. They find clear evidence for excess risk
adjusted returns. In a later note they test a sample from 1970-1980 and find size and EP
effects. They also find that in general, the EP effect subsumes the size effect and they
suggest that firm size might be a proxy for EP. On the other hand, they find that for
some portfolios both effects are independent. They conclude that a two factor CAPM
is not likely to describe real world stock markets. Later research by Cook and Rozeff
(1984) makes another attempt to capture the relation between the size and EP effects.
They use a dataset ranging from 1964-1981. They conclude that neither of the above
views is consistent with what they find in their results and that both EP and size effects
are at work. They agree with Basu (1983) that both effects might arise from a single
4
underlying effect. They also find evidence for the January effect. This is a general
increase in stock prices during the month of January. Banz and Breen (1986) formulate
two main criticisms for all previous research. First, earlier studies are prone to ex-post-
selection bias which means that some databases only contain currently viable companies
and do not account for merged or bankrupted companies. Second, they are vulnerable to
look-ahead bias i.e. the fact that portfolios are made using data that was not accessible
by investors at the time. They compare a standard sample of Compustat data with a
sample of manually adjusted and unbiased data ranging from 1974-1981. They find that
there is a significant difference between both samples. A size effect is still present in the
adjusted sample, but the EP effect is no longer significant and seems to be created by
both biases. They conclude that it is important to keep in mind that these biases exist
when constructing datasets. Jaffe, Keim and Westerfield (1989) investigate the US stock
market for a very long sample period from 1951-1986. They find that high EP stocks
outperform the low multiple shares, that size and returns are negatively correlated and
they find the existence of the January effect. Using a long sample period allows them to
conclude that the ambiguous results from previous studies can be attributed to the fact
that the different effects vary in strength over time. When considering the entire period
they agree with the findings of Cook and Rozeff (1984) that all effects are significant. In
Bhandari (1988) leverage is introduced as an explanatory factor for expected common
stock returns. He finds a positive relation between debt-equity ratio and return in a
1948-1981 dataset and notes that leverage might be a proxy for risk.
Although many studies find significant differences between value and growth portfo-
lios, there is no consensus about the reason for this value premium. Fama and French
(1992) argue that the basic CAPM model does not capture the variation in market re-
turns. They find evidence that in a 1963-1990 sample two factors, namely size and
book-to-market equity, can explain the variation in returns associated with size, EP,
book-to-market and leverage. They state that if their results are more than chance and
if asset pricing is rational, they implicate that size and book-to-market equity must be
a proxy for risk. In later research Fama and French (1993, 1995 and 1996) identify five
common risk factors in the returns of stocks and bonds. Three of which are stock risk
5
factors: the factors related to firm size and book-to-market equity and a third overall
market factor. A three-factor-model containing these risk factors is able to capture the
variation of average returns on US stocks associated to size, EP, cash flow/price, book-to-
market equity, past sales growth, long-term past return, and short-term past return. In
contrast, MacKinlay (1995) argues that multifactor models do not explain the deviation
from the CAPM. He builds a framework that shows that it is very difficult to empirically
detect deviations due to missing risk factors in the CAPM. In his view the value pre-
mium is sample specific. Finally he concludes that it might be fruitful to look at other
alternative explanations. Yet another view on the value-growth anomaly is proposed
by Lakonishok, Shleifer and Vishny (1994). They compare the performance of extreme
investment strategies for NYSE and AMEX stocks in a 1968-1990 sample. They draw
three main conclusions. First they find that a contrarian investment strategy is most
profitable. Second, they argue that investors have consistently overestimated the returns
of glamour stocks relative to value stocks. Last, they find that there is no difference in
the riskiness of both investment strategies. Thus they disagree with Fama and French
(1992) that the value stock anomalies are to be explained by risk. They state that instead
they are to be explained by mispricing errors made by investors. De Bondt and Thaler
(1985) believe that this premium for contrarian strategies occurs because of naive herd
behavior of investors. They base their study on the psychological fact that most people
overreact to unexpected and dramatic events. They investigate a sample of data ranging
from 1926-1982 and find empirical evidence for their hypothesis. A drop in investor con-
fidence for a certain stock causes this stock to become undervalued. Portfolios containing
past loser stocks outperform past winner portfolios for up to five years after portfolio for-
mation. In De Bondt and Thaler (1987) they confirm these findings out of a 1965-1984
sample. They also find that the winner-loser effect is not a consequence of changes in
risk as measured by the CAPM. It is also not primarily a size effect but it is partially
a small firm effect. Last they find reversal patterns that confirm the overreaction the-
ory. On the contrary, Jegadeesh and Titman (1993) try another strategy that buys past
winners and sells past losers. In the period from 1965-1989 they find this momentum
strategy to generate significant abnormal returns for up to 12 months. However, part of
6
the gains generated in the first year disappear in the following two years. Dreman and
Berry (1995) provide additional evidence to support the mispricing theory. They study
earnings surprises from 1973-1993 for 1331 companies. They conclude that both positive
and negative earnings surprises affect the low EP and high EP stocks in an asymmetric
manner favoring high EP stocks. This effect can endure until up to nineteen quarters
after the earnings event. In his book Contrarian investment strategies (1998) Dreman
gives a set of rules for executing a contrarian investment strategy. He argues that one
should invest in out-of-favour stocks because these stocks outperform the market. Dre-
man and Lufkin (2000) find additional proof for the psychological overreaction effect. In
a 1973-1998 sample of 4721 companies they study whether fundamentals or risk factors
induce any of the reversals in the performance of stocks. They show that this is not the
case and conclude that the only other explanation is psychological.
A large portion of previous research is mainly based on US stock market data. How-
ever, numerous papers find evidence of the existence of the value-growth anomaly in other
parts of the world. Chan et al. (1991) use 1971-1988 data of the Japanese stock mar-
ket to find that value stocks outperform growth stocks. Moreover, they find a negative
relationship between company size and returns. Park and Lee (2003) also find a value
premium for high EP stocks in the Japanese stock market in 1990-1999. Capaul, Rowley
and Sharpe (1993) find similar results for the French, German and Swiss stock markets
in a 1981-1992 sample. Brouwer, Van der Put and Veld (1997) investigate four Euro-
pean markets namely France, Germany, the UK and the Netherlands from 1982-1993.
They find that value strategies outperform growth strategies for all four value variables
investigated: EP ratio, cash-flow-to-price ratio, book-to-market ratio and dividend yield.
They also find that the value premium cannot be explained by the risk theory alone.
Doeswijk (1997) finds empirical evidence of a value premium in the Dutch stock market
in 1973-1995. In response to MacKinlay (1995), Fama and French (1998) provide addi-
tional out of sample and international evidence of the value premium. They investigate
a 1975-1995 dataset containing US, European, Australian and Far East markets. They
find that there is a 7.68% yearly resolution between returns on value and growth stocks
on a global portfolio. In twelve out of thirteen markets value stocks outperform growth
7
stocks. Levis (1989) investigates UK firms in 1956-1985. He finds evidence for a size
effect and EP effect. He notes that in his sample the EP effect subsumes the size effect.
Levis and Liodakis (2001) use a UK sample from 1986-1997 that contains 3838 companies
and find a value premium. They also find evidence that supports the mispricing theory
of Lakonishok, Shleifer and Vishny (1994). Gregory, Harris and Michou (2001) find that
in the period 1975-1998, for UK companies a contrarian investment strategy is profitable
while controlling for size effects. In their paper, Anderson and Brooks (2007) look at
UK listed companies. They examine the optimal size for a value and a growth portfo-
lio. For this sample, they find the highest returns for small value portfolios. However,
this portfolio comes with very high standard deviations. Growth portfolios give as high
standard deviations but their performance does not compensate for it. Kelly, McClean
and McNamara (2008) study a 1998-2006 sample of the Australian stock market and the
result shows the existence of a high EP effect in Australia. A recent study by Risager
(2010) examines a value premium on the Danish market. Indeed, he finds that there is
a significant valuation difference between a value and a growth portfolio. He argues that
this premium exists because of higher capital appreciation and higher dividends for value
stocks.
In contrast with these studies, some studies find no evidence of value stocks out-
performing growth stocks. Kyriazis and Diacogiannis (2007) examine the Athens Stock
Exchange in 1995-2002. They find no significant premium for value stocks. Brighi and
d’Addona (2007) provide evidence for a size effect in Italy. However, they do not find
significant results for the value effect on the Italian stock market. Similarly, Kryzanowski
and Zhang (1992) show for the Toronto Stock Exchange that growth stocks do not un-
derperform value stocks.
Although a lot of research investigates the EP effect as a given phenomenon, only
some research has been done about the decomposition of the EP ratio and the search
for factors that underlie the EP effect. Graham and Dodd (1934) argue that one cannot
assess the value of a company using data of the past year. They use multiple years of
earnings to predict returns. Following their reasoning, Anderson and Brooks (2005) ar-
gue that multiple years of earnings are better predictors for returns. Using a 1975-2003
8
sample of UK listed companies, they modify the EP ratio by averaging EPS over several
years. The highest resolution between value and glamour deciles is reached when using
an EP which is weighted over the past year and eight years ago. In another paper of
Anderson and Brooks (2006), using the same dataset, a new EP ratio for UK stocks is
constructed. In a linear regression model they account for market value, sector, time
and idiosyncratic effects. After regressing, the weights of these factors are rebalanced
following their relative importance. This newly constructed EP gives a better i.e. a
higher resolution between a value and a growth portfolio for their sample. Finally An-
derson and Brooks (2007) explore the extremes of the EP effect and find that most of
the value premium is to be found in those few shares with the most extreme EPs. Jiang
and Lee (2009) use a different decomposition for stocks of US stocks in the S&P Index
from 1926-2008. They decompose the EP ratio in a cyclical component and a stochas-
tic trend component. Using this decomposition, returns can be predicted better. They
also find that the cyclical components predict increases in returns whereas the stochastic
components predict decreases. Saleh (2007) examines the performance of a contrar-
ian investment strategy on the Amman Stock Exchange based on two measures namely
earnings-to-price and dividend-to-price. Saleh concludes in his paper that the HML and
SMB weights that are proposed by Fama and French (1993) in their three-factor-model,
are not significant. Following on this paper, Saleh and Bitar (2012) decompose the EP
for all non-financial Jordanian companies in 1980-2002 into a financial earnings effect and
an operational earnings effect. Their results do confirm the significance of the weights of
the three-factor-model developed by Fama and French. Hence they conclude that SMB
and HML factors capture variation in stock returns that is not captured by the market
return.
3 Model
The main goal of this paper is to identify the various factors that influence the EP ratio.
These factors allow us to create a new EP ratio, which is better in predicting returns
than the traditional EP statistic. First, we identify the factors that have a significant
9
effect on the EP ratio. Next, we assign weights according to their importance. Following
the reference paper of Anderson and Brooks (2006) – from here on addressed as AB2006
– a model that contains a year, sector, market value and an idiosyncratic factor gives
satisfactory results. Apart from these factors, the current paper includes company rat-
ings and the gearing ratio. The weights are determined using a regression model with
return as the dependent variable. The estimated parameters from this model are used to
construct a new EP statistic:
EPi,t =
β1Y earEPi,t + β2SizeEPi,t + β3SectorEPi,t + β4GearingEPi,t + β5RatingEPi,t + β6IdioEPi,t
6
j=1 βj
(3.1)
As an application, we use this newly constructed EP as a sort statistic to make a portfolio
analysis. The paper then investigates if this newly constructed statistic gives a better
performance i.e. a larger gap between the value and the glamour portfolio. This outcome
is compared to the performance using the traditional EP statistic.
We use an EP ratio rather than a PE ratio for several reasons. First, it is more
intuitive. A higher EP leads to higher subsequent returns, hence a positive relationship.
Also, in contrast to the PE, the EP is a percentage. Third, the PE ratio is discontinuous
around zero.
A time factor is the first variable in the model. As shown in AB2006, average market
EPs vary considerably over time. This can be due to changes in tendency of the market
or investor confidence, or other economic factors. A single average EP is calculated over
all companies for a single year. Empirical studies have shown that there is a significant
relationship between market average EP and subsequent returns. Indeed, for the UK
stock market AB2006 report a large positive relationship between the averaged yearEP
and subsequent returns.
Second, and similar to AB2006, the influence of company sector is investigated. It is
intuitive to assume that at least part of the differences in EP ratios between companies
10
is explained by the sector in which they operate. In their study, AB2006 show that the
sector effect on returns is marginal yet always negative. This means a lower sector EP
is associated with higher returns. To investigate this factor, an average sector EP is
calculated across all years. This is necessary to split up time and size effects. In line with
AB2006 we assume that sector, size, gearing and rating effects do not have their own
year-dependent variation. This assumption is necessary to divide the time effect from
other effects.
A size component is also covered by the AB2006 study and they find a negative
correlation between market value and EP. Hence, larger companies have lower subsequent
returns. This finding is in line with the Fama and French (1998) study and the Dreman
(1998) study. This negative effect is attributed to the fact that larger companies suffer
less liquidity constraints. Investors are then less affected by liquidity risk when trading
these large stocks. By consequence it is easier for large fund managers to invest in these
stocks rather than in small company stocks that suffer high liquidity risk. This pushes the
price of the large company stocks up and therefore the EP decreases. The size component
is taken into account by using size sorted groups according to market value each year.
Each group has its own average size EP. These year average size EPs are then averaged
over all investigated years.
One of the future work proposals in AB2006 is to construct a model that also includes
a gearing component. It is plausible that this component has an effect on EP because
debt influences investor confidence. A company that has unhealthy i.e. high gearing
is vulnerable to shocks and faces problems in attracting additional financial resources.
Investors know this. It can affect both stock prices and earnings. Therefore we expect
ambiguous results regarding the influence of gearing on EP. Indeed, companies with high
gearing tend to be less attractive hence lower prices. On the other hand, companies
with high debt cannot pay out much earnings to shareholders which brings down EP.
However, we expect a clear negative impact of gearing on returns. The gearing component
is included in a similar way as the size component. Companies are sorted into groups
according to yearly gearing ratios. From this, a yearly average gearing EP is calculated
across each group. This is then averaged across all years for each group.
11
The last component that is included is a rating component. Companies are rated by
rating agencies to give investors an idea of their financial health. This has an impact on
the EP ratio because it has a direct effect on investor confidence. We expect somewhat
ambiguous results for the influence of rating on EP. An analogous argument as in the
previous paragraph is applicable. We do expect a high positive relationship between
rating and returns. The rating component might be strongly correlated with gearing.
Again, companies are sorted into groups according to their rating. Next, a yearly average
rating EP is calculated which is then averaged across all years for each group.
Finally an idiosyncratic component is included to account for company specific effects.
Since it is impossible to quantify this component it is extracted from all previous factors.
This method is explained below.
Having defined all these components, it is now possible to construct a new statistic,
which has already been defined in equation (3.1). In this new statistic, βj are the weights
determined by the parameters from regressing all components on returns. The response
variable is the total yearly return and the explanatory variables are the ones described
above:
Returni,t = β0 + β1Y earEPi,t + β2SizeEPi,t + β3SectorEPi,t
+β4GearingEPi,t + β5RatingEPi,t + β6IdioEPi,t + ui,t
(3.2)
Regression analysis gives an estimation for the individual βj. To obtain an estimation
for β6, we need data for each company/year Idio EP. This is derived from the following
multiplicative arrangement - analogous to AB2006:
ActualEPi,t
AverageEP
=
Y earEPi,t
AverageEP
×
SizeEPi,t
AverageEP
×
SectorEPi,t
AverageEP
×
GearingEPi,t
AverageEP
×
RatingEPi,t
AverageEP
×
IdioEPi,t
AverageEP
(3.3)
Every IdioEPi,t is then easily derived by rearranging this equation:
12
IdioEPi,t =
ActualEPi,t × AverageEP5
Y earEPi,t × SizeEPi,t × SectorEPi,t × GearingEPi,t × RatingEPi,t
(3.4)
4 Empirical Analysis
4.1 Data
We use Datastream to obtain a representative dataset for the Belgian market. The
Belgian All-Share Index is composed of the stocks in the Belgian small-cap, mid-cap and
large-cap segments. To control for ex-post-selection bias, we include dead companies that
were delisted or went bankrupt. Our dataset runs from 1990 to 2011. Data availability
for longer historical samples is limited. To control for look-ahead bias, we request data
as at the 1st of May of every year. By doing so, a four month gap is created between
the year of earnings being studied and portfolio formation. Also, we exclude financial
institutions such as banks and holding companies, in line with AB2006.
The PE ratio in Datastream is calculated as the price per share divided by the earn-
ings per share. For certain company/year data where EPS equals zero, we set the EP
equal to zero. Yearly returns are based on the Total Return Index which shows a the-
oretical growth in value of a share. We use a general characterization for the different
sectors. More specifically, we use the second level sector classification of the Datastream
Global Equity Index hierarchy based on the Industry Classification Benchmark. This
format yields a classification into ten sectors. Market value on Datastream is the share
price multiplied by the number of ordinary shares in issue. The gearing ratio is measured
as total debt over total assets. The Altman Z-score is used to proxy for company ratings.
This score was developed by Altman (1968) and combines five different financial ratios
to determine the likelihood of bankruptcy of a firm. The lower this score, the more likely
it is for a firm to go bankrupt. It is calculated as follows:
13
AltmanZ = 1.2×
WorkingCapital
TotalAssets
+1.4×
RetainedEarnings
TotalAssets
+3.3×
EBIT
TotalAssets
(4.1)
+0.6 ×
MarketV alueofEquity
TotalLiabilities
+ 0.999 ×
Sales
TotalAssets
Working capital is calculated in Datastream as the difference between current assets and
current liabilities. Retained earnings are earnings which have not been distributed as
dividends to shareholders or allocated to a reserve account. EBIT is calculated by taking
the pretax income, adding back interest expense on debt and subtracting interest capital-
ized. Net sales represent gross sales and other operating revenue. Total assets represent
the sum of total current assets, long term receivables, investment in unconsolidated sub-
sidiaries, other investments, net property plant and equipment and other assets. Total
liabilities are all short and long term obligations incurred by the company.
A CAPM and Fama-French three-factor-model analysis is conducted in one of the
following sections. We download risk free rates of Belgian Treasury certificates from
Datastream. For the FF-adjustment we request HML and SMB data for the Belgian
market through Style Research1
.
4.2 Results
In this section we present the descriptive statistics and the results of the regression
analysis. First, the influence of different years on EP and returns is shown in Table
15 in the Appendix. The years following on 2000 have negative returns due to the
dotcom-bubble. 2009 jumps out with an extremely negative average return because of
the subprime crisis. Analysis shows that the average Year EPs are negatively correlated
with average returns. More specifically, the correlation coefficient is equal to -0.4718,
which can be seen in Table 1. This significant negative relationship is in contrast with
AB2006.
1
Style Research is an independent international provider of global investment research and portfolio
analysis applications. Their European office is based in London, UK.
14
Table 1: Correlations between EP influences and one-year-returns
using average values
EP Influence Return
YearEP -0.4718∗∗
SectorEP -0.3883
MVEP 0.0243
GearinEP 0.8048
AltmanZEP 0.4518
IdioEP 0.3693
Note: Significance levels:
∗ p ≤ .10 ∗∗ p ≤ .05 ∗ ∗ ∗ p ≤ .01
Second, the effect of company sector is investigated, as shown in Table 16 (Appendix).
The Industrials, Telecom, Basic Materials and Utilities sectors have high EP ratios.
Indeed, these sectors are characterized by low growth and hence low expected earnings.
Sector EP categories are negatively correlated with returns. This is in line with the
findings of AB2006, who find that sector effects are consistently negative. Our correlation
of -0.3883 is not significant (Table 1). This fits the marginal negative correlation that
AB2006 find. Next we look at market value. The different market value categories, their
EPs and subsequent returns can be found in Table 17. We use five classifications for
market value. Using our data, there is no evidence that market value EP categories have
an effect on returns (Table 1). The correlation of 0.0243 is not significantly different from
zero. However, correlation between individual values of market value EP and subsequent
returns is positive and significant (Table 2).
15
Table 2: Correlations between EP influences and one-year-returns
using individual values
EP Influence Return
MVEP 0.0711∗∗∗
GearingEP 0.0623∗∗
AltmanZEP 0.0782∗∗
IdioEP 0.0733∗∗
Note: Significance levels:
∗ p ≤ .10 ∗∗ p ≤ .05 ∗ ∗ ∗ p ≤ .01
Gearing is another effect that is investigated. In Table 18 there is no clear distinction
between low or high geared companies regarding EP. However, we see a clear increase
in returns with lower gearing categories, except for the lowest gearing category. From
Table 1 we notice a large positive correlation between average gearing EPs and return
of 0.8048. However, this relationship is not significant. When using individual values of
gearing EP, we obtain a significantly positive correlation of 0.0623 (Table 2). Moreover,
there is a significantly negative relationship between gearing and return (Table 3). This
result is intuitive as highly geared companies often perform worse.
Table 3: Correlations between different individual influences and one-
year-returns
Influence Return
MV 0.0107
Gearing -0.0938∗∗∗
AltmanZ 0.1493∗∗∗
Note: Significance levels:
∗ p ≤ .10 ∗∗ p ≤ .05 ∗ ∗ ∗ p ≤ .01
16
A classification according to the Altman Z-score gives three different categories as is
shown in Table 19. Companies in a higher group i.e. with higher Altman Z-scores have
higher returns. Higher Altman-Z EP gives significantly higher returns as can be seen in
Table 2. Our expectation that healthier companies give better returns is confirmed by
a highly significant relationship between Altman Z-scores and subsequent returns (Table
3). The last effect that is taken into account is the idiosyncratic EP effect. This is the
remainder of the five averaged effects in order to obtain the actual EP. As is shown in
Table 20, data are sorted according to idiosyncratic EP values. There is no clear regularity
in the data. The correlation between the EP categories and subsequent returns is 0.3693
but not significant (Table 1). However, using individual values we obtain a positive and
significant relationship between EP and returns (Table 2).
In Table 4 correlations between the different EP influences are shown. These corre-
lations are calculated using individual company/year values. Some variables are signifi-
cantly correlated with each other. In particular, Altman-Z EP is highly correlated with
other variables. However, there is no perfect multicollinearity. The values are not large
enough to cause problems.
Table 4: Correlations between different EP influences of individual values
YearEP SectorEP MVEP GearingEP AltmanZEP IdioEP
YearEP 1
SectorEP -0.0610 1
MVEP -0.0458∗
0.0077 1
GearingEP -0.0004 0.0469 0.0444 1
AltmanZEP -0.0872∗∗
0.1273∗∗∗
-0.0160 0.01047∗∗∗
1
IdioEP 0.0281 -0.0164 -0.0194 -0.0179 -0.0076 1
Note: Significance levels: ∗ p ≤ .10 ∗∗ p ≤ .05 ∗ ∗ ∗ p ≤ .01
17
We use the average EPs to find the weights for our model. A regression using all
average EPs gives us the following estimation:
Table 5: Regression analysis output of all influences on returns
Dependent Variable
Return
Variable Weight Standard Error P-value
Constant -0.6726 0.3081 0.0293
YearEP 2.2337 1.1524 0.0529
SectorEP 1.4673 1.3548 0.2791
MVEP -1.7091 2.5328 0.5000
GearingEP 3.3196 3.4474 0.3359
AltmanZEP 5.6326 2.0619 0.0064
IdioEP 0.4829 0.2964 0.1036
R2
2.0867%
AdjustedR2
1.3578%
Note: regression of different EP influences. Return is the dependent variable.
Output reports with Newey-West standard errors.
Table 5 shows the estimations for the weights, their respective standard errors and the
P-values. This analysis shows that the Altman-Z EP is significant at the 1% level.
The constant term is significant at the 5% level and Year EP is significant at the 10%
level. The other terms are not significant. To investigate which of these influences add
considerate explanatory power, we conduct a stepwise regression. Results can be found
in Table 6.
18
Table 6: Regression analysis output using stepwise regression analysis
Model1 Model2 Model3 Model4 Model5 Model6
C -0.3057∗∗
-0.3398∗∗
-0.5143∗∗∗
-0.707∗∗∗
-0.7850∗∗∗
-0.6726∗∗
AltmanEP 5.7564∗∗∗
5.7922∗∗∗
6.1577∗∗∗
5.9021∗∗∗
5.6695∗∗
5.6326∗∗
IdioEP 0.4903∗∗
0.4783∗∗
0.4827∗∗
0.4855∗∗
0.4829∗∗
YearEP 2.2294∗
2.2175∗
2.2694∗
2.2337∗
GearingEP 3.3200 3.2288 3.3196
SectorEP 1.4614 1.4674
MVEP -1.7091
R2
0.8196% 1.3670% 1.8002% 1.9442% 2.0365% 2.0867%
Note: we use a stepwise regression analysis to determine the amount of explanatory power of each
factor. The order by which variables are included depends on the size of the correlation between the
variable and returns. Cumulative R2
values are reported.
Significance levels: ∗ p ≤ .10 ∗∗ p ≤ .05 ∗ ∗ ∗ p ≤ .01
Although Idio EP is not significant according to the regression analysis, it adds a large
proportion to the R-squared of the model. Therefore this term is included in our further
analysis as well. Altman-Z EP is by far the most important factor in the regression. This
model which contains all weights has an explanatory power of 2.0867%. When using
only the significant weights to estimate the model, regression analysis gives following
estimation:
19
Table 7: Regression analysis output of significant influences on
returns
Dependent Variable
Return
Variable Weight Standard Error P-value
Constant -0.5143 0.1832 0.0051
YearEP 2.2294 1.1801 0.0592
AltmanZEP 6.1577 2.2238 0.0058
IdioEP 0.4793 0.2310 0.0387
R2
1.8002%
AdjustedR2
1.4361%
Note: this model uses influences withheld by stepwise regression Table 6.
Return is the dependent variable. Output reports with Newey-West standard
errors.
The estimations for the weights, their respective standard errors and the P-values are
shown in Table 7. Now the constant term and the Altman-Z EP are significant at the 1%
level. IdioEP and YearEP are significant at the 0.05 and 0.1 level respectively. Altman-
Z EP still has a very large weight compared to the other variables. This model has an
explanatory power of 1.8002%. Moreover, it has a slightly better adjusted R-squared
of 1.4361%. For both models there is serial correlation at the 0.05 level so we report
Newey-West standard errors. The explanatory power of these two models is not very
high, but a model with only the EP as dependent variable has an R-squared of 0.4569%
and an adjusted R-squared of 0.3341%. The results for this model are shown in Table 8.
The weight for EP in this model is significant at the 10% level.
20
Table 8: Regression analysis output using the normal EP ratio
Dependent Variable
Return
Variable Weight Standard Error P-value
Constant 0.0778 0.0206 0.0002
EP 0.3278 0.1699 0.0540
R2
0.4569%
AdjustedR2
0.3341%
Note: this table reports the amount of explanatory power provided by the
normal EP ratio on returns.
Our newly composed EP ratio is an average value. From Table 21 and Table 22
(Appendix) it is clear that this new EP does very well in explaining the variation in
the actual EP. Indeed, when using all weights for constructing a new EP (Table 21), R-
squared equals 30.1473%, after using Newey-West standard errors. When we use only the
significant weights of the regression, the newly constructed EP explains more than 40% of
the actual EP. These results are also corrected for serial correlation and heteroscedasticity
with Newey-West standard errors.
21
Table 9: Regression analysis output using the new EP ratio with all
weights
Dependent Variable
Return
Variable Coefficient Standard Error P-value
Constant -0.3400 0.2386 0.1546
NewEP(all weights) 6.7108 3.6239 0.0644
R2
0.4211%
AdjustedR2
0.2983%
Note: this table reports the amount of explanatory power provided by the new EP
statistic on returns. This new EP uses all influences defined in this paper.
Our new EP explains about the same amount of variation of returns as the actual EP.
R-squared is 0.4211% and 0.4569% respectively (Table 8 and Table 9). In both cases
the coefficient of the EP statistic is significant at the 10% level. However, when only
significant weights are used to construct the new EP, it explains returns more than
four times better than the actual EP. The R-squared value is 1.8002%. Moreover, the
coefficient of this new EP statistic is significant at the 0.05% level (Table 10).
22
Table 10: Regression analysis output, using the new EP ratio with only
significant weights
Dependent Variable
Return
Variable Coefficient Standard Error P-value
Constant -0.5143 0.1773 0.0038
NewEP(sign. weights) 8.8654 2.5464 <0.0005
R2
1.8002%
AdjustedR2
1.6791%
Note: this table reports the amount of explanatory power provided by the new EP
statistic on returns. This new EP uses influences withheld by a stepwise linear
regression (Table 6).
We conclude that a new EP consisting of only the significant weights is best used for
the portfolio analysis. From our results we expect that this will gives the largest gap for
the contrarian investment strategy.
5 Portfolio Analysis
5.1 Portfolio Formation
In the previous section we find that a new EP statistic that weighs for year, distress and
idiosyncratic components adds significant explanatory power to predict returns. In this
section we investigate whether it is possible to generate a profit using a strategy based
on this new EP statistic. We compare a contrarian investment strategy based on the
actual EP ratio to one that is based on the new EP statistic. To do so, we first create
value and glamour portfolios based on actual EP data. We use the upper EP quintile
and lower EP quintile respectively. Both portfolios are rebalanced annually.
23
Figure 1: Yearly return differences between value and glamour portfolios for actual EP
and new EP
Figure 1 shows yearly return differences between both portfolios. The value portfolio
outperforms the glamour portfolio in thirteen of 21 years. Both portfolios lose in ten out
of 21 years. The value portfolio earns on average 5.57% more than the glamour portfolio.
The value portfolio incurs a worst loss of 31.84% in 2003 while the glamour portfolio
incurs a worst loss of 46.33% in 2009. However, the difference between annual returns
is not significant after conducting a paired observations t-test as shown in Table 11. An
investment in the value portfolio in 1990 is worth three times more in 2011 than the same
investment in the glamour portfolio.
24
Table 11: Yearly return difference between value and glamour
quintiles for Actual EP and New EP
T-test for paired observations Actual EP New EP
Value(1) average 10.09% 11.17%
Glamour(2) average 4.52% -1.76%
(1)-(2) average 5.57% 12.94%
p-value 0.3720 0.0499
Note: t-test for paired observations testing for significance of differences
between value and glamour portfolios using both the actual EP and new
EP statistics. Average values of returns are calculated over the full sample
period.
Second we create portfolios using our new EP statistic constructed with only signifi-
cant weights. These portfolios are created similarly as the portfolios based on the actual
EP ratio. Figure 1 also shows the yearly return differences for the new EP statistic. The
value portfolio outperforms the glamour portfolio in fourteen of 21 years. The value port-
folio loses value in nine out of 21 years while the glamour portfolio does so in thirteen
out of 21 years. The value portfolio gains on average 12.94% more than the glamour
portfolio. For an investment in both portfolios in 1990, the value portfolio is worth 24
times more than the glamour portfolio after a twenty-year holding period. The worst loss
is 30.72% in 2009 for the value portfolio and 59.09% for the glamour portfolio in 2001.
When conducting a paired observations t-test, the difference between annual returns of
both portfolios is statistically significant at the 5% level (Table 11).
25
Figure 2: Yearly return difference between Actual EP and New EP for value and
glamour portfolios
Figure 2 compares the new EP statistic to the actual EP for both value and glamour
strategies. The new EP statistic widens the gap between average annual returns of
value and glamour quintiles by 7.37%. The value portfolio using the new EP statistic
outperforms the value portfolio using the actual EP ratio by 1.09% on average. However,
the difference between annual returns is not statistically significant. Similarly the glamour
portfolio using the new EP statistic underperforms the glamour portfolio using the actual
EP by 6.28% on average. In this case the difference between annual returns is statistically
significant at the 1% level. These results can be found in Table 12.
26
Table 12: Yearly return difference between Actual EP and
New EP for value and glamour quintiles
T-test for paired observations Value Glamour
Actual EP(1) average 10.09% 4.52%
New EP(2) average 11.17% -1.76%
(1)-(2) average -1.09% 6.28%
p-value 0.7165 0.0022
Note: t-test for paired observations testing for significance of dif-
ferences between the use of the actual EP and the new EP statistics
for both value and glamour portfolios. Average values of returns are
calculated over the full sample period.
5.2 CAPM comparison
The previous section suggests that a contrarian investment strategy is profitable. This
section investigates whether this strategy generates excess returns compared to the re-
turns expected by the CAPM. We assume the risk-free rate equal to the interest rate
on one-year Belgian Treasury bills (Table 23). Using this risk-free rate, we estimate an
equation of the following form:
Ri,t − Rf = αi + βi × (RM,t − Rf ) + ui,t (5.1)
where Ri,t−Rf is equal to the excess return of a certain portfolio and RM,t−Rf equals the
excess market return of that year. In an efficient market the expected value of the alpha-
coefficient is equal to zero. We analyze excess returns for value and glamour portfolios
of the Actual EP and the New EP in turn. The results for the regressions can be found
in Table 13.
27
Table 13: Estimations for the alpha and beta coefficients using the
Actual EP and New EP statistics
Actual EP New EP
α β R2
α β R2
Re
V alue 0.0988∗∗
0.4246∗∗
3.77% 0.1352∗∗∗
0.1447 0.47%
Re
Glamour -0.0064 0.2082 0.14% -0.0697∗
0.2082 0.96%
Note: CAPM comparison: Regression analyses using equation (5.1).
Significance levels: ∗ p ≤ .10 ∗∗ p ≤ .05 ∗ ∗ ∗ p ≤ .01
For the Actual EP as well as for the New EP there is a clear value effect. Indeed, the
alpha coefficients for the value portfolios are significantly larger than zero. Portfolios
which are composed of value stocks thus have a larger return in excess of market risk.
Moreover, when using the New EP, we can see a significantly positive alpha-coefficient for
the value portfolio and a significantly negative alpha-coefficient for the growth portfolio.
These findings all confirm a value effect in our sample. We conclude that a contrarian
strategy based on the new EP multiple generates excess returns without taking additional
risk.
5.3 Fama & French three-factor-model correction
The previous section shows that the CAPM is not able to capture the excess returns, in
line with many previous research. Fama and French (1993) generate a model which is
able to capture these excess returns better. We investigate whether the FF three-factor-
model captures the excess returns of our portfolios. Again, we assume the risk-free rate
equal to the interest rate on one-year Belgian Treasury bills (Table 23). The SMB and
HML are data provided by Style Research (Table 24).
Ri,t − Rf = αi + βi × (RM,t − Rf ) + bs × SMB + bv × HML + ui,t (5.2)
Where Ri,t −Rf is equal to the excess return of a certain stock and RM,t −Rf is equal to
28
the excess market return of that year. Analogous to the CAPM, the α parameter is the
excess return which is not captured by the risk-adjustment of the FF three-factor-model.
Table 14: Estimations for the alpha, beta, bs and bv coefficients
use the Actual EP and New EP
Actual EP
α β bs bv R2
Re
V alue -0.0094 1.0301∗∗∗
-2.3570∗
3.7030∗∗
11.56%
Re
Glamour -0.1130∗
0.6816∗∗
-2.8840∗∗
3.4927∗∗
7.92%
New EP
α β bs bv R2
Re
V alue 0.0145 0.8316∗∗∗
-2.4805∗
4.1716∗∗∗
10.50%
Re
Glamour -0.1617∗∗∗
0.7343∗∗∗
-1.5673 3.2934∗∗
6.58%
Note: Fama and French three-factor-model adjustment: Regression analyses
use equation (5.2).
Significance levels: ∗ p ≤ .10 ∗∗ p ≤ .05 ∗ ∗ ∗ p ≤ .01
Looking at Table 14, we see that the model developed by Fama and French is better at
capturing the excess returns of our portfolios. For the value portfolios all coefficients are
significantly different from zero, apart from the alpha-coefficient. For both the Actual
EP and the New EP there are no excess returns for the value portfolios. However, the
three-factor-model is still not able to capture the significantly negative excess returns of
the glamour portfolios.
The results from this analysis are contradictory to the conclusion drawn from the
CAPM comparison. We note that the R-squared values of CAPM are low while the
Fama & French model has higher explanatory power on returns. According to the CAPM,
the value strategies generated significant excess returns without taking additional risk.
However, when the three-factor-model is used, the additional factors capture the risk
and excess returns disappear. Accordingly, the returns on the value portfolio are solely
a compensation for risk. However, the Fama & French model is still not able to capture
29
the returns generated by the glamour portfolios. A strategy that is short in the glamour
portfolio generates significant excess returns.
6 Conclusion
Alongside with many other stock market anomalies, the price-earnings effect has been
heavily studied over the past 50 years. Anderson and Brooks (2006) find that it is possible
to add value using an adjusted EP statistic that accounts for various influences. Their
research focuses on the UK stock market. In addition to their work we replicate this
study for the Belgian stock market.
We use data of 132 Belgian companies from 1990-2011. We correct for survivorship
bias and look-ahead bias. We use a model similar to AB2006 to identify the relative
importance of influences such as the yearly market EP, the company size, the sector,
leverage, the company distress level and an idiosyncratic component. We find a signifi-
cantly negative correlation between leverage and subsequent returns. The positive and
significant relationship between company distress levels and subsequent returns is even
stronger. Our regression analysis withholds three factors that add significant explanatory
power to returns namely the distress component, the year component and the idiosyn-
cratic component. These factors are used to construct a new EP statistic. This statistic
predicts returns more than four times better than the actual EP ratios.
We then use this new EP statistic to construct portfolios and compare this investment
strategy to the one where we use the actual EP ratios to create contrarian investment
portfolios. It appears that the new statistic generates better results. The difference be-
tween average annual returns is enlarged by 7.37% from 5.57% to 12.94%. The differences
between annual returns of value and glamour portfolios using the new EP statistic are
significant. We then investigate whether this strategy is able to generate excess returns
compared to expected returns by the CAPM. We find that the value portfolios using the
actual and new EP statistics generate significant excess returns. On the other hand, the
glamour portfolios underperform the return expected by the CAPM. They do so signif-
icantly for the new EP statistic. We conclude that our contrarian investment strategy
30
exceeds the returns expected by the CAPM. Last we test whether the Fama & French
three-factor-model is able to capture the value premium. No excess returns are gener-
ated on the value portfolio while the glamour portfolio underperforms expected returns
for both the actual and new EP statistics.
31
References
[1] E. Altman. Financial Ratios, Discriminant Analysis and the Prediction of Corporate
Bankruptcy. Journal of Finance, 23(4):589–609, 1968.
[2] K. Anderson and C. Brooks. The Long-Term P/E Ratio. Journal of Business
Finance and Accounting, 33(7-8):1063–1068, 2005.
[3] K. Anderson and C. Brooks. Decomposing the Price-Earnings Ratio. Journal of
Asset Management, 6(6):456–469, 2006.
[4] K. Anderson and C. Brooks. Extremes of the P/E Effect. Journal of Investing,
16(1):69–81, 2007.
[5] R.W. Banz and W.J. Breen. Sample-Dependent Results Using Accounting and
Market Data: Some Evidence. Journal of Finance, 41(4):779–793, 1986.
[6] S. Basu. Investment Performance of Common Stocks in Relation to Their Price-
Earnings Ratios: A Test of the Efficient Market Hypothesis. Journal of Finance,
32(3):663–682, 1977.
[7] S. Basu. The Relationship Between Earnings’ Yield, Market Value and Return for
NYSE Common Stocks. Journal of Financial Economics, 12(1):129–156, 1983.
[8] L.C. Bhandari. Debt/Equity Ratio and Expected Common Stock Returns: Empiri-
cal Evidence. Journal of Finance, 43(2):129–156, 1988.
[9] P. Brighi and S. d’Addona. An Empirical Investigation of the Italian Stock Market
Based on the Augmented Fama and French Three-Factor Pricing Model. Working
Paper, pages 1–24, 2007.
[10] I. Brouwer, J. Van Der Put, and C. Veld. Contrarian Investment Strategies in a
European Context. Journal of Business Finance and Accounting, 24(9-10):1353–
1366, 1997.
32
[11] C. Capaul, I. Rowley, and W.F. Sharpe. International Value and Growth Stock
Returns. Financial Analysts Journal, 49(1):27–36, 1993.
[12] T.J. Cook and M.S. Rozeff. Size and Earnings/Price Ratio Anomalies: One Effect
or Two? The Journal of Financial and Quantitative Analysis, 19(4):449–466, 1984.
[13] W.F. De Bondt and R.H. Thaler. Does the Stock Market Overreact? Journal of
Finance, 40(3):793–805, 1985.
[14] W.F. De Bondt and R.H. Thaler. Further Evidence on Investor Overreaction and
Stock Market Seasonality. Journal of Finance, 42(3):557–581, 1987.
[15] R.Q. Doeswijk. Contrarian Investment in the Dutch Stock Market. De Economist,
145(4):573–598, 1997.
[16] D.N. Dreman. Contrarian Investment Strategies. Chicago: Free Press, 1998.
[17] D.N. Dreman and M.A. Berry. Overreaction, Underreaction, and the Low P/E
Effect. Financial Analysts Journal, 51(4):21–30, 1995.
[18] D.N. Dreman and E.A. Lufkin. Investor Overreaction: Evidence That Its Basis Is
Psychological. Journal of Psychology and Financial Markets, 1(1):61–75, 2000.
[19] E.F. Fama and K.R. French. The Cross-Section of Expected Stock Returns. Journal
of Finance, 47(2):427–465, 1992.
[20] E.F. Fama and K.R. French. Common Risk Factors in the Returns of Stocks and
Bonds. Journal of Financial Economics, 33(1):3–56, 1993.
[21] E.F. Fama and K.R. French. Size and Book-to-Market Factors in Earnings and
Returns. Journal of Finance, 50(1):131–155, 1995.
[22] E.F. Fama and K.R. French. Multifactor Explanations of Asset Pricing Anomalies.
Journal of Finance, 51(1):55–84, 1996.
[23] E.F. Fama and K.R. French. Value versus Growth: The International Evidence.
Journal of Finance, 53(6):1975–1999, 1998.
33
[24] D.A. Goodman and J.W. Peavy. The Interaction of Firm Size and Price-Earnings
Ratio on Portfolio Performance. Financial Analysts Journal, 42(1):9–12, 1986.
[25] B. Graham and D. Dodd. Security Analysis. New York: McGraw-Hill, 1934.
[26] A. Gregory, R.D. Harris, and M. Michou. An Analysis of Contrarian Investment
Strategies in the UK. Journal of Business Finance and Accounting, 28(9-10):1193–
1228, 2001.
[27] J. Jaffe, D.B. Keim, and R. Westerfield. Earnings Yield, Market Values, and Stock
Returns. Journal of Finance, 44(1):135–148, 1989.
[28] N. Jegadeesh and S. Titman. Returns to Buying Winners and Selling Losers: Im-
plications for Stock Market Efficiency. Journal of Finance, 48(1):65–91, 1993.
[29] X. Jiang and B.S. Lee. Do Decomposed Financial Ratios Predict Stock Returns and
Fundamentals Better? Working Paper, pages 1–45, 2009.
[30] S. Kelly, J. Mclean, and R. McNamara. The Low P/E Effect and Abnormal Returns
for Australian Industrial Firms. Working Paper, pages 1–38, 2008.
[31] D. Kyriazis and G. Diacogiannis. Testing the Performance of Value Strategies in the
Athens Stock Exchange. Applied Financial Economics, 17(18):1511–1528, 2007.
[32] J. Lakonishok, A. Schleifer, and R.W. Vishny. Contrarian Investment, Extrapolation
and Risk. Journal of Finance, 46(5):1541–1578, 1994.
[33] M. Levis. Stock Market Anomalies: A Re-assessment Based on the UK Evidence.
Journal of Banking and Finance, 13(4-5):675–696, 1989.
[34] M. Levis and M. Liodakis. Contrarian Strategies and Investor Expectations: The
UK Evidence. Financial Analysts Journal, 57(5):43–56, 2001.
[35] J.D. McWilliams. Earnings and P/E Ratios. Financial Analysts Journal, 22(3):137–
142, 1966.
34
[36] S.F. Nicholson. Price-Earnings Ratios. Financial Analysts Journal, 16(4):43–45,
1960.
[37] Y.S. Park and J.J. Lee. An Empirical Study on the Relevance of Applying Relative
Valuation Models to Investment Strategies in the Japanese Stock Market. Elsevier
- Japan and the World Economy, 15(3):331–339, 2003.
[38] M.R. Reinganum. An Empirical Study on the Relevance of Applying Relative Val-
uation Models to Investment Strategies in the Japanese Stock Market. Journal of
Financial Economics, 15(3):331–339, 1981.
[39] O. Risager. The Value Premium on the Danish Stock Market. Working Paper, pages
1–25, 2010.
[40] W. Saleh. Overreaction: the sensitivity of defining the duration of the formation
period. Applied Financial Economics, 17(1):45, 2007.
[41] W. Saleh and A. Bitar. Decomposition of Earnings-to-Price (E/P) Effect. Interna-
tional Journal of Economics and Finance, 4(1):229–234, 2012.
35
Appendix
Table 15: Average EPs and subsequent returns sorted
by year
Year AverageEP Return Weighted Return
1991 0.0593 -0.86% 2.32%
1992 0.0545 -6.20% 4.19%
1993 0.0559 -4.06% 10.03%
1994 0.0438 32.86% 31.86%
1995 0.0530 -7.42% -3.33%
1996 0.0631 26.89% 31.36%
1997 0.0619 29.81% 28.12%
1998 0.0556 40.69% 43.64%
1999 0.0404 9.23% 29.27%
2000 0.0546 -12.77% -6.32%
2001 0.0700 -17.20% 0.83%
2002 0.0814 -2.35% 7.96%
2003 0.0718 -16.15% -15.47%
2004 0.0541 39.18% 42.09%
2005 0.0639 20.70% 28.15%
2006 0.0578 40.33% 32.91%
2007 0.0689 17.00% 33.27%
2008 0.0721 -6.05% -7.42%
2009 0.1032 -33.19% -23.19%
2010 0.0606 38.56% 51.43%
2011 0.0814 12.39% 22.24%
Note: average EPs and subsequent returns sorted by year from
1991 to 2011. Returns are given unweighed and weighed by
market capitalization.
36
Table 16: Average EPs and average returns ac-
cording to company sector
Sector AverageEP Return
Basic Materials 0.0733 7.52%
Consumer Goods 0.0591 7.29%
Consumer Services 0.0721 8.77%
Healthcare 0.0351 20.53%
Industrials 0.0708 10.07%
Oil and Gas 0.0577 21.38%
Technology 0.0506 5.19%
Telecom 0.0945 8.87%
Utilities 0.0709 18.14%
Note: second level sector classification of the Datastream
Global Equity Index hierarchy based on the industry classi-
fication benchmark. Financial companies are excluded. Av-
erage EPs and average returns for each sector are calculated
over the full sample period.
37
Table 17: Average EPs and average returns according to
market value
MV Category Average MV AverageEP Return
Extra Large 3915.06 0.0672 10.61%
Large 352.38 0.0545 12.70%
Medium 110.45 0.0733 8.97%
Small 44.59 0.0683 5.95%
Extra Small 15.47 0.0670 7.93%
Note: companies are divided in quintiles according to market value. Av-
erage Market Values are given in millions EUR. Average EPs and aver-
age returns for each quintile are calculated over the full sample period.
Table 18: Average EPs and average returns sorted by gearing category
Gearing Category Average Gearing AverageEP Return
Very High 51.15% 0.0545 2.69%
High 34.63% 0.0690 9.06%
Medium 24.73% 0.0668 12.88%
Low 14.04% 0.0673 13.61%
Very Low 3.28% 0.0592 9.32%
Note: companies are divided in quintiles according to gearing level. Gearing ratio
is calculated as total debt divided by total assets. Average EPs and average returns
for each quintile are calculated over the full sample period.
38
Table 19: Average EPs and average returns according to Altman Z-score classification
AltmanZ-score Category Average AltmanZ-score AverageEP Return
Distress Zone 0.9372 0.0646 4.81%
Grey Zone 2.3094 0.0817 13.63%
Safe Zone 3.8478 0.0737 25.77%
Note: companies are divided in tertiles according to distress level. Distress level is calculated as in
Equation (4.1). Average EPs and average returns for each tertile are calculated over the full sample
period.
Table 20: Average EPs and average returns sorted
according to idiosyncratic EP
Idiosyncratic Category AverageEP Return
1 (highest IdioEP) 0.2135 12.71%
2 0.1057 22.57%
3 0.0840 7.26%
4 0.0700 9.38%
5 0.0589 7.59%
6 0.0482 13.92%
7 0.0374 5.52%
8 0.0248 9.82%
9 0.0020 -3.40%
10 (lowest IdioEP) 0.0000 15.53%
Note: idiosyncratic EP is calculated as given in Equation (3.4).
They are then sorted and averaged in deciles. Average returns
are calculated over the full sample period.
39
Table 21: Relation between normal EP and adjusted EP using all
weights
Dependent Variable
EP
Variable Coefficient Standard Error P-value
Constant -0.6988 0.1699 <0.0001
NewEP(all weights) 11.7082 2.6124 <0.0001
R2
30.1473%
AdjustedR2
30.0611%
Note: Amount of explanatory power of the new EP statistic using all weights on
the normal EP. We report Newey-West standard errors.
Table 22: Relation between normal EP and adjusted EP using only
significant weights
Dependent Variable
EP
Variable Coefficient Standard Error P-value
Constant -0.5324 0.1215 <0.0001
NewEP(sign. weights) 8.6861 1.7865 <0.0001
R2
40.6487%
AdjustedR2
40.5755%
Note: Amount of explanatory power of the new EP statistic using significant weights
on the normal EP. We report Newey-West standard errors.
40
Table 23: One-year Belgian treasury bill interest rates
Year Interest rate Year Interest rate
1991 9.34% 2002 3.65%
1992 9.49% 2003 2.30%
1993 7.03% 2004 2.12%
1994 5.68% 2005 2.08%
1995 5.88% 2006 3.13%
1996 3.19% 2007 4.13%
1997 3.38% 2008 4.02%
1998 3.98% 2009 1.02%
1999 2.57% 2010 0.66%
2000 4.38% 2011 1.66%
2001 4.63%
41
Table 24: SMB and HML data for the Fama and French three-factor-
model adjustment
Year SMB HML
1991 -4.12% 2.71%
1992 -1.93% 0.81%
1993 -3.55% 0.05%
1994 2.19% 1.31%
1995 0.43% 0.26%
1996 -0.06% -3.69%
1997 5.32% -4.14%
1998 -1.19% 3.21%
1999 1.89% 2.31%
2000 -7.15% 7.80%
2001 1.79% 4.37%
2002 -0.13% 4.09%
2003 -8.98% 9.35%
2004 0.82% -1.24%
2005 1.94% 0.23%
2006 0.35% -1.04%
2007 0.11% 1.02%
2008 3.41% -0.64%
2009 -0.95% 9.93%
2010 -4.16% -7.25%
Note: SMB and HML statistics provided
by Style Research.
42
Individuele Reflectiepaper
Maarten Gielis
1 Inleiding
Ons onderzoek handelt over het identificeren van mogelijke factoren die de koers/winst-
verhouding van een ondernemingen benvloeden. We maken gebruik van Belgische bedri-
jven in de periode van 1990-2011. We onderzoeken of de algemene marktwerking, sector,
bedrijfsgrootte, schuldgraad en gezondheid van een bepaald bedrijf invloed heeft op de
koers/winst-verhouding en op rendement. Met behulp van Datastream halen we de ben-
odigde gegevens af om deze data te sorteren in groepen. Van deze groepen worden gemid-
delde koers/winst-verhoudingen berekend en toegewezen aan de juiste data. Vervolgens
laten we een regressie lopen van deze data met rendement als afhankelijk variabele. Deze
regressie geeft weer welke invloeden belangrijk zijn i.e. welke factoren mogelijk het ren-
dement op investering verklaren. In onze steekproef blijkt dat de tijdsfactor, de bedrijf-
sscore en de idiosyncratische component toegevoegde waarde leveren aan dit model. Aan
de hand van deze cofficinten of gewichten stellen we een nieuwe (gewogen) koers/winst-
verhouding samen. Deze nieuw ontwikkelde ratio wordt vergeleken met de oorspronke-
lijke koers/winst-verhouding. Uit onze gegevens blijkt dat onze nieuw samengestelde
ratio beter rendementen verklaart dan de normale koers/winst-verhouding. Om de win-
stgevendheid van ons onderzoek te testen gaan we in onze steekproef na hoeveel winst
we kunnen maken met de gewone en de nieuwe ratio. Deze portefeuille analyse geeft
als resultaat dat onze gewogen koers/winst-verhouding meer winstgevend is. Als laatste
controle vergelijken we onze rendementen met verwachte rendementen volgens het CAPM
alsook volgens het three-factor-model van Fama en French.
Aangezien ik deze meesterproef samen met Jonas De Keuster heb geschreven, wordt er
1
gevraagd om een individuele reflectiepaper te schrijven. In wat volgt zal ik de beperkingen
van mijn onderzoek toelichten, mogelijke voorstellen geven voor verder onderzoek en
mezelf en ons onderzoek kritisch belichten.
2 Beperkingen van dit onderzoek
Aangezien deze meesterproef een onderzoek is van de Belgische markt, is het juist om te
stellen dat dit een eerste belangrijke beperking is. De Belgische markt is klein en heeft
een relatief jonge historie. Om deze reden waren er minder gegevens beschikbaar dan
verhoopt: voor 1990 waren veel data niet voor handen. Omdat ons onderzoek ook relevant
is voor de praktijk, brengt deze eerste beperking ook een volgende aan. Immers, het is
niet mogelijk de gevonden resultaten te extrapoleren naar andere landen. De gegevens
die zijn afgehaald voor de Belgische markt zijn niet per se representatief voor andere
Europese markten. Een derde beperking is de beschikbaarheid van sommige data in
Datastream. Het gebeurt dat Datastream bepaalde gegevens niet vrijgeeft, beschikbaar
heeft of niet heeft ingevuld. Zo gebruiken we in ons onderzoek de Altman Z-score om
ongezonde bedrijven te vinden. Hoewel de benodigde gegevens voor de berekening van
deze score louter boekhoudkundige gegevens zijn, zijn sommige data in Datastream niet
ingevuld. Ten vierde hadden we - hoewel de Altman Z-score goede resultaten gaf - graag
toegang gehad tot echte scores van ratingbureaus.
3 Mogelijkheden voor verder onderzoek
Deze verhandeling is een vervolg op de studie van Anderson en Brooks (2006) die de
markt van het Verenigd Koninkrijk onderzoekt op factoren die de koers/winst-verhouding
benvloeden. In deze zin repliceren wij hun studie voor de Belgische markt. Bovendien
voegen we nog extra mogelijk invloeden toe aan onze analyse. In hun onderzoek gebruiken
Anderson en Brooks (2006) het effect van tijd, sector en bedrijfsgrootte. Wij voegen
daar nog twee effecten aan toe namelijk schuldgraad en een bedrijfsscore gebaseerd op
de Altman Z-score. Oorspronkelijk was het de bedoeling om scores te gebruiken van
2
ratingbureaus maar deze waren niet voorhanden. Volgens ons model voldoet de Z-score
zeer goed, maar het is een optie om eenzelfde onderzoek uit te voeren met scores van
ratingbureaus. Bovendien zijn er nog vele mogelijk onderliggende factoren die mogelijk de
koers/winst-verhouding benvloeden: bedrijfsleeftijd, solvabiliteit, etc. Het is ook nuttig
voor verder onderzoek om andere markten dan de Britse en de Belgische te onderzoeken.
4 Zelfreflectie
Een meesterproef schrijven is geen gemakkelijke opdracht: het neemt ongelooflijk veel
tijd in, er is een goeie planning vereist en je moet zelf inzichten vergaren in stof waar
je tot dan toe weinig van weet. Aangezien het schrijven van een eindverhandeling geen
gelijkaardige voorganger heeft gehad in mijn academische loopbaan, was het een hele
aanpassing. Onze promotor Prof. Dr. Kristien Smedts heeft ons aan het begin echter
heel goed op weg gezet wat betreft de taal, de manier van schrijven en de volgorde
waarin we ons onderzoek moesten doen. Mede door haar argumenten kozen we er voor
ons onderzoek in het Engels te schrijven, wat achteraf bekeken een zeer goede keuze
geweest is. Ook de manier van schrijven was niet altijd wat verwacht wordt bij het lezen
van een wetenschappelijke paper. Vaak schreven we te verhalend doordat we expliciet
elke stap van ons onderzoek uitlegden. Dankzij de commentaren van de professor leerden
we gaandeweg kort en bondig schrijven.
Een thesis is zo goed als geschreven als je weet wat je wilt doen, hoe je het gaat
doen en welke stappen er voor nodig zijn. Het grote probleem is dat je als leek geen
idee hebt van deze drie zaken. Daarom zijn de eerste paar weken de moeilijkste periode.
Van onze promotor kregen we de raad om allereerst ons model te schrijven. Hoewel dit
voor ons al een stap te ver leek, was dit zeker de beste oplossing. Door eerst aan het
model en de nodige assumpties te werken, krijg je het beste een inzicht in de literatuur en
materie waarmee je gaat werken. Na de goedkeuring van het model konden we overgaan
tot het verzamelen van de benodigde data met behulp van Datastream. Onze inzichten
en analyses bleken fout na commentaar door onze promotor. Door deze slordigheden
moesten we terug naar de bibliotheek om vernieuwde data af te halen. Ik leerde in dit
3
proces om na te denken vooraleer iets uit te voeren. Dit lijkt vanzelfsprekend maar fouten
zijn snel gemaakt en kunnen soms niet meer worden goedgemaakt. Over elke stap werd
nagedacht en gepraat.
Ons onderzoek heeft relatief gunstige resultaten voortgebracht. Veel van onze resul-
taten lagen in lijn van de verwachtingen. Wanneer dit bij een onderzoek niet het geval
is, kan het zijn dat onderzoekers hun resultaten gaan overdrijven. Er wordt soms al snel
gesproken van een effect terwijl de resultaten niet significant zijn. In de media rappor-
teert men vaak resultaten van bepaalde onderzoeken. Tijdens het hele proces van het
schrijven van de thesis leerde ik echter dat dit niet voor de hand ligt. Bepaalde zaken
worden maar wat graag naar de hoofden van het publiek gesmeten. Even vaak moet dit
met een korrel zout worden genomen.
Twee zomers geleden verzekerde ik me al van mijn thesispartner door aan Jonas te
vragen om samen met mij de meesterproef te schrijven. Een thesispartner kiezen is een
moeilijke opdracht. Op voorhand weet je immers niet of de chemie goed gaat zitten.
Vaak genoeg hoor ik dat groepswerken mislukken doordat de personen in de groep niet
met elkaar overweg kunnen. Bij sommige medestudenten in hun thesisjaar is dat zelfs
het geval. Hierdoor kan er veel fout lopen. Dat was bij ons echter helemaal niet het
geval. Mijn samenwerking met hem is zonder enige strubbeling verlopen. Ik had mijn
thesis niet met iemand anders willen schrijven.
5 Aanpak
Aangezien het hele proces redelijk vlot verlopen voor mij, zou ik weinig veranderen aan
de manier waarop ik mijn thesis zou schrijven. Echter, op een bepaald moment was
er een grote tijdsdruk. Dit had kunnen vermeden worden als we wat vroeger waren
begonnen aan onze meesterproef. Over het algemeen heb ik wel genoten van deze ervar-
ing. Helemaal zelf een onderzoek voeren en een wetenschappelijke paper schrijven is iets
nieuws.
Tijdens het schrijven van ons eindwerk viel op hoe weinig we weten over wetenschap-
pelijk schrijven. Vooreerst is het moeilijk om wetenschappelijke papers te lezen en te
4
begrijpen. Bijna alle vakken die we kregen tijdens onze studie waren geschreven hand-
boeken waar alles goed in uitgelegd is en die dus gemakkelijk te lezen zijn. Volgens mij
zou het een meerwaarde zijn moesten meer vakken gebaseerd zijn op wetenschappelijke
papers. Zo leren studenten zulke research papers begrijpen. Een andere mogelijkheid
is om studenten al vroeger kennis te laten maken met wetenschappelijk schrijven. In
bepaalde faculteiten is het verplicht om een bachelorpaper af te leveren. Op deze manier
komen studenten al veel sneller in contact met onderzoek. Zo kan het proces van het
schrijven van een thesis enigszins verlicht worden.
5
THESIS HIR MAARTEN GIELIS

Mais conteúdo relacionado

Destaque

Movimento federalista europeo
Movimento federalista europeoMovimento federalista europeo
Movimento federalista europeoIsabella Ciotti
 
Camera angles
Camera anglesCamera angles
Camera anglescalliem5
 
A man and his disciplines #14
A man and his disciplines #14A man and his disciplines #14
A man and his disciplines #14mariettanaz
 
Optimal Design Brochure-IoT
Optimal Design Brochure-IoTOptimal Design Brochure-IoT
Optimal Design Brochure-IoTSteve Sebree
 
Marietta Men's Ministry 9/14/2015
Marietta Men's Ministry 9/14/2015Marietta Men's Ministry 9/14/2015
Marietta Men's Ministry 9/14/2015mariettanaz
 
Kwesi wilkerson
Kwesi wilkersonKwesi wilkerson
Kwesi wilkersonkdub970
 
A man and his disciplines #1, Spring 2016
A man and his disciplines #1, Spring 2016A man and his disciplines #1, Spring 2016
A man and his disciplines #1, Spring 2016mariettanaz
 
About Me Presentation
About Me PresentationAbout Me Presentation
About Me PresentationWillie K
 
CV nora 2014
CV nora 2014CV nora 2014
CV nora 2014Nora Amil
 
RyanMillerResume
RyanMillerResumeRyanMillerResume
RyanMillerResumeRyan Miller
 
Fys debate research paper
Fys  debate research paper Fys  debate research paper
Fys debate research paper kdub970
 
Fys debate research paper
Fys  debate research paper Fys  debate research paper
Fys debate research paper kdub970
 
Globalization
GlobalizationGlobalization
Globalizationkatyspry2
 
Local History Discovery For Children
Local History Discovery For ChildrenLocal History Discovery For Children
Local History Discovery For ChildrenSarah Trew
 
My Presentation
My PresentationMy Presentation
My PresentationDoctor_E
 
Movimento federalista europeo
Movimento federalista europeoMovimento federalista europeo
Movimento federalista europeoIsabella Ciotti
 
New Regulations on Coal Mining
New Regulations on Coal MiningNew Regulations on Coal Mining
New Regulations on Coal MiningMadelynMcGlynn
 

Destaque (20)

Movimento federalista europeo
Movimento federalista europeoMovimento federalista europeo
Movimento federalista europeo
 
Camera angles
Camera anglesCamera angles
Camera angles
 
A man and his disciplines #14
A man and his disciplines #14A man and his disciplines #14
A man and his disciplines #14
 
Optimal Design Brochure-IoT
Optimal Design Brochure-IoTOptimal Design Brochure-IoT
Optimal Design Brochure-IoT
 
Marietta Men's Ministry 9/14/2015
Marietta Men's Ministry 9/14/2015Marietta Men's Ministry 9/14/2015
Marietta Men's Ministry 9/14/2015
 
Kwesi wilkerson
Kwesi wilkersonKwesi wilkerson
Kwesi wilkerson
 
A man and his disciplines #1, Spring 2016
A man and his disciplines #1, Spring 2016A man and his disciplines #1, Spring 2016
A man and his disciplines #1, Spring 2016
 
About Me Presentation
About Me PresentationAbout Me Presentation
About Me Presentation
 
CV nora 2014
CV nora 2014CV nora 2014
CV nora 2014
 
RyanMillerResume
RyanMillerResumeRyanMillerResume
RyanMillerResume
 
Fys debate research paper
Fys  debate research paper Fys  debate research paper
Fys debate research paper
 
Fys debate research paper
Fys  debate research paper Fys  debate research paper
Fys debate research paper
 
02FEB_2016_GBM_28-31
02FEB_2016_GBM_28-3102FEB_2016_GBM_28-31
02FEB_2016_GBM_28-31
 
Globalization
GlobalizationGlobalization
Globalization
 
PRUEBA
PRUEBAPRUEBA
PRUEBA
 
Local History Discovery For Children
Local History Discovery For ChildrenLocal History Discovery For Children
Local History Discovery For Children
 
My Presentation
My PresentationMy Presentation
My Presentation
 
About Me
About MeAbout Me
About Me
 
Movimento federalista europeo
Movimento federalista europeoMovimento federalista europeo
Movimento federalista europeo
 
New Regulations on Coal Mining
New Regulations on Coal MiningNew Regulations on Coal Mining
New Regulations on Coal Mining
 

Semelhante a THESIS HIR MAARTEN GIELIS

Forecasting Economic Activity using Asset Prices
Forecasting Economic Activity using Asset PricesForecasting Economic Activity using Asset Prices
Forecasting Economic Activity using Asset PricesPanos Kouvelis
 
Persistence performance
Persistence performancePersistence performance
Persistence performancebfmresearch
 
Economy Essay. Sample essay on economic policies and practices
Economy Essay. Sample essay on economic policies and practicesEconomy Essay. Sample essay on economic policies and practices
Economy Essay. Sample essay on economic policies and practicesAshley Arrington
 
Empirical Macroeconomic Model of the Finnish Economy (EMMA)
Empirical Macroeconomic Model of the Finnish Economy (EMMA)Empirical Macroeconomic Model of the Finnish Economy (EMMA)
Empirical Macroeconomic Model of the Finnish Economy (EMMA)Palkansaajien tutkimuslaitos
 
Bachelor THESIS RSM P.J. Heeremans
Bachelor THESIS RSM P.J. HeeremansBachelor THESIS RSM P.J. Heeremans
Bachelor THESIS RSM P.J. HeeremansPatrick Heeremans
 
Are Ideas Getting Harder to Find?. Nicholas Bloom, Charles I. Jones, John Van...
Are Ideas Getting Harder to Find?. Nicholas Bloom, Charles I. Jones, John Van...Are Ideas Getting Harder to Find?. Nicholas Bloom, Charles I. Jones, John Van...
Are Ideas Getting Harder to Find?. Nicholas Bloom, Charles I. Jones, John Van...eraser Juan José Calderón
 
Review Report B
Review Report BReview Report B
Review Report BRuoqing Li
 
Bank income structure and risk: An empirical analysis of European banks
Bank income structure and risk: An empirical analysis of European banksBank income structure and risk: An empirical analysis of European banks
Bank income structure and risk: An empirical analysis of European banksPurwo Adi Wibowo
 
75 european private_equity
75 european private_equity75 european private_equity
75 european private_equityJose Gonzalez
 
Productive efficiency in the Mondragon Cooperatives: Evidence from an econom...
Productive efficiency  in the Mondragon Cooperatives: Evidence from an econom...Productive efficiency  in the Mondragon Cooperatives: Evidence from an econom...
Productive efficiency in the Mondragon Cooperatives: Evidence from an econom...EOI Escuela de Organización Industrial
 
Mamalis_Spyros_Thesis 11.22
Mamalis_Spyros_Thesis 11.22Mamalis_Spyros_Thesis 11.22
Mamalis_Spyros_Thesis 11.22Spyridon Mamalis
 
Size And PE Factor Toward Vietnams Stocks Return
Size And PE Factor Toward Vietnams Stocks ReturnSize And PE Factor Toward Vietnams Stocks Return
Size And PE Factor Toward Vietnams Stocks ReturnTri Ton
 
The role of family involvement in a firm’s performance.pdf
The role of family involvement in a firm’s performance.pdfThe role of family involvement in a firm’s performance.pdf
The role of family involvement in a firm’s performance.pdfHanaTiti
 
Informative Speech Sample Essay. Writing an Informative Speech
Informative Speech Sample Essay. Writing an Informative SpeechInformative Speech Sample Essay. Writing an Informative Speech
Informative Speech Sample Essay. Writing an Informative SpeechFelicia Gonzales
 
This problem set will be due at the start of class on Wednesday,.docx
This problem set will be due at the start of class on Wednesday,.docxThis problem set will be due at the start of class on Wednesday,.docx
This problem set will be due at the start of class on Wednesday,.docxherthalearmont
 

Semelhante a THESIS HIR MAARTEN GIELIS (20)

Forecasting Economic Activity using Asset Prices
Forecasting Economic Activity using Asset PricesForecasting Economic Activity using Asset Prices
Forecasting Economic Activity using Asset Prices
 
Persistence performance
Persistence performancePersistence performance
Persistence performance
 
Economy Essay. Sample essay on economic policies and practices
Economy Essay. Sample essay on economic policies and practicesEconomy Essay. Sample essay on economic policies and practices
Economy Essay. Sample essay on economic policies and practices
 
MA831 EZEKIEL PEETA-IMOUDU DISSO
MA831 EZEKIEL PEETA-IMOUDU DISSOMA831 EZEKIEL PEETA-IMOUDU DISSO
MA831 EZEKIEL PEETA-IMOUDU DISSO
 
Empirical Macroeconomic Model of the Finnish Economy (EMMA)
Empirical Macroeconomic Model of the Finnish Economy (EMMA)Empirical Macroeconomic Model of the Finnish Economy (EMMA)
Empirical Macroeconomic Model of the Finnish Economy (EMMA)
 
Bachelor THESIS RSM P.J. Heeremans
Bachelor THESIS RSM P.J. HeeremansBachelor THESIS RSM P.J. Heeremans
Bachelor THESIS RSM P.J. Heeremans
 
Are Ideas Getting Harder to Find?. Nicholas Bloom, Charles I. Jones, John Van...
Are Ideas Getting Harder to Find?. Nicholas Bloom, Charles I. Jones, John Van...Are Ideas Getting Harder to Find?. Nicholas Bloom, Charles I. Jones, John Van...
Are Ideas Getting Harder to Find?. Nicholas Bloom, Charles I. Jones, John Van...
 
Thesis - Final
Thesis - FinalThesis - Final
Thesis - Final
 
Dissertation Submitted in Partial Fulfilment of the degree of MSc in Internat...
Dissertation Submitted in Partial Fulfilment of the degree of MSc in Internat...Dissertation Submitted in Partial Fulfilment of the degree of MSc in Internat...
Dissertation Submitted in Partial Fulfilment of the degree of MSc in Internat...
 
Rutgers Essay.pdf
Rutgers Essay.pdfRutgers Essay.pdf
Rutgers Essay.pdf
 
Review Report B
Review Report BReview Report B
Review Report B
 
Bank income structure and risk: An empirical analysis of European banks
Bank income structure and risk: An empirical analysis of European banksBank income structure and risk: An empirical analysis of European banks
Bank income structure and risk: An empirical analysis of European banks
 
75 european private_equity
75 european private_equity75 european private_equity
75 european private_equity
 
Productive efficiency in the Mondragon Cooperatives: Evidence from an econom...
Productive efficiency  in the Mondragon Cooperatives: Evidence from an econom...Productive efficiency  in the Mondragon Cooperatives: Evidence from an econom...
Productive efficiency in the Mondragon Cooperatives: Evidence from an econom...
 
Mamalis_Spyros_Thesis 11.22
Mamalis_Spyros_Thesis 11.22Mamalis_Spyros_Thesis 11.22
Mamalis_Spyros_Thesis 11.22
 
Size And PE Factor Toward Vietnams Stocks Return
Size And PE Factor Toward Vietnams Stocks ReturnSize And PE Factor Toward Vietnams Stocks Return
Size And PE Factor Toward Vietnams Stocks Return
 
CASE Network Studies and Analyses 427 - Entrepreneurship and Economic Growth:...
CASE Network Studies and Analyses 427 - Entrepreneurship and Economic Growth:...CASE Network Studies and Analyses 427 - Entrepreneurship and Economic Growth:...
CASE Network Studies and Analyses 427 - Entrepreneurship and Economic Growth:...
 
The role of family involvement in a firm’s performance.pdf
The role of family involvement in a firm’s performance.pdfThe role of family involvement in a firm’s performance.pdf
The role of family involvement in a firm’s performance.pdf
 
Informative Speech Sample Essay. Writing an Informative Speech
Informative Speech Sample Essay. Writing an Informative SpeechInformative Speech Sample Essay. Writing an Informative Speech
Informative Speech Sample Essay. Writing an Informative Speech
 
This problem set will be due at the start of class on Wednesday,.docx
This problem set will be due at the start of class on Wednesday,.docxThis problem set will be due at the start of class on Wednesday,.docx
This problem set will be due at the start of class on Wednesday,.docx
 

THESIS HIR MAARTEN GIELIS

  • 1. The Fundamental Factors of the PE Ratio and Future Returns An Empirical Analysis of the Belgian Stock Market Maarten Gielis Master toegepaste economische wetenschappen: Handelsingenieur Promotor : Prof. dr. K. Smedts 2011 - 2012 FACULTEIT ECONOMIE EN BEDRIJFSWETENSCHAPPEN KATHOLIEKE UNIVERSITEIT LEUVEN
  • 2.
  • 3. THE FUNDAMENTAL FACTORS OF THE PE RATIO AND FUTURE RETURNS AN EMPIRICAL ANALYSIS OF THE BELGIAN STOCK MARKET Maarten Gielis In samenwerking met Jonas De Keuster Verhandeling aangeboden tot het behalen van de graad van Master in toegepaste economische wetenschappen: Handelsingenieur Promotor : Prof. Dr. K. Smedts - 2012 - KATHOLIEKE UNIVERSITEIT LEUVEN FACULTEIT ECONOMIE EN BEDRIJFSWETENSCHAPPEN DEPARTEMENT ACCOUNTANCY, FINANCE & INSURANCE
  • 4. Maarten Gielis in samenwerking met Jonas De Keuster The Fundamental Factors of the PE Ratio and Future Returns An Empirical Analysis of the Belgian Stock Market Abstract: The PE effect is heavily studied in the past 50 years. Anderson and Brooks (2006) find that in the UK the PE multiple is partly determined by outside influences such as the year, the size of a company and the sector in which it is active. This paper replicates this study for the Belgian stock market. A leverage component and a distress component are added. Data are collected for 132 companies from 1990-2011. We find significant relationships between leverage and returns and between distress level and returns. All influences are isolated and we use a regression analysis to determine their explanatory power on returns. We withhold three: the distress level, the year and an idiosyncratic component. A new EP statistic is constructed using these three influences. It performs significantly better than the normal EP ratio in a contrarian investment strategy that is long in value stocks and short in glamour stocks. Last we find that the CAPM is not able to capture the excess returns generated by the value portfolio. On the contrary, the Fama & French three-factor-model captures the excess returns generated by the value portfolio. But it is still not able to predict returns of the glamour portfolio. FACULTEIT ECONOMIE EN BEDRIJFSWETENSCHAPPEN DEPARTEMENT ACCOUNTANCY, FINANCE & INSURANCE KATHOLIEKE UNIVERSITEIT LEUVEN
  • 5. Acknowledgements First of all I would like to thank our promoter Prof. dr. Kristien Smedts for the opportunity to write our master thesis under her supervision. Her comments were always fair and correct. We were motivated to work hard because we knew we would get a lot in return. She set us up with a great plan and helped us with a lot of difficult questions. I deeply appreciate the efforts she has made for us. I could not have reached this point in my life without the unconditional support and love of my mother, my father, my brother Floriaan and my sister Marjolein. My parents always helped and supported me in everything I chose to do. More importantly, they gave me a place to come home. My brother and my sister are two of the most important persons in my life. Floriaan’s determination taught me to fight for something I want. I hope he will keep on making good decisions in his life as he has done so far. Marjolein stayed in the USA a whole year for an exchange. I missed my little sister very much so I can only imagine what she must have felt being away for so long. I can learn a lot from such a kind and brave person like her. The things I have achieved I could not have done without my girlfriend, Ling. She has made me feel special and important every single day over the past five years. I am inspired by the way she works in order to accomplish what she wants. I am thankful for being with her. I am amazed by her as a person. A special thanks to my friend Jonas, who was a magnificent partner to write this thesis with. Not only did we never have problems or discussions, I had a great time with him working on our thesis. It is a sure thing he will achieve great things in life. Last, I would like to thank all my friends in Leuven. They have made these five years unforgettable. I will never forget all the hilarious moments with Wim, Glenn and Jonas. The last two years were an amazing experience with my friends from Semper Potus.
  • 6. The Fundamental Factors of the PE Ratio and Future Returns An Empirical Analysis of the Belgian Stock Market Jonas De Keuster & Maarten Gielis University of Leuven Abstract The PE effect is heavily studied in the past 50 years. Anderson and Brooks (2006) find that in the UK the PE multiple is partly determined by outside influ- ences such as the year, the size of a company and the sector in which it is active. This paper replicates this study for the Belgian stock market. A leverage compo- nent and a distress component are added. Data are collected for 132 companies from 1990-2011. We find significant relationships between leverage and returns and between distress level and returns. All influences are isolated and we use a regres- sion analysis to determine their explanatory power on returns. We withhold three: the distress level, the year and an idiosyncratic component. A new EP statistic is constructed using these three influences. It performs significantly better than the normal EP ratio in a contrarian investment strategy that is long in value stocks and short in glamour stocks. Last we find that the CAPM is not able to capture the excess returns generated by the value portfolio. On the contrary, the Fama & French three-factor-model captures the excess returns generated by the value portfolio. But it is still not able to predict returns of the glamour portfolio. 1
  • 7. 1 Introduction Since Graham and Dodd (1934) and Nicholson (1960) found a significant relationship be- tween multiples and subsequent returns, a lot of research has been done on this subject. The EP ratio of a company can be different depending on the company, the moment in time or the sector in which it operates. Although some limited evidence supports the opposite, most research papers find significant differences between value stocks and glam- our (or growth) stocks i.e. stocks with high and low EP values respectively. Literature finds significantly better returns for a so-called contrarian investment strategy which is long on value stocks and short on glamour stocks. In contrast to the numerous studies on the EP effect, only some research has been done on the decomposition of the EP ratio and the search for the underlying factors which influence this multiple. Graham and Dodd (1934) use several years of earnings to predict returns, as opposed to the normal EP which uses only earnings of the current year. Anderson and Brooks (2006) find that the EP ratio is not only influenced by earnings and price, but also by the market as a whole, the sector in which the company operates and the size of the company. The purpose of this paper is twofold. First, we identify the underlying factors to the EP ratio in the Belgian stock market in order to construct a new EP and second, we use this new EP to investigate whether it outperforms the normal EP in a contrarian investment strategy. Our intention is to make a contribution to the academic research regarding the relationship between multiples and returns. There are several reasons why this research paper adds value. First, to our knowledge, limited research has been done for the Belgian stock market about a possible EP effect i.e. companies with higher EP earn higher returns. Second, it answers to the discussion in the paper of Anderson and Brooks (2006) who search for fundamental factors of the EP ratio. They suggest to do a similar study for other markets than the UK stock market. Also, they add that it is useful to investigate other factors that may influence the EP ratio. By looking at the Belgian stock market and by adding the gearing ratio and company rating we extend their research. Third, our research paper is useful for practical purposes. The EP ratio 2
  • 8. is widely used by investors. An improved version of this multiple could lead to higher returns on investment. Indeed, if our new EP ratio is able to widen the performance difference between returns on value stocks and returns on glamour stocks, a contrarian investment strategy is more profitable. As our study is similar to the research of Anderson and Brooks (2006), the structure of their research paper is closely followed. First, we define the different underlying factors to the EP ratio. For each factor, the data are sorted into groups from which the average value is calculated. We run a regression analysis using these averaged values in order to obtain a weight for each component. These weights are used to construct our new EP. Company/year data are assigned to quintiles according to this new sort statistic. Finally, a portfolio analysis shows the effect on the performance difference between the value and growth quintile of using the new EP in contrast with the actual EP. The remainder of this paper is organized as follows. The next section reviews the related literature. Section 3 describes the different factors which influence the EP ratio and the assumptions with regards to subsequent returns. Section 4 describes the data that are used and presents the empirical results. The following section uses these results to make a portfolio analysis and investigates the profitability of the newly constructed EP. Section 6 concludes. 2 Literature The effect of the earnings-price ratio was first analyzed by Nicholson (1960) who finds that there is a significant relationship between the EP ratio and subsequent returns. His sample consists of 100 common stocks and runs from 1939 until 1959. Nicholson shows that low multiple stocks develop on average lower returns than stocks with a high EP ratio. He argues that this trend occurs because of overconfidence in glamour stocks, of which prices have risen more than earnings. Several studies have shown that this value- glamour-effect is a general phenomenon. McWilliams (1966) finds evidence in a sample from 1952-1964 containing 390 stocks that high EP ratio stocks drastically outperform low EP ratio stocks. 3
  • 9. Basu (1977) argues that the value-glamour-effect provides evidence against the semi- strong form of the efficient market hypothesis. Indeed, if markets are semi-strong efficient, all public information is reflected in stock prices meaning that no fundamental or technical analysis can be used to earn superior gains. For NYSE stocks in the period 1956-1971 he finds that value portfolios outperform glamour stocks. This evidence supports his criticism on the efficient market hypothesis. A study of Reinganum (1981) investigates the relation between the EP ratio and returns and between company size and returns. He concludes that small firms on average give better returns than large firms. He also notes that the size effect is most important and underlying to the EP effect. Accordingly, high EP portfolios earn better returns only because they generally contain more small companies. Basu (1983) also searches evidence for EP and size effects in a dataset ranging from 1963-1980. In his conclusion he does not agree with Reinganum (1981) on their relative importance. After adjusting for risk he finds that the EP effect is present in all size categories and that it is more distinct in small firm categories. So the EP effect remains significant after controlling for size. He also finds that the size effect is only marginal after controlling for the EP effect. He concludes that the relationship between both effects is at least more complicated than assumed by Reinganum (1981). Basu (1983) notes that both might be proxies for a more fundamental determinant of returns. Peavy and Goodman (1983) study a sample of common stocks and try to determine whether a high EP portfolio can outperform the market while controlling for size effect, infrequent trading effect and industry effects. They find clear evidence for excess risk adjusted returns. In a later note they test a sample from 1970-1980 and find size and EP effects. They also find that in general, the EP effect subsumes the size effect and they suggest that firm size might be a proxy for EP. On the other hand, they find that for some portfolios both effects are independent. They conclude that a two factor CAPM is not likely to describe real world stock markets. Later research by Cook and Rozeff (1984) makes another attempt to capture the relation between the size and EP effects. They use a dataset ranging from 1964-1981. They conclude that neither of the above views is consistent with what they find in their results and that both EP and size effects are at work. They agree with Basu (1983) that both effects might arise from a single 4
  • 10. underlying effect. They also find evidence for the January effect. This is a general increase in stock prices during the month of January. Banz and Breen (1986) formulate two main criticisms for all previous research. First, earlier studies are prone to ex-post- selection bias which means that some databases only contain currently viable companies and do not account for merged or bankrupted companies. Second, they are vulnerable to look-ahead bias i.e. the fact that portfolios are made using data that was not accessible by investors at the time. They compare a standard sample of Compustat data with a sample of manually adjusted and unbiased data ranging from 1974-1981. They find that there is a significant difference between both samples. A size effect is still present in the adjusted sample, but the EP effect is no longer significant and seems to be created by both biases. They conclude that it is important to keep in mind that these biases exist when constructing datasets. Jaffe, Keim and Westerfield (1989) investigate the US stock market for a very long sample period from 1951-1986. They find that high EP stocks outperform the low multiple shares, that size and returns are negatively correlated and they find the existence of the January effect. Using a long sample period allows them to conclude that the ambiguous results from previous studies can be attributed to the fact that the different effects vary in strength over time. When considering the entire period they agree with the findings of Cook and Rozeff (1984) that all effects are significant. In Bhandari (1988) leverage is introduced as an explanatory factor for expected common stock returns. He finds a positive relation between debt-equity ratio and return in a 1948-1981 dataset and notes that leverage might be a proxy for risk. Although many studies find significant differences between value and growth portfo- lios, there is no consensus about the reason for this value premium. Fama and French (1992) argue that the basic CAPM model does not capture the variation in market re- turns. They find evidence that in a 1963-1990 sample two factors, namely size and book-to-market equity, can explain the variation in returns associated with size, EP, book-to-market and leverage. They state that if their results are more than chance and if asset pricing is rational, they implicate that size and book-to-market equity must be a proxy for risk. In later research Fama and French (1993, 1995 and 1996) identify five common risk factors in the returns of stocks and bonds. Three of which are stock risk 5
  • 11. factors: the factors related to firm size and book-to-market equity and a third overall market factor. A three-factor-model containing these risk factors is able to capture the variation of average returns on US stocks associated to size, EP, cash flow/price, book-to- market equity, past sales growth, long-term past return, and short-term past return. In contrast, MacKinlay (1995) argues that multifactor models do not explain the deviation from the CAPM. He builds a framework that shows that it is very difficult to empirically detect deviations due to missing risk factors in the CAPM. In his view the value pre- mium is sample specific. Finally he concludes that it might be fruitful to look at other alternative explanations. Yet another view on the value-growth anomaly is proposed by Lakonishok, Shleifer and Vishny (1994). They compare the performance of extreme investment strategies for NYSE and AMEX stocks in a 1968-1990 sample. They draw three main conclusions. First they find that a contrarian investment strategy is most profitable. Second, they argue that investors have consistently overestimated the returns of glamour stocks relative to value stocks. Last, they find that there is no difference in the riskiness of both investment strategies. Thus they disagree with Fama and French (1992) that the value stock anomalies are to be explained by risk. They state that instead they are to be explained by mispricing errors made by investors. De Bondt and Thaler (1985) believe that this premium for contrarian strategies occurs because of naive herd behavior of investors. They base their study on the psychological fact that most people overreact to unexpected and dramatic events. They investigate a sample of data ranging from 1926-1982 and find empirical evidence for their hypothesis. A drop in investor con- fidence for a certain stock causes this stock to become undervalued. Portfolios containing past loser stocks outperform past winner portfolios for up to five years after portfolio for- mation. In De Bondt and Thaler (1987) they confirm these findings out of a 1965-1984 sample. They also find that the winner-loser effect is not a consequence of changes in risk as measured by the CAPM. It is also not primarily a size effect but it is partially a small firm effect. Last they find reversal patterns that confirm the overreaction the- ory. On the contrary, Jegadeesh and Titman (1993) try another strategy that buys past winners and sells past losers. In the period from 1965-1989 they find this momentum strategy to generate significant abnormal returns for up to 12 months. However, part of 6
  • 12. the gains generated in the first year disappear in the following two years. Dreman and Berry (1995) provide additional evidence to support the mispricing theory. They study earnings surprises from 1973-1993 for 1331 companies. They conclude that both positive and negative earnings surprises affect the low EP and high EP stocks in an asymmetric manner favoring high EP stocks. This effect can endure until up to nineteen quarters after the earnings event. In his book Contrarian investment strategies (1998) Dreman gives a set of rules for executing a contrarian investment strategy. He argues that one should invest in out-of-favour stocks because these stocks outperform the market. Dre- man and Lufkin (2000) find additional proof for the psychological overreaction effect. In a 1973-1998 sample of 4721 companies they study whether fundamentals or risk factors induce any of the reversals in the performance of stocks. They show that this is not the case and conclude that the only other explanation is psychological. A large portion of previous research is mainly based on US stock market data. How- ever, numerous papers find evidence of the existence of the value-growth anomaly in other parts of the world. Chan et al. (1991) use 1971-1988 data of the Japanese stock mar- ket to find that value stocks outperform growth stocks. Moreover, they find a negative relationship between company size and returns. Park and Lee (2003) also find a value premium for high EP stocks in the Japanese stock market in 1990-1999. Capaul, Rowley and Sharpe (1993) find similar results for the French, German and Swiss stock markets in a 1981-1992 sample. Brouwer, Van der Put and Veld (1997) investigate four Euro- pean markets namely France, Germany, the UK and the Netherlands from 1982-1993. They find that value strategies outperform growth strategies for all four value variables investigated: EP ratio, cash-flow-to-price ratio, book-to-market ratio and dividend yield. They also find that the value premium cannot be explained by the risk theory alone. Doeswijk (1997) finds empirical evidence of a value premium in the Dutch stock market in 1973-1995. In response to MacKinlay (1995), Fama and French (1998) provide addi- tional out of sample and international evidence of the value premium. They investigate a 1975-1995 dataset containing US, European, Australian and Far East markets. They find that there is a 7.68% yearly resolution between returns on value and growth stocks on a global portfolio. In twelve out of thirteen markets value stocks outperform growth 7
  • 13. stocks. Levis (1989) investigates UK firms in 1956-1985. He finds evidence for a size effect and EP effect. He notes that in his sample the EP effect subsumes the size effect. Levis and Liodakis (2001) use a UK sample from 1986-1997 that contains 3838 companies and find a value premium. They also find evidence that supports the mispricing theory of Lakonishok, Shleifer and Vishny (1994). Gregory, Harris and Michou (2001) find that in the period 1975-1998, for UK companies a contrarian investment strategy is profitable while controlling for size effects. In their paper, Anderson and Brooks (2007) look at UK listed companies. They examine the optimal size for a value and a growth portfo- lio. For this sample, they find the highest returns for small value portfolios. However, this portfolio comes with very high standard deviations. Growth portfolios give as high standard deviations but their performance does not compensate for it. Kelly, McClean and McNamara (2008) study a 1998-2006 sample of the Australian stock market and the result shows the existence of a high EP effect in Australia. A recent study by Risager (2010) examines a value premium on the Danish market. Indeed, he finds that there is a significant valuation difference between a value and a growth portfolio. He argues that this premium exists because of higher capital appreciation and higher dividends for value stocks. In contrast with these studies, some studies find no evidence of value stocks out- performing growth stocks. Kyriazis and Diacogiannis (2007) examine the Athens Stock Exchange in 1995-2002. They find no significant premium for value stocks. Brighi and d’Addona (2007) provide evidence for a size effect in Italy. However, they do not find significant results for the value effect on the Italian stock market. Similarly, Kryzanowski and Zhang (1992) show for the Toronto Stock Exchange that growth stocks do not un- derperform value stocks. Although a lot of research investigates the EP effect as a given phenomenon, only some research has been done about the decomposition of the EP ratio and the search for factors that underlie the EP effect. Graham and Dodd (1934) argue that one cannot assess the value of a company using data of the past year. They use multiple years of earnings to predict returns. Following their reasoning, Anderson and Brooks (2005) ar- gue that multiple years of earnings are better predictors for returns. Using a 1975-2003 8
  • 14. sample of UK listed companies, they modify the EP ratio by averaging EPS over several years. The highest resolution between value and glamour deciles is reached when using an EP which is weighted over the past year and eight years ago. In another paper of Anderson and Brooks (2006), using the same dataset, a new EP ratio for UK stocks is constructed. In a linear regression model they account for market value, sector, time and idiosyncratic effects. After regressing, the weights of these factors are rebalanced following their relative importance. This newly constructed EP gives a better i.e. a higher resolution between a value and a growth portfolio for their sample. Finally An- derson and Brooks (2007) explore the extremes of the EP effect and find that most of the value premium is to be found in those few shares with the most extreme EPs. Jiang and Lee (2009) use a different decomposition for stocks of US stocks in the S&P Index from 1926-2008. They decompose the EP ratio in a cyclical component and a stochas- tic trend component. Using this decomposition, returns can be predicted better. They also find that the cyclical components predict increases in returns whereas the stochastic components predict decreases. Saleh (2007) examines the performance of a contrar- ian investment strategy on the Amman Stock Exchange based on two measures namely earnings-to-price and dividend-to-price. Saleh concludes in his paper that the HML and SMB weights that are proposed by Fama and French (1993) in their three-factor-model, are not significant. Following on this paper, Saleh and Bitar (2012) decompose the EP for all non-financial Jordanian companies in 1980-2002 into a financial earnings effect and an operational earnings effect. Their results do confirm the significance of the weights of the three-factor-model developed by Fama and French. Hence they conclude that SMB and HML factors capture variation in stock returns that is not captured by the market return. 3 Model The main goal of this paper is to identify the various factors that influence the EP ratio. These factors allow us to create a new EP ratio, which is better in predicting returns than the traditional EP statistic. First, we identify the factors that have a significant 9
  • 15. effect on the EP ratio. Next, we assign weights according to their importance. Following the reference paper of Anderson and Brooks (2006) – from here on addressed as AB2006 – a model that contains a year, sector, market value and an idiosyncratic factor gives satisfactory results. Apart from these factors, the current paper includes company rat- ings and the gearing ratio. The weights are determined using a regression model with return as the dependent variable. The estimated parameters from this model are used to construct a new EP statistic: EPi,t = β1Y earEPi,t + β2SizeEPi,t + β3SectorEPi,t + β4GearingEPi,t + β5RatingEPi,t + β6IdioEPi,t 6 j=1 βj (3.1) As an application, we use this newly constructed EP as a sort statistic to make a portfolio analysis. The paper then investigates if this newly constructed statistic gives a better performance i.e. a larger gap between the value and the glamour portfolio. This outcome is compared to the performance using the traditional EP statistic. We use an EP ratio rather than a PE ratio for several reasons. First, it is more intuitive. A higher EP leads to higher subsequent returns, hence a positive relationship. Also, in contrast to the PE, the EP is a percentage. Third, the PE ratio is discontinuous around zero. A time factor is the first variable in the model. As shown in AB2006, average market EPs vary considerably over time. This can be due to changes in tendency of the market or investor confidence, or other economic factors. A single average EP is calculated over all companies for a single year. Empirical studies have shown that there is a significant relationship between market average EP and subsequent returns. Indeed, for the UK stock market AB2006 report a large positive relationship between the averaged yearEP and subsequent returns. Second, and similar to AB2006, the influence of company sector is investigated. It is intuitive to assume that at least part of the differences in EP ratios between companies 10
  • 16. is explained by the sector in which they operate. In their study, AB2006 show that the sector effect on returns is marginal yet always negative. This means a lower sector EP is associated with higher returns. To investigate this factor, an average sector EP is calculated across all years. This is necessary to split up time and size effects. In line with AB2006 we assume that sector, size, gearing and rating effects do not have their own year-dependent variation. This assumption is necessary to divide the time effect from other effects. A size component is also covered by the AB2006 study and they find a negative correlation between market value and EP. Hence, larger companies have lower subsequent returns. This finding is in line with the Fama and French (1998) study and the Dreman (1998) study. This negative effect is attributed to the fact that larger companies suffer less liquidity constraints. Investors are then less affected by liquidity risk when trading these large stocks. By consequence it is easier for large fund managers to invest in these stocks rather than in small company stocks that suffer high liquidity risk. This pushes the price of the large company stocks up and therefore the EP decreases. The size component is taken into account by using size sorted groups according to market value each year. Each group has its own average size EP. These year average size EPs are then averaged over all investigated years. One of the future work proposals in AB2006 is to construct a model that also includes a gearing component. It is plausible that this component has an effect on EP because debt influences investor confidence. A company that has unhealthy i.e. high gearing is vulnerable to shocks and faces problems in attracting additional financial resources. Investors know this. It can affect both stock prices and earnings. Therefore we expect ambiguous results regarding the influence of gearing on EP. Indeed, companies with high gearing tend to be less attractive hence lower prices. On the other hand, companies with high debt cannot pay out much earnings to shareholders which brings down EP. However, we expect a clear negative impact of gearing on returns. The gearing component is included in a similar way as the size component. Companies are sorted into groups according to yearly gearing ratios. From this, a yearly average gearing EP is calculated across each group. This is then averaged across all years for each group. 11
  • 17. The last component that is included is a rating component. Companies are rated by rating agencies to give investors an idea of their financial health. This has an impact on the EP ratio because it has a direct effect on investor confidence. We expect somewhat ambiguous results for the influence of rating on EP. An analogous argument as in the previous paragraph is applicable. We do expect a high positive relationship between rating and returns. The rating component might be strongly correlated with gearing. Again, companies are sorted into groups according to their rating. Next, a yearly average rating EP is calculated which is then averaged across all years for each group. Finally an idiosyncratic component is included to account for company specific effects. Since it is impossible to quantify this component it is extracted from all previous factors. This method is explained below. Having defined all these components, it is now possible to construct a new statistic, which has already been defined in equation (3.1). In this new statistic, βj are the weights determined by the parameters from regressing all components on returns. The response variable is the total yearly return and the explanatory variables are the ones described above: Returni,t = β0 + β1Y earEPi,t + β2SizeEPi,t + β3SectorEPi,t +β4GearingEPi,t + β5RatingEPi,t + β6IdioEPi,t + ui,t (3.2) Regression analysis gives an estimation for the individual βj. To obtain an estimation for β6, we need data for each company/year Idio EP. This is derived from the following multiplicative arrangement - analogous to AB2006: ActualEPi,t AverageEP = Y earEPi,t AverageEP × SizeEPi,t AverageEP × SectorEPi,t AverageEP × GearingEPi,t AverageEP × RatingEPi,t AverageEP × IdioEPi,t AverageEP (3.3) Every IdioEPi,t is then easily derived by rearranging this equation: 12
  • 18. IdioEPi,t = ActualEPi,t × AverageEP5 Y earEPi,t × SizeEPi,t × SectorEPi,t × GearingEPi,t × RatingEPi,t (3.4) 4 Empirical Analysis 4.1 Data We use Datastream to obtain a representative dataset for the Belgian market. The Belgian All-Share Index is composed of the stocks in the Belgian small-cap, mid-cap and large-cap segments. To control for ex-post-selection bias, we include dead companies that were delisted or went bankrupt. Our dataset runs from 1990 to 2011. Data availability for longer historical samples is limited. To control for look-ahead bias, we request data as at the 1st of May of every year. By doing so, a four month gap is created between the year of earnings being studied and portfolio formation. Also, we exclude financial institutions such as banks and holding companies, in line with AB2006. The PE ratio in Datastream is calculated as the price per share divided by the earn- ings per share. For certain company/year data where EPS equals zero, we set the EP equal to zero. Yearly returns are based on the Total Return Index which shows a the- oretical growth in value of a share. We use a general characterization for the different sectors. More specifically, we use the second level sector classification of the Datastream Global Equity Index hierarchy based on the Industry Classification Benchmark. This format yields a classification into ten sectors. Market value on Datastream is the share price multiplied by the number of ordinary shares in issue. The gearing ratio is measured as total debt over total assets. The Altman Z-score is used to proxy for company ratings. This score was developed by Altman (1968) and combines five different financial ratios to determine the likelihood of bankruptcy of a firm. The lower this score, the more likely it is for a firm to go bankrupt. It is calculated as follows: 13
  • 19. AltmanZ = 1.2× WorkingCapital TotalAssets +1.4× RetainedEarnings TotalAssets +3.3× EBIT TotalAssets (4.1) +0.6 × MarketV alueofEquity TotalLiabilities + 0.999 × Sales TotalAssets Working capital is calculated in Datastream as the difference between current assets and current liabilities. Retained earnings are earnings which have not been distributed as dividends to shareholders or allocated to a reserve account. EBIT is calculated by taking the pretax income, adding back interest expense on debt and subtracting interest capital- ized. Net sales represent gross sales and other operating revenue. Total assets represent the sum of total current assets, long term receivables, investment in unconsolidated sub- sidiaries, other investments, net property plant and equipment and other assets. Total liabilities are all short and long term obligations incurred by the company. A CAPM and Fama-French three-factor-model analysis is conducted in one of the following sections. We download risk free rates of Belgian Treasury certificates from Datastream. For the FF-adjustment we request HML and SMB data for the Belgian market through Style Research1 . 4.2 Results In this section we present the descriptive statistics and the results of the regression analysis. First, the influence of different years on EP and returns is shown in Table 15 in the Appendix. The years following on 2000 have negative returns due to the dotcom-bubble. 2009 jumps out with an extremely negative average return because of the subprime crisis. Analysis shows that the average Year EPs are negatively correlated with average returns. More specifically, the correlation coefficient is equal to -0.4718, which can be seen in Table 1. This significant negative relationship is in contrast with AB2006. 1 Style Research is an independent international provider of global investment research and portfolio analysis applications. Their European office is based in London, UK. 14
  • 20. Table 1: Correlations between EP influences and one-year-returns using average values EP Influence Return YearEP -0.4718∗∗ SectorEP -0.3883 MVEP 0.0243 GearinEP 0.8048 AltmanZEP 0.4518 IdioEP 0.3693 Note: Significance levels: ∗ p ≤ .10 ∗∗ p ≤ .05 ∗ ∗ ∗ p ≤ .01 Second, the effect of company sector is investigated, as shown in Table 16 (Appendix). The Industrials, Telecom, Basic Materials and Utilities sectors have high EP ratios. Indeed, these sectors are characterized by low growth and hence low expected earnings. Sector EP categories are negatively correlated with returns. This is in line with the findings of AB2006, who find that sector effects are consistently negative. Our correlation of -0.3883 is not significant (Table 1). This fits the marginal negative correlation that AB2006 find. Next we look at market value. The different market value categories, their EPs and subsequent returns can be found in Table 17. We use five classifications for market value. Using our data, there is no evidence that market value EP categories have an effect on returns (Table 1). The correlation of 0.0243 is not significantly different from zero. However, correlation between individual values of market value EP and subsequent returns is positive and significant (Table 2). 15
  • 21. Table 2: Correlations between EP influences and one-year-returns using individual values EP Influence Return MVEP 0.0711∗∗∗ GearingEP 0.0623∗∗ AltmanZEP 0.0782∗∗ IdioEP 0.0733∗∗ Note: Significance levels: ∗ p ≤ .10 ∗∗ p ≤ .05 ∗ ∗ ∗ p ≤ .01 Gearing is another effect that is investigated. In Table 18 there is no clear distinction between low or high geared companies regarding EP. However, we see a clear increase in returns with lower gearing categories, except for the lowest gearing category. From Table 1 we notice a large positive correlation between average gearing EPs and return of 0.8048. However, this relationship is not significant. When using individual values of gearing EP, we obtain a significantly positive correlation of 0.0623 (Table 2). Moreover, there is a significantly negative relationship between gearing and return (Table 3). This result is intuitive as highly geared companies often perform worse. Table 3: Correlations between different individual influences and one- year-returns Influence Return MV 0.0107 Gearing -0.0938∗∗∗ AltmanZ 0.1493∗∗∗ Note: Significance levels: ∗ p ≤ .10 ∗∗ p ≤ .05 ∗ ∗ ∗ p ≤ .01 16
  • 22. A classification according to the Altman Z-score gives three different categories as is shown in Table 19. Companies in a higher group i.e. with higher Altman Z-scores have higher returns. Higher Altman-Z EP gives significantly higher returns as can be seen in Table 2. Our expectation that healthier companies give better returns is confirmed by a highly significant relationship between Altman Z-scores and subsequent returns (Table 3). The last effect that is taken into account is the idiosyncratic EP effect. This is the remainder of the five averaged effects in order to obtain the actual EP. As is shown in Table 20, data are sorted according to idiosyncratic EP values. There is no clear regularity in the data. The correlation between the EP categories and subsequent returns is 0.3693 but not significant (Table 1). However, using individual values we obtain a positive and significant relationship between EP and returns (Table 2). In Table 4 correlations between the different EP influences are shown. These corre- lations are calculated using individual company/year values. Some variables are signifi- cantly correlated with each other. In particular, Altman-Z EP is highly correlated with other variables. However, there is no perfect multicollinearity. The values are not large enough to cause problems. Table 4: Correlations between different EP influences of individual values YearEP SectorEP MVEP GearingEP AltmanZEP IdioEP YearEP 1 SectorEP -0.0610 1 MVEP -0.0458∗ 0.0077 1 GearingEP -0.0004 0.0469 0.0444 1 AltmanZEP -0.0872∗∗ 0.1273∗∗∗ -0.0160 0.01047∗∗∗ 1 IdioEP 0.0281 -0.0164 -0.0194 -0.0179 -0.0076 1 Note: Significance levels: ∗ p ≤ .10 ∗∗ p ≤ .05 ∗ ∗ ∗ p ≤ .01 17
  • 23. We use the average EPs to find the weights for our model. A regression using all average EPs gives us the following estimation: Table 5: Regression analysis output of all influences on returns Dependent Variable Return Variable Weight Standard Error P-value Constant -0.6726 0.3081 0.0293 YearEP 2.2337 1.1524 0.0529 SectorEP 1.4673 1.3548 0.2791 MVEP -1.7091 2.5328 0.5000 GearingEP 3.3196 3.4474 0.3359 AltmanZEP 5.6326 2.0619 0.0064 IdioEP 0.4829 0.2964 0.1036 R2 2.0867% AdjustedR2 1.3578% Note: regression of different EP influences. Return is the dependent variable. Output reports with Newey-West standard errors. Table 5 shows the estimations for the weights, their respective standard errors and the P-values. This analysis shows that the Altman-Z EP is significant at the 1% level. The constant term is significant at the 5% level and Year EP is significant at the 10% level. The other terms are not significant. To investigate which of these influences add considerate explanatory power, we conduct a stepwise regression. Results can be found in Table 6. 18
  • 24. Table 6: Regression analysis output using stepwise regression analysis Model1 Model2 Model3 Model4 Model5 Model6 C -0.3057∗∗ -0.3398∗∗ -0.5143∗∗∗ -0.707∗∗∗ -0.7850∗∗∗ -0.6726∗∗ AltmanEP 5.7564∗∗∗ 5.7922∗∗∗ 6.1577∗∗∗ 5.9021∗∗∗ 5.6695∗∗ 5.6326∗∗ IdioEP 0.4903∗∗ 0.4783∗∗ 0.4827∗∗ 0.4855∗∗ 0.4829∗∗ YearEP 2.2294∗ 2.2175∗ 2.2694∗ 2.2337∗ GearingEP 3.3200 3.2288 3.3196 SectorEP 1.4614 1.4674 MVEP -1.7091 R2 0.8196% 1.3670% 1.8002% 1.9442% 2.0365% 2.0867% Note: we use a stepwise regression analysis to determine the amount of explanatory power of each factor. The order by which variables are included depends on the size of the correlation between the variable and returns. Cumulative R2 values are reported. Significance levels: ∗ p ≤ .10 ∗∗ p ≤ .05 ∗ ∗ ∗ p ≤ .01 Although Idio EP is not significant according to the regression analysis, it adds a large proportion to the R-squared of the model. Therefore this term is included in our further analysis as well. Altman-Z EP is by far the most important factor in the regression. This model which contains all weights has an explanatory power of 2.0867%. When using only the significant weights to estimate the model, regression analysis gives following estimation: 19
  • 25. Table 7: Regression analysis output of significant influences on returns Dependent Variable Return Variable Weight Standard Error P-value Constant -0.5143 0.1832 0.0051 YearEP 2.2294 1.1801 0.0592 AltmanZEP 6.1577 2.2238 0.0058 IdioEP 0.4793 0.2310 0.0387 R2 1.8002% AdjustedR2 1.4361% Note: this model uses influences withheld by stepwise regression Table 6. Return is the dependent variable. Output reports with Newey-West standard errors. The estimations for the weights, their respective standard errors and the P-values are shown in Table 7. Now the constant term and the Altman-Z EP are significant at the 1% level. IdioEP and YearEP are significant at the 0.05 and 0.1 level respectively. Altman- Z EP still has a very large weight compared to the other variables. This model has an explanatory power of 1.8002%. Moreover, it has a slightly better adjusted R-squared of 1.4361%. For both models there is serial correlation at the 0.05 level so we report Newey-West standard errors. The explanatory power of these two models is not very high, but a model with only the EP as dependent variable has an R-squared of 0.4569% and an adjusted R-squared of 0.3341%. The results for this model are shown in Table 8. The weight for EP in this model is significant at the 10% level. 20
  • 26. Table 8: Regression analysis output using the normal EP ratio Dependent Variable Return Variable Weight Standard Error P-value Constant 0.0778 0.0206 0.0002 EP 0.3278 0.1699 0.0540 R2 0.4569% AdjustedR2 0.3341% Note: this table reports the amount of explanatory power provided by the normal EP ratio on returns. Our newly composed EP ratio is an average value. From Table 21 and Table 22 (Appendix) it is clear that this new EP does very well in explaining the variation in the actual EP. Indeed, when using all weights for constructing a new EP (Table 21), R- squared equals 30.1473%, after using Newey-West standard errors. When we use only the significant weights of the regression, the newly constructed EP explains more than 40% of the actual EP. These results are also corrected for serial correlation and heteroscedasticity with Newey-West standard errors. 21
  • 27. Table 9: Regression analysis output using the new EP ratio with all weights Dependent Variable Return Variable Coefficient Standard Error P-value Constant -0.3400 0.2386 0.1546 NewEP(all weights) 6.7108 3.6239 0.0644 R2 0.4211% AdjustedR2 0.2983% Note: this table reports the amount of explanatory power provided by the new EP statistic on returns. This new EP uses all influences defined in this paper. Our new EP explains about the same amount of variation of returns as the actual EP. R-squared is 0.4211% and 0.4569% respectively (Table 8 and Table 9). In both cases the coefficient of the EP statistic is significant at the 10% level. However, when only significant weights are used to construct the new EP, it explains returns more than four times better than the actual EP. The R-squared value is 1.8002%. Moreover, the coefficient of this new EP statistic is significant at the 0.05% level (Table 10). 22
  • 28. Table 10: Regression analysis output, using the new EP ratio with only significant weights Dependent Variable Return Variable Coefficient Standard Error P-value Constant -0.5143 0.1773 0.0038 NewEP(sign. weights) 8.8654 2.5464 <0.0005 R2 1.8002% AdjustedR2 1.6791% Note: this table reports the amount of explanatory power provided by the new EP statistic on returns. This new EP uses influences withheld by a stepwise linear regression (Table 6). We conclude that a new EP consisting of only the significant weights is best used for the portfolio analysis. From our results we expect that this will gives the largest gap for the contrarian investment strategy. 5 Portfolio Analysis 5.1 Portfolio Formation In the previous section we find that a new EP statistic that weighs for year, distress and idiosyncratic components adds significant explanatory power to predict returns. In this section we investigate whether it is possible to generate a profit using a strategy based on this new EP statistic. We compare a contrarian investment strategy based on the actual EP ratio to one that is based on the new EP statistic. To do so, we first create value and glamour portfolios based on actual EP data. We use the upper EP quintile and lower EP quintile respectively. Both portfolios are rebalanced annually. 23
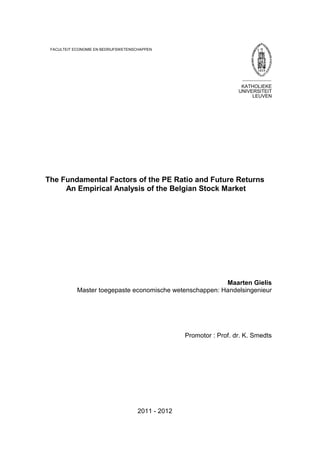
  • 29. Figure 1: Yearly return differences between value and glamour portfolios for actual EP and new EP Figure 1 shows yearly return differences between both portfolios. The value portfolio outperforms the glamour portfolio in thirteen of 21 years. Both portfolios lose in ten out of 21 years. The value portfolio earns on average 5.57% more than the glamour portfolio. The value portfolio incurs a worst loss of 31.84% in 2003 while the glamour portfolio incurs a worst loss of 46.33% in 2009. However, the difference between annual returns is not significant after conducting a paired observations t-test as shown in Table 11. An investment in the value portfolio in 1990 is worth three times more in 2011 than the same investment in the glamour portfolio. 24
  • 30. Table 11: Yearly return difference between value and glamour quintiles for Actual EP and New EP T-test for paired observations Actual EP New EP Value(1) average 10.09% 11.17% Glamour(2) average 4.52% -1.76% (1)-(2) average 5.57% 12.94% p-value 0.3720 0.0499 Note: t-test for paired observations testing for significance of differences between value and glamour portfolios using both the actual EP and new EP statistics. Average values of returns are calculated over the full sample period. Second we create portfolios using our new EP statistic constructed with only signifi- cant weights. These portfolios are created similarly as the portfolios based on the actual EP ratio. Figure 1 also shows the yearly return differences for the new EP statistic. The value portfolio outperforms the glamour portfolio in fourteen of 21 years. The value port- folio loses value in nine out of 21 years while the glamour portfolio does so in thirteen out of 21 years. The value portfolio gains on average 12.94% more than the glamour portfolio. For an investment in both portfolios in 1990, the value portfolio is worth 24 times more than the glamour portfolio after a twenty-year holding period. The worst loss is 30.72% in 2009 for the value portfolio and 59.09% for the glamour portfolio in 2001. When conducting a paired observations t-test, the difference between annual returns of both portfolios is statistically significant at the 5% level (Table 11). 25
  • 31. Figure 2: Yearly return difference between Actual EP and New EP for value and glamour portfolios Figure 2 compares the new EP statistic to the actual EP for both value and glamour strategies. The new EP statistic widens the gap between average annual returns of value and glamour quintiles by 7.37%. The value portfolio using the new EP statistic outperforms the value portfolio using the actual EP ratio by 1.09% on average. However, the difference between annual returns is not statistically significant. Similarly the glamour portfolio using the new EP statistic underperforms the glamour portfolio using the actual EP by 6.28% on average. In this case the difference between annual returns is statistically significant at the 1% level. These results can be found in Table 12. 26
  • 32. Table 12: Yearly return difference between Actual EP and New EP for value and glamour quintiles T-test for paired observations Value Glamour Actual EP(1) average 10.09% 4.52% New EP(2) average 11.17% -1.76% (1)-(2) average -1.09% 6.28% p-value 0.7165 0.0022 Note: t-test for paired observations testing for significance of dif- ferences between the use of the actual EP and the new EP statistics for both value and glamour portfolios. Average values of returns are calculated over the full sample period. 5.2 CAPM comparison The previous section suggests that a contrarian investment strategy is profitable. This section investigates whether this strategy generates excess returns compared to the re- turns expected by the CAPM. We assume the risk-free rate equal to the interest rate on one-year Belgian Treasury bills (Table 23). Using this risk-free rate, we estimate an equation of the following form: Ri,t − Rf = αi + βi × (RM,t − Rf ) + ui,t (5.1) where Ri,t−Rf is equal to the excess return of a certain portfolio and RM,t−Rf equals the excess market return of that year. In an efficient market the expected value of the alpha- coefficient is equal to zero. We analyze excess returns for value and glamour portfolios of the Actual EP and the New EP in turn. The results for the regressions can be found in Table 13. 27
  • 33. Table 13: Estimations for the alpha and beta coefficients using the Actual EP and New EP statistics Actual EP New EP α β R2 α β R2 Re V alue 0.0988∗∗ 0.4246∗∗ 3.77% 0.1352∗∗∗ 0.1447 0.47% Re Glamour -0.0064 0.2082 0.14% -0.0697∗ 0.2082 0.96% Note: CAPM comparison: Regression analyses using equation (5.1). Significance levels: ∗ p ≤ .10 ∗∗ p ≤ .05 ∗ ∗ ∗ p ≤ .01 For the Actual EP as well as for the New EP there is a clear value effect. Indeed, the alpha coefficients for the value portfolios are significantly larger than zero. Portfolios which are composed of value stocks thus have a larger return in excess of market risk. Moreover, when using the New EP, we can see a significantly positive alpha-coefficient for the value portfolio and a significantly negative alpha-coefficient for the growth portfolio. These findings all confirm a value effect in our sample. We conclude that a contrarian strategy based on the new EP multiple generates excess returns without taking additional risk. 5.3 Fama & French three-factor-model correction The previous section shows that the CAPM is not able to capture the excess returns, in line with many previous research. Fama and French (1993) generate a model which is able to capture these excess returns better. We investigate whether the FF three-factor- model captures the excess returns of our portfolios. Again, we assume the risk-free rate equal to the interest rate on one-year Belgian Treasury bills (Table 23). The SMB and HML are data provided by Style Research (Table 24). Ri,t − Rf = αi + βi × (RM,t − Rf ) + bs × SMB + bv × HML + ui,t (5.2) Where Ri,t −Rf is equal to the excess return of a certain stock and RM,t −Rf is equal to 28
  • 34. the excess market return of that year. Analogous to the CAPM, the α parameter is the excess return which is not captured by the risk-adjustment of the FF three-factor-model. Table 14: Estimations for the alpha, beta, bs and bv coefficients use the Actual EP and New EP Actual EP α β bs bv R2 Re V alue -0.0094 1.0301∗∗∗ -2.3570∗ 3.7030∗∗ 11.56% Re Glamour -0.1130∗ 0.6816∗∗ -2.8840∗∗ 3.4927∗∗ 7.92% New EP α β bs bv R2 Re V alue 0.0145 0.8316∗∗∗ -2.4805∗ 4.1716∗∗∗ 10.50% Re Glamour -0.1617∗∗∗ 0.7343∗∗∗ -1.5673 3.2934∗∗ 6.58% Note: Fama and French three-factor-model adjustment: Regression analyses use equation (5.2). Significance levels: ∗ p ≤ .10 ∗∗ p ≤ .05 ∗ ∗ ∗ p ≤ .01 Looking at Table 14, we see that the model developed by Fama and French is better at capturing the excess returns of our portfolios. For the value portfolios all coefficients are significantly different from zero, apart from the alpha-coefficient. For both the Actual EP and the New EP there are no excess returns for the value portfolios. However, the three-factor-model is still not able to capture the significantly negative excess returns of the glamour portfolios. The results from this analysis are contradictory to the conclusion drawn from the CAPM comparison. We note that the R-squared values of CAPM are low while the Fama & French model has higher explanatory power on returns. According to the CAPM, the value strategies generated significant excess returns without taking additional risk. However, when the three-factor-model is used, the additional factors capture the risk and excess returns disappear. Accordingly, the returns on the value portfolio are solely a compensation for risk. However, the Fama & French model is still not able to capture 29
  • 35. the returns generated by the glamour portfolios. A strategy that is short in the glamour portfolio generates significant excess returns. 6 Conclusion Alongside with many other stock market anomalies, the price-earnings effect has been heavily studied over the past 50 years. Anderson and Brooks (2006) find that it is possible to add value using an adjusted EP statistic that accounts for various influences. Their research focuses on the UK stock market. In addition to their work we replicate this study for the Belgian stock market. We use data of 132 Belgian companies from 1990-2011. We correct for survivorship bias and look-ahead bias. We use a model similar to AB2006 to identify the relative importance of influences such as the yearly market EP, the company size, the sector, leverage, the company distress level and an idiosyncratic component. We find a signifi- cantly negative correlation between leverage and subsequent returns. The positive and significant relationship between company distress levels and subsequent returns is even stronger. Our regression analysis withholds three factors that add significant explanatory power to returns namely the distress component, the year component and the idiosyn- cratic component. These factors are used to construct a new EP statistic. This statistic predicts returns more than four times better than the actual EP ratios. We then use this new EP statistic to construct portfolios and compare this investment strategy to the one where we use the actual EP ratios to create contrarian investment portfolios. It appears that the new statistic generates better results. The difference be- tween average annual returns is enlarged by 7.37% from 5.57% to 12.94%. The differences between annual returns of value and glamour portfolios using the new EP statistic are significant. We then investigate whether this strategy is able to generate excess returns compared to expected returns by the CAPM. We find that the value portfolios using the actual and new EP statistics generate significant excess returns. On the other hand, the glamour portfolios underperform the return expected by the CAPM. They do so signif- icantly for the new EP statistic. We conclude that our contrarian investment strategy 30
  • 36. exceeds the returns expected by the CAPM. Last we test whether the Fama & French three-factor-model is able to capture the value premium. No excess returns are gener- ated on the value portfolio while the glamour portfolio underperforms expected returns for both the actual and new EP statistics. 31
  • 37. References [1] E. Altman. Financial Ratios, Discriminant Analysis and the Prediction of Corporate Bankruptcy. Journal of Finance, 23(4):589–609, 1968. [2] K. Anderson and C. Brooks. The Long-Term P/E Ratio. Journal of Business Finance and Accounting, 33(7-8):1063–1068, 2005. [3] K. Anderson and C. Brooks. Decomposing the Price-Earnings Ratio. Journal of Asset Management, 6(6):456–469, 2006. [4] K. Anderson and C. Brooks. Extremes of the P/E Effect. Journal of Investing, 16(1):69–81, 2007. [5] R.W. Banz and W.J. Breen. Sample-Dependent Results Using Accounting and Market Data: Some Evidence. Journal of Finance, 41(4):779–793, 1986. [6] S. Basu. Investment Performance of Common Stocks in Relation to Their Price- Earnings Ratios: A Test of the Efficient Market Hypothesis. Journal of Finance, 32(3):663–682, 1977. [7] S. Basu. The Relationship Between Earnings’ Yield, Market Value and Return for NYSE Common Stocks. Journal of Financial Economics, 12(1):129–156, 1983. [8] L.C. Bhandari. Debt/Equity Ratio and Expected Common Stock Returns: Empiri- cal Evidence. Journal of Finance, 43(2):129–156, 1988. [9] P. Brighi and S. d’Addona. An Empirical Investigation of the Italian Stock Market Based on the Augmented Fama and French Three-Factor Pricing Model. Working Paper, pages 1–24, 2007. [10] I. Brouwer, J. Van Der Put, and C. Veld. Contrarian Investment Strategies in a European Context. Journal of Business Finance and Accounting, 24(9-10):1353– 1366, 1997. 32
  • 38. [11] C. Capaul, I. Rowley, and W.F. Sharpe. International Value and Growth Stock Returns. Financial Analysts Journal, 49(1):27–36, 1993. [12] T.J. Cook and M.S. Rozeff. Size and Earnings/Price Ratio Anomalies: One Effect or Two? The Journal of Financial and Quantitative Analysis, 19(4):449–466, 1984. [13] W.F. De Bondt and R.H. Thaler. Does the Stock Market Overreact? Journal of Finance, 40(3):793–805, 1985. [14] W.F. De Bondt and R.H. Thaler. Further Evidence on Investor Overreaction and Stock Market Seasonality. Journal of Finance, 42(3):557–581, 1987. [15] R.Q. Doeswijk. Contrarian Investment in the Dutch Stock Market. De Economist, 145(4):573–598, 1997. [16] D.N. Dreman. Contrarian Investment Strategies. Chicago: Free Press, 1998. [17] D.N. Dreman and M.A. Berry. Overreaction, Underreaction, and the Low P/E Effect. Financial Analysts Journal, 51(4):21–30, 1995. [18] D.N. Dreman and E.A. Lufkin. Investor Overreaction: Evidence That Its Basis Is Psychological. Journal of Psychology and Financial Markets, 1(1):61–75, 2000. [19] E.F. Fama and K.R. French. The Cross-Section of Expected Stock Returns. Journal of Finance, 47(2):427–465, 1992. [20] E.F. Fama and K.R. French. Common Risk Factors in the Returns of Stocks and Bonds. Journal of Financial Economics, 33(1):3–56, 1993. [21] E.F. Fama and K.R. French. Size and Book-to-Market Factors in Earnings and Returns. Journal of Finance, 50(1):131–155, 1995. [22] E.F. Fama and K.R. French. Multifactor Explanations of Asset Pricing Anomalies. Journal of Finance, 51(1):55–84, 1996. [23] E.F. Fama and K.R. French. Value versus Growth: The International Evidence. Journal of Finance, 53(6):1975–1999, 1998. 33
  • 39. [24] D.A. Goodman and J.W. Peavy. The Interaction of Firm Size and Price-Earnings Ratio on Portfolio Performance. Financial Analysts Journal, 42(1):9–12, 1986. [25] B. Graham and D. Dodd. Security Analysis. New York: McGraw-Hill, 1934. [26] A. Gregory, R.D. Harris, and M. Michou. An Analysis of Contrarian Investment Strategies in the UK. Journal of Business Finance and Accounting, 28(9-10):1193– 1228, 2001. [27] J. Jaffe, D.B. Keim, and R. Westerfield. Earnings Yield, Market Values, and Stock Returns. Journal of Finance, 44(1):135–148, 1989. [28] N. Jegadeesh and S. Titman. Returns to Buying Winners and Selling Losers: Im- plications for Stock Market Efficiency. Journal of Finance, 48(1):65–91, 1993. [29] X. Jiang and B.S. Lee. Do Decomposed Financial Ratios Predict Stock Returns and Fundamentals Better? Working Paper, pages 1–45, 2009. [30] S. Kelly, J. Mclean, and R. McNamara. The Low P/E Effect and Abnormal Returns for Australian Industrial Firms. Working Paper, pages 1–38, 2008. [31] D. Kyriazis and G. Diacogiannis. Testing the Performance of Value Strategies in the Athens Stock Exchange. Applied Financial Economics, 17(18):1511–1528, 2007. [32] J. Lakonishok, A. Schleifer, and R.W. Vishny. Contrarian Investment, Extrapolation and Risk. Journal of Finance, 46(5):1541–1578, 1994. [33] M. Levis. Stock Market Anomalies: A Re-assessment Based on the UK Evidence. Journal of Banking and Finance, 13(4-5):675–696, 1989. [34] M. Levis and M. Liodakis. Contrarian Strategies and Investor Expectations: The UK Evidence. Financial Analysts Journal, 57(5):43–56, 2001. [35] J.D. McWilliams. Earnings and P/E Ratios. Financial Analysts Journal, 22(3):137– 142, 1966. 34
  • 40. [36] S.F. Nicholson. Price-Earnings Ratios. Financial Analysts Journal, 16(4):43–45, 1960. [37] Y.S. Park and J.J. Lee. An Empirical Study on the Relevance of Applying Relative Valuation Models to Investment Strategies in the Japanese Stock Market. Elsevier - Japan and the World Economy, 15(3):331–339, 2003. [38] M.R. Reinganum. An Empirical Study on the Relevance of Applying Relative Val- uation Models to Investment Strategies in the Japanese Stock Market. Journal of Financial Economics, 15(3):331–339, 1981. [39] O. Risager. The Value Premium on the Danish Stock Market. Working Paper, pages 1–25, 2010. [40] W. Saleh. Overreaction: the sensitivity of defining the duration of the formation period. Applied Financial Economics, 17(1):45, 2007. [41] W. Saleh and A. Bitar. Decomposition of Earnings-to-Price (E/P) Effect. Interna- tional Journal of Economics and Finance, 4(1):229–234, 2012. 35
  • 41. Appendix Table 15: Average EPs and subsequent returns sorted by year Year AverageEP Return Weighted Return 1991 0.0593 -0.86% 2.32% 1992 0.0545 -6.20% 4.19% 1993 0.0559 -4.06% 10.03% 1994 0.0438 32.86% 31.86% 1995 0.0530 -7.42% -3.33% 1996 0.0631 26.89% 31.36% 1997 0.0619 29.81% 28.12% 1998 0.0556 40.69% 43.64% 1999 0.0404 9.23% 29.27% 2000 0.0546 -12.77% -6.32% 2001 0.0700 -17.20% 0.83% 2002 0.0814 -2.35% 7.96% 2003 0.0718 -16.15% -15.47% 2004 0.0541 39.18% 42.09% 2005 0.0639 20.70% 28.15% 2006 0.0578 40.33% 32.91% 2007 0.0689 17.00% 33.27% 2008 0.0721 -6.05% -7.42% 2009 0.1032 -33.19% -23.19% 2010 0.0606 38.56% 51.43% 2011 0.0814 12.39% 22.24% Note: average EPs and subsequent returns sorted by year from 1991 to 2011. Returns are given unweighed and weighed by market capitalization. 36
  • 42. Table 16: Average EPs and average returns ac- cording to company sector Sector AverageEP Return Basic Materials 0.0733 7.52% Consumer Goods 0.0591 7.29% Consumer Services 0.0721 8.77% Healthcare 0.0351 20.53% Industrials 0.0708 10.07% Oil and Gas 0.0577 21.38% Technology 0.0506 5.19% Telecom 0.0945 8.87% Utilities 0.0709 18.14% Note: second level sector classification of the Datastream Global Equity Index hierarchy based on the industry classi- fication benchmark. Financial companies are excluded. Av- erage EPs and average returns for each sector are calculated over the full sample period. 37
  • 43. Table 17: Average EPs and average returns according to market value MV Category Average MV AverageEP Return Extra Large 3915.06 0.0672 10.61% Large 352.38 0.0545 12.70% Medium 110.45 0.0733 8.97% Small 44.59 0.0683 5.95% Extra Small 15.47 0.0670 7.93% Note: companies are divided in quintiles according to market value. Av- erage Market Values are given in millions EUR. Average EPs and aver- age returns for each quintile are calculated over the full sample period. Table 18: Average EPs and average returns sorted by gearing category Gearing Category Average Gearing AverageEP Return Very High 51.15% 0.0545 2.69% High 34.63% 0.0690 9.06% Medium 24.73% 0.0668 12.88% Low 14.04% 0.0673 13.61% Very Low 3.28% 0.0592 9.32% Note: companies are divided in quintiles according to gearing level. Gearing ratio is calculated as total debt divided by total assets. Average EPs and average returns for each quintile are calculated over the full sample period. 38
  • 44. Table 19: Average EPs and average returns according to Altman Z-score classification AltmanZ-score Category Average AltmanZ-score AverageEP Return Distress Zone 0.9372 0.0646 4.81% Grey Zone 2.3094 0.0817 13.63% Safe Zone 3.8478 0.0737 25.77% Note: companies are divided in tertiles according to distress level. Distress level is calculated as in Equation (4.1). Average EPs and average returns for each tertile are calculated over the full sample period. Table 20: Average EPs and average returns sorted according to idiosyncratic EP Idiosyncratic Category AverageEP Return 1 (highest IdioEP) 0.2135 12.71% 2 0.1057 22.57% 3 0.0840 7.26% 4 0.0700 9.38% 5 0.0589 7.59% 6 0.0482 13.92% 7 0.0374 5.52% 8 0.0248 9.82% 9 0.0020 -3.40% 10 (lowest IdioEP) 0.0000 15.53% Note: idiosyncratic EP is calculated as given in Equation (3.4). They are then sorted and averaged in deciles. Average returns are calculated over the full sample period. 39
  • 45. Table 21: Relation between normal EP and adjusted EP using all weights Dependent Variable EP Variable Coefficient Standard Error P-value Constant -0.6988 0.1699 <0.0001 NewEP(all weights) 11.7082 2.6124 <0.0001 R2 30.1473% AdjustedR2 30.0611% Note: Amount of explanatory power of the new EP statistic using all weights on the normal EP. We report Newey-West standard errors. Table 22: Relation between normal EP and adjusted EP using only significant weights Dependent Variable EP Variable Coefficient Standard Error P-value Constant -0.5324 0.1215 <0.0001 NewEP(sign. weights) 8.6861 1.7865 <0.0001 R2 40.6487% AdjustedR2 40.5755% Note: Amount of explanatory power of the new EP statistic using significant weights on the normal EP. We report Newey-West standard errors. 40
  • 46. Table 23: One-year Belgian treasury bill interest rates Year Interest rate Year Interest rate 1991 9.34% 2002 3.65% 1992 9.49% 2003 2.30% 1993 7.03% 2004 2.12% 1994 5.68% 2005 2.08% 1995 5.88% 2006 3.13% 1996 3.19% 2007 4.13% 1997 3.38% 2008 4.02% 1998 3.98% 2009 1.02% 1999 2.57% 2010 0.66% 2000 4.38% 2011 1.66% 2001 4.63% 41
  • 47. Table 24: SMB and HML data for the Fama and French three-factor- model adjustment Year SMB HML 1991 -4.12% 2.71% 1992 -1.93% 0.81% 1993 -3.55% 0.05% 1994 2.19% 1.31% 1995 0.43% 0.26% 1996 -0.06% -3.69% 1997 5.32% -4.14% 1998 -1.19% 3.21% 1999 1.89% 2.31% 2000 -7.15% 7.80% 2001 1.79% 4.37% 2002 -0.13% 4.09% 2003 -8.98% 9.35% 2004 0.82% -1.24% 2005 1.94% 0.23% 2006 0.35% -1.04% 2007 0.11% 1.02% 2008 3.41% -0.64% 2009 -0.95% 9.93% 2010 -4.16% -7.25% Note: SMB and HML statistics provided by Style Research. 42
  • 48.
  • 49. Individuele Reflectiepaper Maarten Gielis 1 Inleiding Ons onderzoek handelt over het identificeren van mogelijke factoren die de koers/winst- verhouding van een ondernemingen benvloeden. We maken gebruik van Belgische bedri- jven in de periode van 1990-2011. We onderzoeken of de algemene marktwerking, sector, bedrijfsgrootte, schuldgraad en gezondheid van een bepaald bedrijf invloed heeft op de koers/winst-verhouding en op rendement. Met behulp van Datastream halen we de ben- odigde gegevens af om deze data te sorteren in groepen. Van deze groepen worden gemid- delde koers/winst-verhoudingen berekend en toegewezen aan de juiste data. Vervolgens laten we een regressie lopen van deze data met rendement als afhankelijk variabele. Deze regressie geeft weer welke invloeden belangrijk zijn i.e. welke factoren mogelijk het ren- dement op investering verklaren. In onze steekproef blijkt dat de tijdsfactor, de bedrijf- sscore en de idiosyncratische component toegevoegde waarde leveren aan dit model. Aan de hand van deze cofficinten of gewichten stellen we een nieuwe (gewogen) koers/winst- verhouding samen. Deze nieuw ontwikkelde ratio wordt vergeleken met de oorspronke- lijke koers/winst-verhouding. Uit onze gegevens blijkt dat onze nieuw samengestelde ratio beter rendementen verklaart dan de normale koers/winst-verhouding. Om de win- stgevendheid van ons onderzoek te testen gaan we in onze steekproef na hoeveel winst we kunnen maken met de gewone en de nieuwe ratio. Deze portefeuille analyse geeft als resultaat dat onze gewogen koers/winst-verhouding meer winstgevend is. Als laatste controle vergelijken we onze rendementen met verwachte rendementen volgens het CAPM alsook volgens het three-factor-model van Fama en French. Aangezien ik deze meesterproef samen met Jonas De Keuster heb geschreven, wordt er 1
  • 50. gevraagd om een individuele reflectiepaper te schrijven. In wat volgt zal ik de beperkingen van mijn onderzoek toelichten, mogelijke voorstellen geven voor verder onderzoek en mezelf en ons onderzoek kritisch belichten. 2 Beperkingen van dit onderzoek Aangezien deze meesterproef een onderzoek is van de Belgische markt, is het juist om te stellen dat dit een eerste belangrijke beperking is. De Belgische markt is klein en heeft een relatief jonge historie. Om deze reden waren er minder gegevens beschikbaar dan verhoopt: voor 1990 waren veel data niet voor handen. Omdat ons onderzoek ook relevant is voor de praktijk, brengt deze eerste beperking ook een volgende aan. Immers, het is niet mogelijk de gevonden resultaten te extrapoleren naar andere landen. De gegevens die zijn afgehaald voor de Belgische markt zijn niet per se representatief voor andere Europese markten. Een derde beperking is de beschikbaarheid van sommige data in Datastream. Het gebeurt dat Datastream bepaalde gegevens niet vrijgeeft, beschikbaar heeft of niet heeft ingevuld. Zo gebruiken we in ons onderzoek de Altman Z-score om ongezonde bedrijven te vinden. Hoewel de benodigde gegevens voor de berekening van deze score louter boekhoudkundige gegevens zijn, zijn sommige data in Datastream niet ingevuld. Ten vierde hadden we - hoewel de Altman Z-score goede resultaten gaf - graag toegang gehad tot echte scores van ratingbureaus. 3 Mogelijkheden voor verder onderzoek Deze verhandeling is een vervolg op de studie van Anderson en Brooks (2006) die de markt van het Verenigd Koninkrijk onderzoekt op factoren die de koers/winst-verhouding benvloeden. In deze zin repliceren wij hun studie voor de Belgische markt. Bovendien voegen we nog extra mogelijk invloeden toe aan onze analyse. In hun onderzoek gebruiken Anderson en Brooks (2006) het effect van tijd, sector en bedrijfsgrootte. Wij voegen daar nog twee effecten aan toe namelijk schuldgraad en een bedrijfsscore gebaseerd op de Altman Z-score. Oorspronkelijk was het de bedoeling om scores te gebruiken van 2
  • 51. ratingbureaus maar deze waren niet voorhanden. Volgens ons model voldoet de Z-score zeer goed, maar het is een optie om eenzelfde onderzoek uit te voeren met scores van ratingbureaus. Bovendien zijn er nog vele mogelijk onderliggende factoren die mogelijk de koers/winst-verhouding benvloeden: bedrijfsleeftijd, solvabiliteit, etc. Het is ook nuttig voor verder onderzoek om andere markten dan de Britse en de Belgische te onderzoeken. 4 Zelfreflectie Een meesterproef schrijven is geen gemakkelijke opdracht: het neemt ongelooflijk veel tijd in, er is een goeie planning vereist en je moet zelf inzichten vergaren in stof waar je tot dan toe weinig van weet. Aangezien het schrijven van een eindverhandeling geen gelijkaardige voorganger heeft gehad in mijn academische loopbaan, was het een hele aanpassing. Onze promotor Prof. Dr. Kristien Smedts heeft ons aan het begin echter heel goed op weg gezet wat betreft de taal, de manier van schrijven en de volgorde waarin we ons onderzoek moesten doen. Mede door haar argumenten kozen we er voor ons onderzoek in het Engels te schrijven, wat achteraf bekeken een zeer goede keuze geweest is. Ook de manier van schrijven was niet altijd wat verwacht wordt bij het lezen van een wetenschappelijke paper. Vaak schreven we te verhalend doordat we expliciet elke stap van ons onderzoek uitlegden. Dankzij de commentaren van de professor leerden we gaandeweg kort en bondig schrijven. Een thesis is zo goed als geschreven als je weet wat je wilt doen, hoe je het gaat doen en welke stappen er voor nodig zijn. Het grote probleem is dat je als leek geen idee hebt van deze drie zaken. Daarom zijn de eerste paar weken de moeilijkste periode. Van onze promotor kregen we de raad om allereerst ons model te schrijven. Hoewel dit voor ons al een stap te ver leek, was dit zeker de beste oplossing. Door eerst aan het model en de nodige assumpties te werken, krijg je het beste een inzicht in de literatuur en materie waarmee je gaat werken. Na de goedkeuring van het model konden we overgaan tot het verzamelen van de benodigde data met behulp van Datastream. Onze inzichten en analyses bleken fout na commentaar door onze promotor. Door deze slordigheden moesten we terug naar de bibliotheek om vernieuwde data af te halen. Ik leerde in dit 3
  • 52. proces om na te denken vooraleer iets uit te voeren. Dit lijkt vanzelfsprekend maar fouten zijn snel gemaakt en kunnen soms niet meer worden goedgemaakt. Over elke stap werd nagedacht en gepraat. Ons onderzoek heeft relatief gunstige resultaten voortgebracht. Veel van onze resul- taten lagen in lijn van de verwachtingen. Wanneer dit bij een onderzoek niet het geval is, kan het zijn dat onderzoekers hun resultaten gaan overdrijven. Er wordt soms al snel gesproken van een effect terwijl de resultaten niet significant zijn. In de media rappor- teert men vaak resultaten van bepaalde onderzoeken. Tijdens het hele proces van het schrijven van de thesis leerde ik echter dat dit niet voor de hand ligt. Bepaalde zaken worden maar wat graag naar de hoofden van het publiek gesmeten. Even vaak moet dit met een korrel zout worden genomen. Twee zomers geleden verzekerde ik me al van mijn thesispartner door aan Jonas te vragen om samen met mij de meesterproef te schrijven. Een thesispartner kiezen is een moeilijke opdracht. Op voorhand weet je immers niet of de chemie goed gaat zitten. Vaak genoeg hoor ik dat groepswerken mislukken doordat de personen in de groep niet met elkaar overweg kunnen. Bij sommige medestudenten in hun thesisjaar is dat zelfs het geval. Hierdoor kan er veel fout lopen. Dat was bij ons echter helemaal niet het geval. Mijn samenwerking met hem is zonder enige strubbeling verlopen. Ik had mijn thesis niet met iemand anders willen schrijven. 5 Aanpak Aangezien het hele proces redelijk vlot verlopen voor mij, zou ik weinig veranderen aan de manier waarop ik mijn thesis zou schrijven. Echter, op een bepaald moment was er een grote tijdsdruk. Dit had kunnen vermeden worden als we wat vroeger waren begonnen aan onze meesterproef. Over het algemeen heb ik wel genoten van deze ervar- ing. Helemaal zelf een onderzoek voeren en een wetenschappelijke paper schrijven is iets nieuws. Tijdens het schrijven van ons eindwerk viel op hoe weinig we weten over wetenschap- pelijk schrijven. Vooreerst is het moeilijk om wetenschappelijke papers te lezen en te 4
  • 53. begrijpen. Bijna alle vakken die we kregen tijdens onze studie waren geschreven hand- boeken waar alles goed in uitgelegd is en die dus gemakkelijk te lezen zijn. Volgens mij zou het een meerwaarde zijn moesten meer vakken gebaseerd zijn op wetenschappelijke papers. Zo leren studenten zulke research papers begrijpen. Een andere mogelijkheid is om studenten al vroeger kennis te laten maken met wetenschappelijk schrijven. In bepaalde faculteiten is het verplicht om een bachelorpaper af te leveren. Op deze manier komen studenten al veel sneller in contact met onderzoek. Zo kan het proces van het schrijven van een thesis enigszins verlicht worden. 5