Proposed transit routes in richmond, virginia
•Transferir como DOCX, PDF•
1 gostou•388 visualizações


Recomendados
Recomendados
Mais conteúdo relacionado
Semelhante a Proposed transit routes in richmond, virginia
Semelhante a Proposed transit routes in richmond, virginia (20)
Proposed transit routes in richmond, virginia
- 1. Proposed Transit Routes in Richmond, Virginia: A plan for environmentally responsible economic growth December 17, 2012 By John Bardo and Mackenzie Jarvis
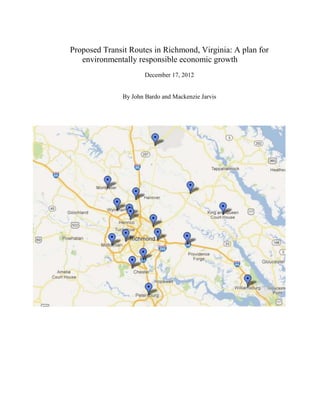
- 2. Introduction: The Richmond, Virginia Metropolitan Area lacks a region-wide alternative pubic transportation system. Many of the region’s jobs are inside the City of Richmond, and as a result many people commute to Richmond from areas distantly outside the city. Automobile is the only mode of transit into and out of Richmond for most of the Metro Area, causing people to spend long hours in traffic emitting harmful pollutants into the atmosphere. In the distant suburbs the average commute time can last as long as 35 minutes. The people, economy and environment of Metro Richmond would benefit from a supplementary transit system running out of the city and into the suburbs. Commuting times would be reduced giving people more time to spend on leisure or completing extra work. Economically disadvantaged towns such as Petersburg would be revitalized with new residents and small businesses attracted by the easy access to the City of Richmond. The City of Richmond’s medium income is 38,266 dollars, and such a project would create new jobs in the construction industry and,upon completion, in the transportation and service industries as well as improve air quality by reducing pollution. The following proposes several public transit lines considering a variety of social, economic and geographic factors to determine precise placement. Metro Richmond already has transportation corridors along major interstate highways (64, 85, and 95). The public transit system will not attempt to change the corridors; rather it will supplement highways to encourage car riders to use public transit instead. In addition, the system would serve areas lacking convenient connection to an interstate highway, allowing people in disconnected areas a reliable connection to the City of Richmond. Stations will be located in small existing towns to encourage development of edge cities rather than sprawling suburbs. Population was the main determinant in deciding where to place a station, however other factors including job location, travel time to work, and median income were also considered. All data was collected from the United States Census Bureau’s 2010-2011 American Community Survey, and the US Census On the Map database. Figure 1.
- 3. Above is a dot density map showing primary places of residence in the Richmond metropolitan area. Most people who live outside the city live along the interstate corridors revealing that in order to discourage people from commuting by car, public transit lines should be built along these corridors. However, there are some exceptions of high concentration areas outside of the highways, particularly in the southwestern corner. The unincorporated areas should not be ignored as the population is spread evenly throughout, and living in a less- developed area should not deny a person access to speedy public transportation to jobs in the City of Richmond. Figure 2. Above is a dot density map showing primary locations of employment for people who live in the Richmond Metropolitan area. Compared to the previous map, this map shows fewer and smaller dots in areas outside the city of Richmond, particularly in the inner southwest corner and along the interstate highways. This reveals that many workers who live outside the city commute inside for work.
- 4. Figure 3. Above is a map that shows the density and location of those workers who are employed in Richmond. Line 1: Richmond, Mechanicsville, Glen Allen, Ashland, and Boling Green
- 5. Number of meidan income Current travel time Richmond Letter Station population (In dollars) to work (In Minutes) Workers A Richmond 205,533 $ 38,266 21.4 28,997 B Mechanicsville 36,348 $ 68,302 23.5 3,075 C Glen Allen 14,774 $ 65,230 19.1 1,476 D Ashland 7,256 $ 46,474 21.3 358 E Boling Green* 28,674 $ 58,707 38.1 622 Line 1 would run adjacent to the I-95 Corridor. All residents along this line currently spend less time than the state average driving to work. Mechanicsville and Glen Allen are two major employment locations outside Richmond and they are the inner Richmond Suburbs. The commute times over 20 minutes for people in these towns are probably due to conventional urban traffic. A rapid public transit system could bring people from Mechanicsville to
- 6. Richmondand vice versa faster than a car. In addition, line 1 serves the towns with the most Richmond workers, most notably Mechanicsville where 3,075 residents work in Richmond. Ashland, which contributes 1,476 people to the Richmond workforce, is the only town outside of Richmond on line 1 with a median income below the national average. Connecting Ashland to Richmond by public transit would expand access to Richmond jobs for people less likely to have cars and reduce commuting time for those with cars. Although Boling Green is a town of just over 1,000 people, it will be included in the transit system because it is relatively far from I-95 and surrounded by rural, sparsely populated land. Public transit to Richmond would bring economic growth and housing development to Boling Green, and attract Richmond commuters who cannot afford to live in Mechanicsville and do not want to spend extended periods of time in the car on the way to work. Line 2: Richmond, Mechanicsville, Aylett,King and Queen Courthouse Current Travel Number of Meidan Income Time to Work (In Richmond Letter Station Population (In Dollars) Minutes) Workers A Richmond 205,533 $ 38,266 21.4 28,997 B Mechanicsville 36,348 $ 68,302 23.5 3,075 C Aylett* 15,981 $ 64,946 35.9 910 King and Queen E Court House* 11,205 $ 46,235 32.8
- 7. Most of the stations on line 2 are located in towns too small to have their own ACS data. However, some of these towns are located far away from interstate highways and in lower income counties. The long drive to Richmond, or anywhere else outside of towns like Aylett, probably explains why many of the average commute times are over 30 minutes. Like in Boling Green, public transit in the Northeast corridor will foster economic growthin the towns where stations are placed. Since this corner of the region is less densely developed with comparatively few Richmond workers (Only 5.6% of residents in King William County work in Richmond), public transit is not as essential as in other corners. However, since there is no data on exact number of workers who commute somewhere other than the City of Richmond, it is possible these commutes are to other towns along the proposed transit line. If line 2 were to be constructed, commuters in rural unincorporated areas would ideally drive to the nearest town, park their cars and ride public transit, but many may find this even less convenient. Line 3: Richmond, Highland Springs, New Kent, West Point, Williamsburg
- 8. Current Travel Number of Median Income Time to Work Richmond Letter Station Population (in Dollars) (In Minutes) Workers A Richmond 205,533 $ 38,266.00 21.4 28,997 B Highland Springs 15,711 $ 40,904.00 21.8 1,794 C New Kent* 18,822 $ 70,590.00 30.6 1,137 D West Point* 15,981 $ 64,946.00 35.9 55 E Williamsburg 14,444 $ 50,794.00 19.5 65 The I-64 corridor east of Richmond is an important commuter route. People who live in King William and New Kent counties spend excessive amounts of time driving to work. This is a comparatively wealthy part of Metro Richmond, especially in New Kent County where the median income is over 70,000. It is likely almost all of these people own cars and drive on I-64. Service to Highland Springs and New Kent are most essential because they contain a substantial amount of Richmond workers. From an economic standpoint, Highland Springs could benefit most because it has one of the lowest median incomes in the region at 40,904 dollars. Williamsburg seems to function as a self-contained, satellite city as most people who live there probably also work there because the average Williamsburg resident only spends 19.5 minutes traveling to work, and only 65 of them (0.4%) work in Richmond. However, rapid transit connecting Richmond to Williamsburg could benefit Williamsburg because its historic area is a tourist destination. Line 4: Richmond, Laurel, Glen Allen, Wyndham and Montpelier.
- 9. Mean Current Travel Time to Job Letter Station Population Median Income Work (Minutes) Count A Richmond, Va 205,533 $ 38,266.00 21.4 28,997 B Laurel, Va 16,024 $ 31,422.00 20.9 1,461 C Glenn Allen, Va 15,021 $ 38,750.00 46.5 1,476 D Wyndham, Va 9,384 $ 87,837.00 46.5 948 E Montpelier, Va 100342* 40,147* Not Available * 7902* This line would supplement the transportation avenues in the Northwestern sector of the Richmond Virginia Metropolitan area between I-95 and I-64. Laurel Virginia was included as a stop because of the population density (16,024) of the area and the large amount of residents who are employed in Richmond (1,461). The cities of Glen Allen and Wyndham were selected as transit stops because residents of both areas have mean travel times to work that over more than double that of the state mean (46.5 minutes each). This drastic increase in commute time constitutes the need of supplementary transportation methods (despite the small size of Wyndham which has only 9,384 residents). The large amounts of residents who are employed in Richmond in each city (1,476 and 948 respectively) also constitutes the need for additional transportation means. Mean travel time data was not available for Montpelier because it is an unincorporated location in Charles City County, Virginia. This location was included because it represents an area of high population density and is a historic destination; it is the location of James Madison’s home and houses a center for Constitution Education (http://www.montpelier.org/center). Line 5: Richmond, Bon Air and Midlothian.
- 10. Mean Current Travel Time Job Count Letter Station Population Median Income to Work (in Minutes) from location A Richnmond, Va 205,533 $ 38,266 21.4 28,997 B Bon Air, Va 16,366 $ 42,953 21.6 1,934 C Midilothian, Va 59,251* 45,744* 23.6* 29,989* This line would supplement the transportation methods in the Southwest Corridor of the Richmond Metropolitan area, which is currently served by I-64 and I-95. While both stops; Bon Air and Midlothian, have mean travel times similar to the state wide mean (21.6 and 23.6 minutes respectively), they represent areas of high population density. Bon Air is suggested because it sits on the edge of the city of Richmond and a transit stop here would alleviate stress on systems within the city of Richmond. Midlothian was selected because the population density of not only the city itself but also the surrounding area (59,251). As seen in Figure 3 the area between Midlothian and the I-64 corridor is incredibly populated. This dense population also leads to an incredibly high rate of employment in Richmond (29,989) and a supplemental transit line would reduce congestion on I-64 and reduce travel time. Line 6: Richmond, Bellwood, Chesterfield and Petersburg.
- 11. Mean Current Travel Time Job Count from Letter Station Population Median Income to Work (in Minutes) location A Richnmond, Va 205,533 $ 38,266.00 21.4 28,997 B Bellwood, Va 5,008 $ 29,472.00 Not available 515 C Chesterield, Va 320,277* 39,894* 25.3* 29989* D Petersburg, Va 32,349 $ 27,571.00 22.2 1,144 This line would serve the South of the Richmond Metropolitan area and supplement I-95. Although Bellwood is home to only 515 Richmond employees and has a relatively small population (5,008) it has been selected as a transit stop because of its convenient location along the proposed transit line and the fact that the instillation of a transit system would encourage the growth and development of the area. Chesterfield is a prime location for a transit stop because of its high population and the fact that Chesterfield is home to the Chesterfield County Air Port and its proximity to the Pocahontas State Park and Forrest. Facilitating travel to this area would reduce travel times to and from the airport and increase use and access to the park. Petersburg is a logical location for a transit stop, regardless of its residents typical travel time (22.2 minutes) and relatively low population density because of the large amount of residents that are employed in Richmond (1,144). Increasing public transit to this area would facilitate traveling to work for those with low incomes and hopefully raise the median income, which is currently lower than that of Richmond. Conclusion All in all 17 new, supplementary transit stops have been proposed for the Richmond Virginia Metropolitan area. Stops are located in Richmond, Mechanicsville, Glen Allen, Ashland Boling Green, Aylett, King and Queen Court House, Highland Springs, New Kent, West Point, Williamsburg, Laurel, Wyndham, Montpelier, Bon Air, Midlothian, Bellwood, Chesterfield and Petersburg Virginia. These proposed transit lines and stops will alleviate congestion on current transportation routes (such as I-64 and I-95), reduce traffic times and provide more environmentally sustainable transportation methods. They would also encourage growth in small rural areas such as Bellwood and Boling Green. The Richmond Metropolitan area would greatly benefit from the proposed supplemental transit systems. *Data is from the county in which the town or Census Designated Place is located