Outlook for Week of September 13, 2021
•
0 gostou•2,836 visualizações

Free weekly newsletter with outlook and brief comments for world stock markets. Weekly reversal levels for stocks, gold, crypto currencies and forex. This method was designed to keep you on the right side of the market most of the time, letting the winners run while avoiding big losses.

Recomendados
Mais conteúdo relacionado
Mais procurados
Mais procurados (19)
Semelhante a Outlook for Week of September 13, 2021
Semelhante a Outlook for Week of September 13, 2021 (20)
Mais de LunaticTrader
Mais de LunaticTrader (20)
Último
Último (20)
Outlook for Week of September 13, 2021
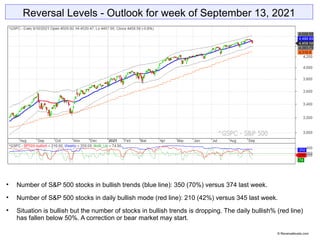
- 1. Reversal Levels - Outlook for week of September 13, 2021 Number of S&P 500 stocks in bullish trends (blue line): 350 (70%) versus 374 last week. Number of S&P 500 stocks in daily bullish mode (red line): 210 (42%) versus 345 last week. Situation is bullish but the number of stocks in bullish trends is dropping. The daily bullish% (red line) has fallen below 50%. A correction or bear market may start. © Reversallevels.com
- 2. ELC: up | BMO: down | Blue snake: up | Repellor: up. BMO turns down, setting us up with another bearish divergence. ELC is approaching the 2018 high. The market is very stretched and a painful correction of the huge move since early 2020 will come eventually. © Reversallevels.com S&P 500 Weekly chart
- 3. Monthly MoM is in the high +8 zone. When it turns down (red) a correction or bear market can start. SwX is green (bullish). © Reversallevels.com S&P 500 Monthly SwX chart
- 4. Monthly MoM is approaching the zero line. May turn back up for another rally. SwX is yellow (neutral, hesitating). © Reversallevels.com Gold Monthly SwX chart
- 5. Weekly MoM is climbing above the zero line. Trying to continue the bull market. SwX stays red (bearish). © Reversallevels.com Bitcoin Weekly SwX chart
- 6. Sell signal for South Africa JOHA. Partial profits signals for Canada TSX. A 22% gain in 43 weeks. Partial profits signals for Netherlands AEX. A 35% gain in 44 weeks. A mixed week. India SENSEX is our current best performer. It is up 58% since its Buy signal 61 weeks ago. World markets © Reversallevels.com
- 7. No major changes this week. For daytraders or swing traders: if you do your trading in the direction of the weekly trend you are likely to do well in the long run. So, try to buy the pullbacks in currencies pairs that are in bullish trends and sell the rallies during bearish trends. Forex & Crypto © Reversallevels.com
- 8. On Twitter: http://twitter.com/lunatictrader1 On Stocktwits: http://stocktwits.com/LunaticTrader Daily blog posts: Reversallevels.com For daily comments and questions you can find us here: © Reversallevels.com Disclaimer Investing in stocks, forex or commodities is risky. No guarantee can be given that the opinions or predictions given in this presentation will be correct. Reversallevels.com cannot in any way be responsible for eventual losses you may incur if you trade based on the given information. Simulated trading programs in general are subject to the fact that they are designed with the benefit of hindsight. No representation is being made that any account will or is likely to achieve profits or losses similar to those shown. Trade at your own risk and responsibility. Subscription service Daily reversal levels for over 3000 stocks and ETF are available by monthly subscription. Discover how you can become a more efficient investor: 1 Month ($22) 6 Months ($110) 1 Year ($199) Comes with full instructions and strategies for using the reversal levels and MoM indicator in your own trading. This is an honest method with limited risk, not a get rich quick formula. Give it a try.