Outlook for Week of October 29, 2018
•
1 gostou•2,402 visualizações

Free weekly newsletter with outlook and brief comments for world stock markets. Weekly reversal levels for stocks, gold and currencies. This method was designed to keep you on the right side of the market most of the time, letting the winners run while avoiding big losses.

Recomendados
Recomendados
Mais conteúdo relacionado
Mais de LunaticTrader
Mais de LunaticTrader (17)
Último
Último (20)
Outlook for Week of October 29, 2018
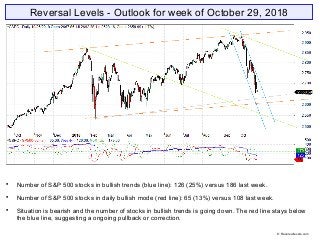
- 1. Reversal Levels - Outlook for week of October 29, 2018 Number of S&P 500 stocks in bullish trends (blue line): 126 (25%) versus 186 last week. Number of S&P 500 stocks in daily bullish mode (red line): 65 (13%) versus 108 last week. Situation is bearish and the number of stocks in bullish trends is going down. The red line stays below the blue line, suggesting a ongoing pullback or correction. © Reversallevels.com
- 2. ELC: down. BMO: down but reaching very oversold levels. Blue snake: down. Bearish with downside penetration of the blue snake. No signs of a bottom yet. Market is testing the Repellor line @2652. A rebound that takes the market back into the Snake could start from this level. This would mean a climb above 2750. © Reversallevels.com S&P 500 Weekly chart
- 3. Sell signal for Nikkei. This leaves only Bovespa in a bullish trend. Bonds TLT continue their bearish trend. Gold is weak bearish and is starting to test its weekly RevL as expected. EURUSD is fully bearish with downward MoM. Oil is giving a Sell signal. This ends a 65 week bullish trend. Wheat is fully bearish. © Reversallevels.com Major indices
- 4. Sell signal for Russia RTS and Dow Industrials. Only a few indexes stay in bullish trends. Nearly all markets have downward MoM and it is quite possible we are headed for an all bearish table for world markets. World markets © Reversallevels.com
- 5. Sell signals for AXP and XOM. 16 stocks bullish, down from 18 last week. Below 20 = weak bull market. See article: Keeping an eye on the Dow stocks If the number of bullish stocks drops below 15 it will confirm a likely bear market. . 30 Dow Jones Industrials stocks © Reversallevels.com
- 6. Buy signal for USDMXN. Sell signal for USDBRL. Partial profits signal for USDCNY. An 8% gain in 21 weeks. Currencies tend to make long trending moves, so we don’t get weekly Buy or Sell signals so often. For daytraders or swing traders: if you do your trading in the direction of the weekly trend you are likely to do well in the long run. So, try to buy the pullbacks in currencies pairs that are in weekly bullish trends and sell the rips during weekly bearish trends. Forex & Crypto © Reversallevels.com
- 7. On Twitter: http://twitter.com/lunatictrader1 On Facebook: https://wwww.facebook/Reversallevels/ On Stocktwits: http://stocktwits.com/LunaticTrader Website: Reversallevels.com For daily comments and questions you can find us here: © Reversallevels.com Disclaimer Investing in stocks, forex or commodities is risky. No guarantee can be given that the opinions or predictions given in this presentation will be correct. Reversallevels.com cannot in any way be responsible for eventual losses you may incur if you trade based on the given information. Simulated trading programs in general are subject to the fact that they are designed with the benefit of hindsight. No representation is being made that any account will or is likely to achieve profits or losses similar to those shown. Trade at your own risk and responsibility. Subscription service Daily reversal levels for over 3000 stocks and ETF are available by monthly subscription. For less than $1 a day you can become a more efficient investor: 1 Month ($22) 6 Months ($110) 1 Year ($199) Comes with full instructions and strategies for using the reversal levels and MoM indicator in your own trading. This is an honest method with limited risk, not a get rick quick formula. Give it a try.