Outlook for Week of November 18, 2019
•
0 gostou•1,795 visualizações

Free weekly newsletter with outlook and brief comments for world stock markets. Weekly reversal levels for stocks, gold and currencies. This method was designed to keep you on the right side of the market most of the time, letting the winners run while avoiding big losses.

Recomendados
Recomendados
Mais conteúdo relacionado
Mais de LunaticTrader
Mais de LunaticTrader (17)
Último
Último (20)
Outlook for Week of November 18, 2019
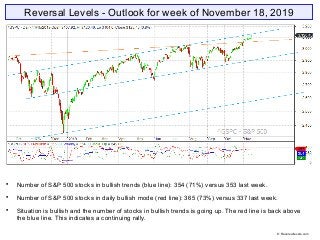
- 1. Reversal Levels - Outlook for week of November 18, 2019 Number of S&P 500 stocks in bullish trends (blue line): 354 (71%) versus 353 last week. Number of S&P 500 stocks in daily bullish mode (red line): 365 (73%) versus 337 last week. Situation is bullish and the number of stocks in bullish trends is going up. The red line is back above the blue line. This indicates a continuing rally. © Reversallevels.com
- 2. ELC: up | BMO: up | Blue snake: up | Repellor: up. Indicators stay bullish. Market stays outside the Blue snake, which strengthens the bullish case. © Reversallevels.com S&P 500 Weekly chart
- 3. All major markets which are in bullish trends with upward MoM. Bonds TLT are in a bearish trend. Gold is weak bullish with downward MoM. Has failed several times to hold the 1500 level. Appears to go for a test of its RevL. EURUSD is in a weak bearish trend. The 1.10 level remains an important hold. Oil is weak bearish and testing its RevL. Wheat is showing a bearish divergence. Changes to weak Bullish. Could be a failing rally. © Reversallevels.com Major indices
- 4. Sell signal for Hong Kong HSI, falling right back after last week’s Buy signal. Sell signal for China SSEC. Most markets are in bullish trends with upward MoM. Just ride the move. There is no edge in trying to fight the trend until MoM starts turning down. World markets © Reversallevels.com
- 5. Buy signal for JNJ. Weak Buy signal for BA. Possible fake-out move. Partial profits signal for AAPL. A 34% gain in 21 weeks. 24 stocks bullish, up from 22 last week. Above 20 = bullish. See article: Keeping an eye on the Dow stocks In major market advances the number of bullish stocks typically goes above 25. That hasn’t happened yet, but we are coming very close. . 30 Dow Jones Industrials stocks © Reversallevels.com
- 6. Bullish divergence for USDCAD. Speculative Buy signal for EURGBP. Currencies tend to make long trending moves, so we don’t get weekly Buy or Sell signals so often. For daytraders or swing traders: if you do your trading in the direction of the weekly trend you are likely to do well in the long run. So, try to buy the pullbacks in currencies pairs that are in weekly bullish trends and sell the rips during weekly bearish trends. Forex & Crypto © Reversallevels.com
- 7. On Twitter: http://twitter.com/lunatictrader1 On Stocktwits: http://stocktwits.com/LunaticTrader Website: Reversallevels.com For daily comments and questions you can find us here: © Reversallevels.com Disclaimer Investing in stocks, forex or commodities is risky. No guarantee can be given that the opinions or predictions given in this presentation will be correct. Reversallevels.com cannot in any way be responsible for eventual losses you may incur if you trade based on the given information. Simulated trading programs in general are subject to the fact that they are designed with the benefit of hindsight. No representation is being made that any account will or is likely to achieve profits or losses similar to those shown. Trade at your own risk and responsibility. Subscription service Daily reversal levels for over 3000 stocks and ETF are available by monthly subscription. For less than $1 a day you can become a more efficient investor: 1 Month ($22) 6 Months ($110) 1 Year ($199) Comes with full instructions and strategies for using the reversal levels and MoM indicator in your own trading. This is an honest method with limited risk, not a get rick quick formula. Give it a try.