Outlook for Week of May 6, 2019
•
1 gostou•2,749 visualizações

Free weekly newsletter with outlook and brief comments for world stock markets. Weekly reversal levels for stocks, gold and currencies. This method was designed to keep you on the right side of the market most of the time, letting the winners run while avoiding big losses.

Recomendados
Recomendados
Mais conteúdo relacionado
Mais de LunaticTrader
Mais de LunaticTrader (17)
Último
Último (20)
Outlook for Week of May 6, 2019
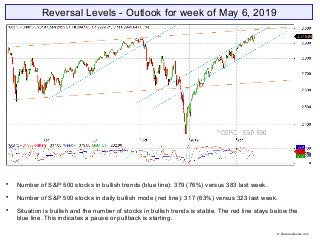
- 1. Reversal Levels - Outlook for week of May 6, 2019 Number of S&P 500 stocks in bullish trends (blue line): 379 (76%) versus 383 last week. Number of S&P 500 stocks in daily bullish mode (red line): 317 (63%) versus 323 last week. Situation is bullish and the number of stocks in bullish trends is stable. The red line stays below the blue line. This indicates a pause or pullback is starting. © Reversallevels.com
- 2. ELC: up | BMO: down | Blue snake: up | Repellor: up. BMO keeps going down, but at a slower pace. Market stays above the upper boundary of the snake, so a sudden pullback within the snake remains a risk. © Reversallevels.com S&P 500 Weekly chart
- 3. Partial profits signal for S&P 500. A 6% gain in 11 weeks. Partial profits signal for Australia AOI. A 5% gain in 12 weeks. Bonds TLT are weak bullish with downward MoM. Gold is weak bullish and is testing its weekly RevL. EURUSD is fully bearish with downward MoM. Oil changes to weak bullish trend. May have peaked. Wheat is fully bearish with downward MoM. © Reversallevels.com Major indices
- 4. Sell signal for Gold stocks XAU. Failed rally. Partial profits signal for Canada TSX. A 6% gain in 13 weeks. Partial profits signal for France CAC40. An 8% gain in 11 weeks. Partial profits signal for Netherlands AEX. A 7% gain in 12 weeks. Partial profits signal for Taiwan TAIEX. A 10% gain in 11 weeks. We get some early partial profits signals. You can use it to reduce exposure, but longer term investors can wait. The average trend lasts for 20 weeks and not rarely more than 50 weeks. World markets © Reversallevels.com
- 5. Weak Buy signal for MRK. Possible fake out move. Sell signal for DWDP. Speculative Buy signal for WBA. Partial profits signal for AAPL. A 14% gain in 7 weeks. Partial profits signal for MSFT. A 21% gain in 15 weeks. Partial profits signal for PG. A 22% gain in 28 weeks. Partial profits signal for V. A 16% gain in 13 weeks. 24 stocks bullish, unchanged from 24 last week. Above 20 = bullish market. See article: Keeping an eye on the Dow stocks . 30 Dow Jones Industrials stocks © Reversallevels.com
- 6. Weak Buy signal for GBPUSD. Possible fake out move. Bearish divergence for USDJPY. Currencies tend to make long trending moves, so we don’t get weekly Buy or Sell signals so often. For daytraders or swing traders: if you do your trading in the direction of the weekly trend you are likely to do well in the long run. So, try to buy the pullbacks in currencies pairs that are in weekly bullish trends and sell the rips during weekly bearish trends. Forex & Crypto © Reversallevels.com
- 7. On Twitter: http://twitter.com/lunatictrader1 On Stocktwits: http://stocktwits.com/LunaticTrader Website: Reversallevels.com For daily comments and questions you can find us here: © Reversallevels.com Disclaimer Investing in stocks, forex or commodities is risky. No guarantee can be given that the opinions or predictions given in this presentation will be correct. Reversallevels.com cannot in any way be responsible for eventual losses you may incur if you trade based on the given information. Simulated trading programs in general are subject to the fact that they are designed with the benefit of hindsight. No representation is being made that any account will or is likely to achieve profits or losses similar to those shown. Trade at your own risk and responsibility. Subscription service Daily reversal levels for over 3000 stocks and ETF are available by monthly subscription. For less than $1 a day you can become a more efficient investor: 1 Month ($22) 6 Months ($110) 1 Year ($199) Comes with full instructions and strategies for using the reversal levels and MoM indicator in your own trading. This is an honest method with limited risk, not a get rick quick formula. Give it a try.