Outlook for Week of May 18, 2020
•
0 gostou•3,278 visualizações

Free weekly newsletter with outlook and brief comments for world stock markets. Weekly reversal levels for stocks, gold and currencies. This method was designed to keep you on the right side of the market most of the time, letting the winners run while avoiding big losses.

Recomendados
Recomendados
Mais conteúdo relacionado
Mais de LunaticTrader
Mais de LunaticTrader (17)
Último
Último (20)
Outlook for Week of May 18, 2020
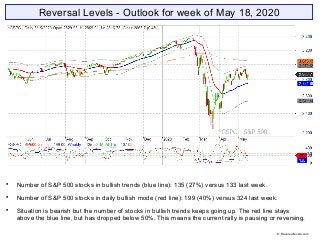
- 1. Reversal Levels - Outlook for week of May 18, 2020 Number of S&P 500 stocks in bullish trends (blue line): 135 (27%) versus 133 last week. Number of S&P 500 stocks in daily bullish mode (red line): 199 (40%) versus 324 last week. Situation is bearish but the number of stocks in bullish trends keeps going up. The red line stays above the blue line, but has dropped below 50%. This means the current rally is pausing or reversing. © Reversallevels.com
- 2. ELC: down | BMO: up | Blue snake: up | Repellor: down. BMO keeps going up but is reaching peak levels. The Blue Snake is also turning up. The weekly Repellor at 2936 is still being tested. © Reversallevels.com S&P 500 Weekly chart
- 3. All major markets stay weak bearish with upward MoM. While most markets are in significant rallies from their March lows it is too early to declare the bear market over Bonds TLT are weak bullish. May have peaked. Gold is fully bullish and adding to its gains. EURUSD changes to fully bearish trend.. Oil is weak bearish and bouncing back towards its weekly RevL at $37.36. © Reversallevels.com Major indices
- 4. MoM is pointing up for all markets. All current signals are profitable (blue), which is always nice to see. Spain IBEX is our current best performer. It is down 27.33% since its Sell signal 11 weeks ago. World markets © Reversallevels.com
- 5. Sell signal for VZ. 9 stocks bullish, down from 10 last week. Below 15 = bear market. See: Keeping an eye on the Dow stocks There is an ongoing risk that this is only a big rebound rally in an ongoing bear market. The majority of Dow stocks remains in bearish trends. Boeing BA is our best performer. A 63.47% decline since its Sell signal 22 weeks ago and the move is ongoing. Avoiding big losses is as important as staying in the winning trades. . 30 Dow Jones Industrials stocks © Reversallevels.com
- 6. No major changes this week. For daytraders or swing traders: if you do your trading in the direction of the weekly trend you are likely to do well in the long run. So, try to buy the pullbacks in currencies pairs that are in bullish trends and sell the rallies during bearish trends. Forex & Crypto © Reversallevels.com
- 7. On Twitter: http://twitter.com/lunatictrader1 On Stocktwits: http://stocktwits.com/LunaticTrader Website: Reversallevels.com For daily comments and questions you can find us here: © Reversallevels.com Disclaimer Investing in stocks, forex or commodities is risky. No guarantee can be given that the opinions or predictions given in this presentation will be correct. Reversallevels.com cannot in any way be responsible for eventual losses you may incur if you trade based on the given information. Simulated trading programs in general are subject to the fact that they are designed with the benefit of hindsight. No representation is being made that any account will or is likely to achieve profits or losses similar to those shown. Trade at your own risk and responsibility. Subscription service Daily reversal levels for over 3000 stocks and ETF are available by monthly subscription. For less than $1 a day you can become a more efficient investor: 1 Month ($22) 6 Months ($110) 1 Year ($199) Comes with full instructions and strategies for using the reversal levels and MoM indicator in your own trading. This is an honest method with limited risk, not a get rick quick formula. Give it a try.