Outlook for Week of February 3, 2020
•
0 gostou•1,023 visualizações

Free weekly newsletter with outlook and brief comments for world stock markets. Weekly reversal levels for stocks, gold and currencies. This method was designed to keep you on the right side of the market most of the time, letting the winners run while avoiding big losses.

Recomendados
Recomendados
Mais conteúdo relacionado
Mais de LunaticTrader
Mais de LunaticTrader (17)
Último
Último (20)
Outlook for Week of February 3, 2020
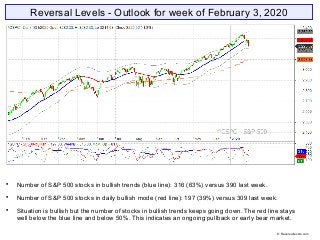
- 1. Reversal Levels - Outlook for week of February 3, 2020 Number of S&P 500 stocks in bullish trends (blue line): 316 (63%) versus 390 last week. Number of S&P 500 stocks in daily bullish mode (red line): 197 (39%) versus 309 last week. Situation is bullish but the number of stocks in bullish trends keeps going down. The red line stays well below the blue line and below 50%. This indicates an ongoing pullback or early bear market. © Reversallevels.com
- 2. ELC: up | BMO: down | Blue snake: up | Repellor: up. BMO turns back down and the market closes below the middle of the Blue Snake. The S&P 500 seems to have peaked for a while, a scenario that would gain significant traction if ELC turns down too. © Reversallevels.com S&P 500 Weekly chart
- 3. Sell signal for FTSE 100. Other major markets are also closing in on their RevL. Bonds TLT are fully bullish with upward MoM. Gold is fully bullish and trying to push above the $1600 barrier. EURUSD is in a young bearish trend. But it’s defending the important 1.10 level. A weekly close above 1.1157 would revert it back to bullish. Oil is in a bearish trend and continuing its decline. © Reversallevels.com Major indices
- 4. Sell signals for France CAC40, Hong Kong HSI, Indonesia JCI, Netherlands AEX, Singapore STI, South Korea KOSPI, Taiwan TAIEX and US Dow Transports. Within a few weeks a lot of markets have given Sell signals and almost all markets have downward MoM. Our current best performer is the Gold stocks index XAU. A 41% gain since its Buy signal 34 weeks ago and the move is ongoing. Be patient with winners. World markets © Reversallevels.com
- 5. Sell signals for CAT, CSCO, MMM and PFE. Partial profits signal for JNJ. An 11% gain in 11 weeks. Partial profits signal for MSFT. A 59% gain in 54 weeks. 17 stocks bullish, down from 21 last week. Below 20 = neutral. See: Keeping an eye on the Dow stocks If the number of bullish stocks drops below 15 the odds of a bear market would rise strongly. Apple remains our best performer. A 55.9% gain since its Buy signal 32 weeks ago and the move is ongoing. It’s very important to let winners run. 80% of our annual profits will typically come from just 20% of our trades. Aka the “pareto principle”. . 30 Dow Jones Industrials stocks © Reversallevels.com
- 6. Buy signal for USDCAD and USDRUB. Sell signal for AUDUSD. Currencies tend to make long trending moves, so we don’t get weekly Buy or Sell signals so often. For daytraders or swing traders: if you do your trading in the direction of the weekly trend you are likely to do well in the long run. So, try to buy the pullbacks in currencies pairs that are in weekly bullish trends and sell the rips during weekly bearish trends. Forex & Crypto © Reversallevels.com
- 7. On Twitter: http://twitter.com/lunatictrader1 On Stocktwits: http://stocktwits.com/LunaticTrader Website: Reversallevels.com For daily comments and questions you can find us here: © Reversallevels.com Disclaimer Investing in stocks, forex or commodities is risky. No guarantee can be given that the opinions or predictions given in this presentation will be correct. Reversallevels.com cannot in any way be responsible for eventual losses you may incur if you trade based on the given information. Simulated trading programs in general are subject to the fact that they are designed with the benefit of hindsight. No representation is being made that any account will or is likely to achieve profits or losses similar to those shown. Trade at your own risk and responsibility. Subscription service Daily reversal levels for over 3000 stocks and ETF are available by monthly subscription. For less than $1 a day you can become a more efficient investor: 1 Month ($22) 6 Months ($110) 1 Year ($199) Comes with full instructions and strategies for using the reversal levels and MoM indicator in your own trading. This is an honest method with limited risk, not a get rick quick formula. Give it a try.