Outlook for Week of August 27, 2018
•
0 gostou•167 visualizações

Free weekly newsletter with outlook and brief comments for world stock markets. Weekly reversal levels for stocks, gold and currencies. This method was designed to keep you on the right side of the market most of the time, letting the winners run while avoiding big losses.

Recomendados
Recomendados
Mais conteúdo relacionado
Mais de LunaticTrader
Mais de LunaticTrader (17)
Último
Último (20)
Outlook for Week of August 27, 2018
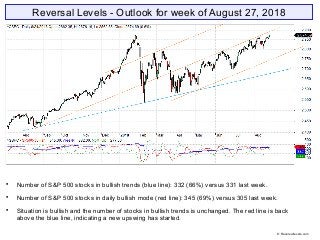
- 1. Reversal Levels - Outlook for week of August 27, 2018 Number of S&P 500 stocks in bullish trends (blue line): 332 (66%) versus 331 last week. Number of S&P 500 stocks in daily bullish mode (red line): 345 (69%) versus 305 last week. Situation is bullish and the number of stocks in bullish trends is unchanged. The red line is back above the blue line, indicating a new upswing has started. © Reversallevels.com
- 2. ELC: up. BMO: turning back up. Blue snake: up. Bullish and trying to charge higher. © Reversallevels.com S&P 500 Weekly chart
- 3. DAX and Bovespa stay in bearish trends. Other major stock indexes are in bullish trends. Bonds TLT are giving a buy signal. Start of a new bullish trend. Gold is weak bearish and keeps giving a Speculative Buy signal. MoM turns up increasing the odds for a rally towards the RevL. EURUSD is showing a bullish divergence. Weak bearish, may have bottomed. Oil is weak bullish and has survived a first test of the RevL. Wheat changes to weak bullish. May go on to test the weekly RevL. © Reversallevels.com Major indices
- 4. Buy signal for South Africa. Speculative Buy signal for China SSEC. Bullish divergence for South Korea KOSPI. The picture for world markets is improving a bit. World markets © Reversallevels.com
- 5. Partial Profits signal for MSFT. A 101% gain in 110 weeks. Partial profits signal for NKE. A 48% gain in 43 weeks. 20 stocks bullish, unchanged from 20 last week. Above 20 = bull market. See article: Keeping an eye on the Dow stocks Stable at 20 bullish stocks. But this number should improve if the bull market is to continue. . 30 Dow Jones Industrials stocks © Reversallevels.com
- 6. No major changes.. Currencies tend to make long trending moves, so we don’t get weekly Buy or Sell signals so often. For daytraders or swing traders: if you do your trading in the direction of the weekly trend you are likely to do well in the long run. So, try to buy the pullbacks in currencies pairs that are in weekly bullish trends and sell the rips during weekly bearish trends. Currencies © Reversallevels.com
- 7. On Twitter: http://twitter.com/lunatictrader1 On Facebook: https://wwww.facebook/Reversallevels/ On Stocktwits: http://stocktwits.com/LunaticTrader Website: Reversallevels.com For daily comments and questions you can find us here: © Reversallevels.com Disclaimer Investing in stocks, forex or commodities is risky. No guarantee can be given that the opinions or predictions given in this presentation will be correct. Reversallevels.com cannot in any way be responsible for eventual losses you may incur if you trade based on the given information. Simulated trading programs in general are subject to the fact that they are designed with the benefit of hindsight. No representation is being made that any account will or is likely to achieve profits or losses similar to those shown. Trade at your own risk and responsibility. Subscription service Daily reversal levels for over 3000 stocks and ETF are available by monthly subscription. For less than $1 a day you can become a more efficient investor: 1 Month ($22) 6 Months ($110) 1 Year ($199) Comes with full instructions and strategies for using the reversal levels and MoM indicator in your own trading. This is an honest method with limited risk, not a get rick quick formula. Give it a try.