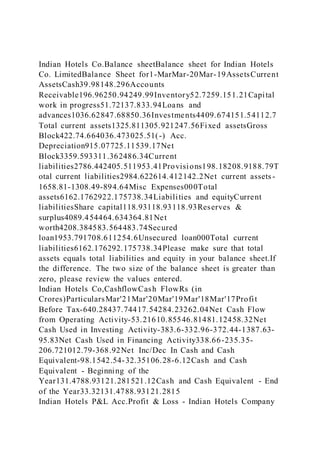
Indian Hotels Co.Balance sheetBalance sheet for Indian Hotels Co. LimitedBalance Sheet for1-MarMar-20Mar-19AssetsCurrent AssetsCash39.98148.296Accounts Receivable196.96250.94249.99Inventory52.7259.151.21Capital work in progress51.72137.833.94Loans and advances1036.62847.68850.36Investments4409.674151.54112.7Total current assets1325.811305.921247.56Fixed assetsGross Block422.74.664036.473025.51(-) Acc. Depreciation915.07725.11539.17Net Block3359.593311.362486.34Current liabilities2786.442405.511953.41Provisions198.18208.9188.79Total current liabilities2984.622614.412142.2Net current assets-1658.81-1308.49-894.64Misc Expenses000Total assets6162.1762922.175738.34Liabilities and equityCurrent liabilitiesShare capital118.93118.93118.93Reserves & surplus4089.454464.634364.81Net worth4208.384583.564483.74Secured loan1953.791708.611254.6Unsecured loan000Total current liabilities6162.176292.175738.34Please make sure that total assets equals total liabilities and equity in your balance sheet.If the difference. The two size of the balance sheet is greater than zero, please review the values entered.
Indian Hotels Co,CashflowCash FlowRs (in Crores)ParticularsMar'21Mar'20Mar'19Mar'18Mar'17Profit Before Tax-640.28437.74417.54284.23262.04Net Cash Flow from Operating Activity-53.21610.85546.81481.12458.32Net Cash Used in Investing Activity-383.6-332.96-372.44-1387.63-95.83Net Cash Used in Financing Activity338.66-235.35-206.721012.79-368.92Net Inc/Dec In Cash and Cash Equivalent-98.1542.54-32.35106.28-6.12Cash and Cash Equivalent - Beginning of the Year131.4788.93121.281521.12Cash and Cash Equivalent - End of the Year33.32131.4788.93121.2815
Indian Hotels P&L Acc.Profit & Loss - Indian Hotels Company Ltd.Rs (in Crores)Mar'21Mar'20Mar'19Mar'18Mar'1712Months12Months12Months12Months12MonthsINCOME:Sales Turnover1133.152743.472780.412583.952401.56Excise Duty00000NET SALES1133.152743.472780.412583.952401.56Other Income110.52134.4190.555.3958.02TOTAL INCOME1243.672877.882870.912639.342459.58EXPENDITURE:Manufacturing Expenses405.28768.3790.25745.89723.49Material Consumed00000Personal Expenses538.64725.07703.85649.61633.24Selling Expenses27.6373.1677.2593.0980.95Administrative Expenses258.5415.88479.62466.56444.2Expenses Capitalised00000Provisions Made00000TOTAL EXPENDITURE1230.051982.412050.971955.151881.88Operating Profit-96.9761.06729.44628.8519.68EBITDA13.62895.47819.94684.19577.7Depreciation203.81203.78169.1151.34151.31Other Write-offs00000EBIT-190.19691.69650.84532.85426.39Interest294.79237.55158.64193.43197.86EBT-484.98454.14492.2339.42228.53Taxes-115.536.33153.84136.46118.86Profit and Loss for the Year-369.48417.81338.36202.96109.67Non Recurring Items-128.94-32.44-81.19-60.9938.16Other Non Cash Adjustments00000Other Adjustments-26.3616.046.535.8-4.65REPORTED PAT-524.78401.41263.7147.77143.18KEY ITEMSPreference Dividend00000Equity Dividend59.4647.7441.8327.57-1.66Equity Dividend (%)5040.1435.1723.18-1.68Shares in Issue (Lakhs)11892.5811892.5811892.5811892.5898 ...
Measures of Dispersion and Variability: Range, QD, AD and SD
Indian Hotels Co.Balance sheetBalance sheet for Indian Hotels Co.
1. Indian Hotels Co.Balance sheetBalance sheet for Indian Hotels
Co. LimitedBalance Sheet for1-MarMar-20Mar-19AssetsCurrent
AssetsCash39.98148.296Accounts
Receivable196.96250.94249.99Inventory52.7259.151.21Capital
work in progress51.72137.833.94Loans and
advances1036.62847.68850.36Investments4409.674151.54112.7
Total current assets1325.811305.921247.56Fixed assetsGross
Block422.74.664036.473025.51(-) Acc.
Depreciation915.07725.11539.17Net
Block3359.593311.362486.34Current
liabilities2786.442405.511953.41Provisions198.18208.9188.79T
otal current liabilities2984.622614.412142.2Net current assets -
1658.81-1308.49-894.64Misc Expenses000Total
assets6162.1762922.175738.34Liabilities and equityCurrent
liabilitiesShare capital118.93118.93118.93Reserves &
surplus4089.454464.634364.81Net
worth4208.384583.564483.74Secured
loan1953.791708.611254.6Unsecured loan000Total current
liabilities6162.176292.175738.34Please make sure that total
assets equals total liabilities and equity in your balance sheet.If
the difference. The two size of the balance sheet is greater than
zero, please review the values entered.
Indian Hotels Co,CashflowCash FlowRs (in
Crores)ParticularsMar'21Mar'20Mar'19Mar'18Mar'17Profit
Before Tax-640.28437.74417.54284.23262.04Net Cash Flow
from Operating Activity-53.21610.85546.81481.12458.32Net
Cash Used in Investing Activity-383.6-332.96-372.44-1387.63-
95.83Net Cash Used in Financing Activity338.66-235.35-
206.721012.79-368.92Net Inc/Dec In Cash and Cash
Equivalent-98.1542.54-32.35106.28-6.12Cash and Cash
Equivalent - Beginning of the
Year131.4788.93121.281521.12Cash and Cash Equivalent - End
of the Year33.32131.4788.93121.2815
Indian Hotels P&L Acc.Profit & Loss - Indian Hotels Company
3. Income110.52134.4190.555.3953.86Total
Income1243.672877.882870.912639.34244 5.11EXPENSESStock
Adjustments00000Raw Material
Consumed107.93235.74246.76232.64219.99Power and
Fuel00000Employee
Expenses538.64725.07703.85649.61633.22Administration and
Selling Expenses00000Research and Development
Expenses00000Expenses Capitalised00000Other
Expenses583.481021.61100.361072.91017.41Provisions
Made00000TOTAL
EXPENSES1230.051982.412050.971955.151870.62Operating
Profit-
96.9761.06729.44628.8520.63EBITDA13.62895.47819.94684.1
9574.49Depreciation203.81203.78169.1151.34151.29EBIT-
190.19691.69650.84532.85423.2Interest294.79237.55158.64193
.43197.86EBT-484.98454.14492.2339.42225.34Taxes-
115.536.33153.84136.46116.91Profit and Loss for the Year-
369.48417.81338.36202.96108.43Extraordinary Items-155.3-
16.4-74.66-55.1933.51Prior Year Adjustment00000Other
Adjustment00000Reported PAT-
524.78401.41263.7147.77141.94KEY ITEMSReserves Written
Back00000Equity
Capital118.93118.93118.93118.9398.93Reserves and
Surplus4089.454464.634364.814275.032668.27Equity Dividend
Rate4050504035Agg. Non-Promoter Share(Lakhs)00000Agg.
Non-Promoter Holding(%)00000Government Share00000Capital
Adequacy Ratio00000EPS(Rs.)NaNNaNNaNNaNNaNRs (in
Crores)
Sheet6
Sheet7
Sheet8
Foundations of Finance
Tenth Edition
Chapter 4
21. current assets59,664
Current ratio===.74
current liabilities80,203
M
M
cash+accounts receivable12,370
Acid-test ratio===0.15
current liabilities80,203
M
M
accounts receivableaccounts receivable
Days in receivables==
annual credit sales
daily credit sales
365
æö
ç÷
èø
5,6145,614
===10.24 days
500,343×.40
548
360
MM
M
M
annual credit sales
Accounts receivable turnover=
accounts receivable
$500,343*.40
==35.65
$5,614
M
X
M
22. inventory
Days in inventory=
annual cost of goods sold
365
$43,783$43,783
42.80days
$373,396
$1,023
365
M
M
M
===
cost of goods sold
Inventory turnover
inven
=
tory
373,396
Inventory turnover==8.53X
43,783
M
M
operating profits
Operating return on assets=
total assets
20,437
0.1010%
204,522
M
M
===
Operating return on assetsoperating prof
it margin total asset turnover
=´
operating profitssales
23. Operating return on assets=×
salestotal assets
operating profits$20,437
Operating profit margin==0.04=4.1%
sales$500,343
M
M
=
sales$500,343
Total asset turnover==2.45X
total assets$204,522
M
M
=
sales$500,343
Fixed assets turnover==4.36X
net fixed assets$114,818
M
M
=
total debt$125,382
Debt ratio==0.61=61%
total assets$204,522
M
M
=
operating profits20,437
Times interest earned==9.38X
interest expense2,178
M
M
=
net income
Return on equity=
total common equity
net income$9,862
24. Return on equity = ==0.125=12.5%
total common equity$79,140
M
M
market price per share$86.00
Price/earnings ratio==26.22X
earnings per share$3.28
=
market price per share86
Price/book ratio==3.27X
equity book value per share26.3
=
.MsftOfcThm_Text1_Fill {
fill:#000000;
}
.MsftOfcThm_MainDark1_Stroke {
stroke:#000000;
}
XYZ Balance sheethttps://formswift.com/sem/static-non-
state/balance-
sheet?utm_source=google&utm_medium=cpc&utm_campaign=st
atic__balance_sheet__search&u_adgroup=balance_sheet__b&u_
device=c&u_country=us&u_producttype=formswiftdotcom&u_p
roduct=balance_sheet&u_landingpage=2019aa9&headline=Creat
e%20A%20Free%20Balance%20Sheet%20Online&u_sitelinkid=
53908&gclid=CjwKCAiA6seQBhAfEiwAvPqu1_O0V5Bqq1LaS
diEDNly0A1-
TCu5KAGyXcThOUkccE2vSJrdXu46fhoCCJUQAvD_BwEForm
SwiftBalance Sheet forAssetsCurrent AssetsCashAccounts
ReceivableInventoryPrepaid expensesNotes receivableOther
current assetsTotal current assetsFixed assetsLong-term
investmentsLandBuildingMachinery and fixturesOther fixed
25. assetsNet fixed assetsOther assetsGoodwillTotal
assetsLiabilities and equityCurrent liabilitiesAccounts
payableAccrued wagesAccrued payroll taxesAccrued employee
benefitsInterest payableShort-term notesCurrent portion of
long-term debtTotal current liabilitiesLong term
liabilityMortgageOther long-term liabilitiesTotal long-term
liabilitiesOwners equityPaid in capitalNet incomeTotal
equityTotal liabilities and equityPlease make sure that total
assets equals total liabilities and equity in your balance sheet.If
the difference. The two size of the balance sheet is greater than
zero, please review the values
entered.https://formswift.com/sem/static-non-state/balance-
sheet?utm_source=google&utm_medium=cpc&utm_campaign=st
atic__balance_sheet__search&u_adgroup=balance_sheet__b&u_
device=c&u_country=us&u_producttype=formswiftdotcom&u_p
roduct=balance_sheet&u_landingpage=2019aa9&headline=Creat
e%20A%20Free%20Balance%20Sheet%20Online&u_sitelinkid=
53908&gclid=CjwKCAiA6seQBhAfEiwAvPqu1_O0V5Bqq1LaS
diEDNly0A1-
TCu5KAGyXcThOUkccE2vSJrdXu46fhoCCJUQAvD_BwE
XYZ Income
https://formswift.com/builder.php?documentType=income-
statement&ses=02e40e6f0896d5eee72a23f4035164fb&key=2679
98070&utm_source=google&utm_medium=cp c&utm_campaign=
static__income_statement__b&u_adgroup=income_statement&u
_device=c&u_country=us&u_producttype=formfindrdotcom&u_
product=income_statement&u_landingpage=2018aa2&headline=
Create+A+Free+Income+Statement+Online&u_sitelinkid=88292
&gclid=CjwKCAiA6seQBhAfEiwAvPqu12OkzuJGHgFIr0e0p1k
4QSP7P48IxMk7ZbGKkIoxS78FimeAIbqC6xoCyvYQAvD_Bw
E#0FormSwiftIncome statementFor the
periodEndedRevenuesProductsLess returns and
allowancesServicesOtherTotal
revenueCostsProductsServicesOtherTotal costGross
profitOperating expensesGen. and administrativeInsuranceNon-
recurringPayroll taxesRentResearch and developmentSalaries
26. and wagesSales and marketingUtilitiesOtherTotal operating
expensesOperating incomeNot operating, or otherInterest
revenueInterest expensesGain on sale of assetsLoss on sales of
assetsGain from legal actionLoss from legal actionDepreciation
and amortizationOther gameOther lossTotal not operating
otherPretax incomeTaxesIncome tax expenseNet income
Sheet3
Sheet4
Sheet5
Sheet6
Sheet7
Sheet8
Sheet1TABLE 21-1 Financial Ratio AnalysisRatioValue Less
Than 1Value = 1Value More Than 1Current ratio = current
assets/current liabilitiesDebts greater than assets; potentially
major problemsDebts and assets are equalAssets greater than
debts; current ratio of 2 is desirableAcid-test ratio = quick
current assets / current liabilitiesCash flow could be a
problemBusiness is in satisfactory conditionBusiness is in good
financial conditionOperating ratio = (COGS+OPERATING
EXPENSES)/NET SALESDesirableMarginalUndesirableGross
profit margin ratio = (Gross profit from sales)/net sales0.25 to
0.40 is industry averageUncommon except for businesses with
low turnover and high investmentUndesirableAsset turnover
ratio = net sales / average total assets0.40 to 1.0 is industry
averageUncommonUncommonTotal debt to total assets ratio =
total liabilities / total assets0.05 to 0.75 is industry averageDebt
ratio is too highDebt ratio is dangerously high
Operations Management Paper Assignment:
Using the LIRN resource, please search for an article/ a business
case study which discusses / involves lean operations.
In 4-5 written pages (not including cover page and
bibliography) please do the following:
(a) Summarize the key points from the article you found.
27. (b) Highlight 3 key lessons you have learned from reading this
article.
(c) Discuss how this article connects with the material in
Lesson 4. (Lesson 4 material “New approaches in Lean
management” also attached.)
*Lesson 4 topic: Lean operations supply the customer with
exactly what the customer wants when the customer wants it,
without waste, through continuous improvement. In this lesson,
we discuss the usefulness of lean operations and just-in-time
operations, and cover what is means to be a lean organization,
and ways to build lean sustainability.
Note: Please make sure to use APA format. Include at least one
direct quote from the article as well as its accompanying
reference (citation).
General Guidelines:
· The cover page and reference page/s are not included in the
above-stated page requirement. These should be in addition to
page requirements.
· Papers need to be formatted in proper APA 7th Edition
style.
· Each paper requires a minimum of at least three outside
peer-reviewed sources for your references (unless stated
otherwise in the guidance above).
o Acceptable/credible sources include: Academic journals and
books, industry journals, and the class textbook.