
Recomendados
Mais conteúdo relacionado
Semelhante a Biocity
Semelhante a Biocity (15)
Biocity
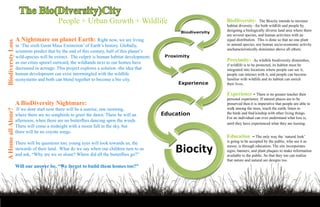
- 1. The Bio(Diversity)City People + Urban Growth + Wildlife BioDiversity- The Biocity intends to increase habitat diversity –for both wildlife and people by designing a biologically diverse land area where there are several species, and human activities with an A Nightmare on planet Earth: Right now, we are living equal distribution. This is done so that no one plant Biodiversty Loss in ‘The sixth Great Mass Extinction’ of Earth’s history. Globally, or animal species, nor human socio-economic activity uncharacteristically dominates above all others. scientists predict that by the end of this century, half of this planet’s wild-species will be extinct. The culprit is human habitat development; as our cities sprawl outward, the wildlands next to our homes have Proximity- As wildlife biodiversity diminishes, if wildlife is to be protected, its habitat must be decreased in acreage. This project explores a solution -the idea that integrated into locations where people can see it, human development can exist intermingled with the wildlife people can interact with it, and people can become ecosystems and both can blend together to become a bio city. familiar with wildlife and its habitat can enrich their lives. Experience - There is no greater teacher then personal experience. If natural places are to be A BioDiversity Nightmare: preserved then it is imperative that people are able to If we dont start now there will be a sunrise, one morning, walk among the trees, touch the earth, listen to A Home all Alone? where there are no songbirds to greet the dawn. There be will an the birds and find kinship with other living things. For an individual can ever understand what loss is, afternoon, when there are no butterflies dancing upon the winds. until they have experienced what they are loosing. There will come a midnight with a moon full in the sky, but there will be no coyote songs. Education - The only way the ‘natural look’ There will be questions too; young eyes will look towards us, the is going to be accepted by the public, who see it as messy, is through education. The site incorporates stewards of their land. What do we say when our children turn to us signs, banners, and plant plaques to make information and ask, “Why are we so alone? Where did all the butterflies go?” available to the public. So that they too can realize that nature and natural are designs too. Will our answer be, “We forgot to build them homes too?”
- 2. Pinal County, Az Pinal County, Riparian Network Phoenix North Branch of the Santa Cruze Wash Trekell Rd 10 Pinal Ca sa Gr an Rodeo de Tucson M ar ac op Kortsen Rd aH igh wa y Arizona has a growing problem: 10 Arizona literally has a problem with growth, the state has grown from 5.1 Million in 2000 and is projected to be at 16 Million by 2050, the vast majority of that growth has been in the Urban Study Area Pinal County Arizona -Urban Sunbelt Corridor- SunBelt Corridor. Pinal County, the project site, sits directly in the middle of all this growth and is Riparian Network Counties of: Cochise > Pinal > Pima > Maracopa one of the fastest growing counties within Arizona with an 11% growth rate. River Network San pedro > Gila > N Branch Santa Cruze Wash > Santa Rosa For wildlife, this loss of riparian habitat will put increasing pressure on at least 120 species of concern within Arizona.
- 3. The problem: A ecological history - and the story of development, water removal, and loss of riparian habitat Riparian Conditions Pre 1800 Dominant Water Use: homestead with small farms 80 percent of Arizona Wildlife lives in this riparian habitat Conditions of River water: perennial river Channel condition: Semi-natural riparian condition, 90 percent loss of functional riparian habitat perennial river condition. Vegetation condition: Water Cottonwood Willow Mesquite Bosque Desert-Scrub Riparian Conditions 1880- 1912 Dominant Water Use: Large agriculture farms - Tucson industrialization (1880) removes water Conditions of River water:1900 - perennial rivers where the water no longer flowed. Channel condition: Channelized to the unconfined aquifer Vegetation condition: Mesquite Bosque Desert-Scrub Cottonwood Willow Water Riparian Conditions 1912 -1940 Dominant Water Use: Industrial farms, Pinal County Growth Conditions of River water: No surface water- water levels at 20’-30’ below the surface in confined aquifer Channel condition: Widening channels due to increased stormwater flows Vegetation condition: Desert-Scrub Mesquite Bosque Cottonwood Willow Riparian Conditions 1960 -2010 Dominant Water Use: Industrial farms, Pinal County Growth Conditions of River water: No surface water- water levels at 30’- 50’ below the surface in artesian aquifer Channel condition: Widened, eroded, 90% loss of habi- tat space Vegetation condition: Desert-Scrub Mesquite Bosque Cottonwood Willow
- 4. The problem: An urban history- the story of development, roadways and wildlife fragmentation 1930 90 percent loss of functional riparian habitat as we break up the landscape into a thousand tiny bits Fragmentation 1950 Edge habitat Interior habitat 1970 Looking at land fragmentation In the broadest way, habitat fragmentation is the physical fracturing of once continuous habitat, often by man-made modifications to the biological land surface (including water, 1990 vegetation, bare soil) into smaller sized habitat lands called patches. For wildlife these patches are often so small that the land can no longer sustain the ecological interactions between different wildlife types, thus this land often has little value for wildlife as habitat. 2012 In addition, fragmentation of land into patches means that as interior space becomes smaller in size, edge conditions are able to take over; this reduces the populations of rare interior species Santa Cruze River 1930 Santa Cruze River 1970 and makes room for common generalist and ‘weedy species’. Historical Growth on the Santa Cruze River As Interior habitat and species Decreases Urban growth Agriculture growth Santa Cruze River Edge habitat and species Increases
- 5. Wildlife NOT present in Waterway Type Displaces 23 of Pinal’s 27 speices listed “in need of protection ” The problem: Removing the link - removing the wildlife C Rivers D Rivers C Rivers D Rivers C Rivers D Rivers C Rivers D Rivers DEMOSTRATION OF THESIS: For Space and Width of the corridor 90 percent loss of functional riparian habitat Protect from Future Development * * * * Preserve as undeveloped Reality Space ma Amphibian (frog) Potential Rehabilitation Project Locations Wildlife Capacity Amphibian (Toad) 16 of 19 Wildlife Reptile –Lizard Wildlife Capacity Reptile– Snake 9 of 19 Wildlife T Turtles Carnivores Reality Water los Rodents Riparian Wildlife Orders Wildlife Capacity Rabbits 10 of 19 Wildlife Common Birds Wildlife Capacity Owls 2 of 19 Wildlife T Waterbirds Reality Plant zon Humming Birds Wildlife Capacity P1 P2 P3 P4 P5 P6 Ducks 7 of 19Wildlife T P1- From 2 to( 9 of 9) Widlife Orders P4- From 4 to (19 of 19) Wildlife Orders Ground birds Wildlife Capacity Land: Protect and Preserve Land: Protect from future development Woodpeckers 6 of 19 Wildlife T Water: Maintain Surface Water level Water: Find 5’ Surface water Hawk / Eagle Plants: (Bank zone) from mesquites to Herbaceous shrubs Plants: (Bank Overbank, Toe) Cottonwoods Hooved mammals P2- From 0 to (9 of 9) Wildlife orders P5- From 1 to (5 of 19) Wildlife Orders Bats Land: Protect and preserve Land: At 223’ Unable to remove housing Water: Find 4’ Surface water Water: Find 5’ Surface water Beavers Plants: (Bank Zone) from mesquites to Herbaceous shrubs Plants: (Bank Overbank, Toe) Th eo R R P3- From 0 to ( 17 of 19 ) Wildlife Orders P6- From 1 to (19 of 10) Wildlife Orders R r ea ea et ea ic lit lit From: 0’ to 670’ -Golf course wildlife project- Land: Protect from future development lit a y: y: y: lB L L Water: Find 5’ Surface water Water: Find 5’ Surface water L io os os os d s s iv s Plants: (Bank Overbank, Toe) Cottonwoods Plants: (Bank Overbank, Toe) Cottonwoods of of e of rs pl W Sp ity an at ac C er ts e ap ab ilit y
- 6. Wildlife corridoors: why being in the middle matters Legend Legend Pinal County: City as an obstacle Open Space Santa Cruze River Connections Legend Legend Rivers Other Pinal County: City as an obstacle Urban Development Why this location is important to wildlife Open Space Santa Cruze River Connections Other Rivers Urban Development The site (North Branch of the Santa Cruze wash) is currently under threat of removal from urbanization. On a close up view, the area doesn’t appear very important, because it doesn’t directly connect wildlands together. However, looking at the site on a regional scale reveals the importance of this stretch Understanding regional pathways: space, and riparian rivers Pinal County : Open space Pinal County :Open City as an Obstical: The city, open space and riparian rivers of river; it’s the middle of a connection between two How wildlands connect with riversriparian riversand where the city becomes a blocade Pinal County : Open space Pinal County :Open space, and City as an Obstical: The city, open space and riparian rivers larger riparian networks, both of which connect to large wildlands. Shown are the three groups of Pinal County Analysis maps, used to create the below corridor analysis map. These maps were used to examine the site and to Pinal County:Mammal density Pinal County: Bird density Pinal County:Reptile density determine that the removal of the site would indeed be a hindrance to wildlife populations because the loss of this corridor would create meta-populations on Wildlife Network: riparian rivers and wildlife openspace wildlife corridors: Important riparian rivers wildlife corridors: Riparian river corridor site either side of Pinal County. Understanding riparian networks Important riparian rivers Wildlife Network: riparian rivers and wildlife openspace wildlife corridors: wildlife corridors: Riparian river corridor site Not to scale Not to scale Not to scale How removal of the Site will disrupt riparian movement coridoors Pinal County: Wildlife densities Open Space Legend Wildlife High level Santa Cruze River Other Rivers Pinal County: Wildlife Corridors and Pathways Wildlife Low level Urban Development Pinal County:Mammal density Pinal County: Bird density Pinal County:Reptile density Casa Grande Not to scale Pinal County: Corridoors and pathways The three wildlife density maps, Mammals, Birds, Reptiles (three dark maps) are compiled from the wildlife density maps, such as the orange Pinal map above. The Green map to the right is compiled of all wildlife densities.It contains the data of all animal types and Not to scale Not to scale Not to scale shows (in red) the most likely connection points for wildlife on the site. Legend North Branch Of the Santa Cruze Wash Understanding wildlife densities The city of Casa Grande Legend The purpose of the the wildlife desnity maps is to examine the site Pinal County: Wildlife densities Open Space Santa Cruze River Pinal County: Wildlife Corridors and Pathways (lt blue) ‘North Branch of the Santa Cruze River’ and see where each Wildlife connection points How wildlife densities reveal travel pathways Wildlife High level Other Rivers type of studied wildlife populations (Birds, Mammals, and Reptiles) is Wildlife Corridor: Birds. Mammals, Wildlife Low level Urban Development most likely to travel to the site and come in contact with the Riparian and Reptiles zone in question. Not to scale Casa Grande
- 7. y located on the site. Affluent water will be available and will flow the length of the 10 ‘North branch of the Santa Cruze wash’. Corridor Research (site) looking at available water map Legend Santa Cruze North Branch Corridor Roadways Infrastructure Systems No water Availalbe Water Available Water Fragmentation: Finding water Stormwater: North Branch of the Santa Cruze Wash Pinal County: proposed effluent pipe Pinal NO CAP Canal Water NO Aquifer pumping Map content shows the 100 year flood zone for the Ca sa city of Casa GrandeEffluent Water where the current YES (blue) and Gr an water treatment facility for the area exists. The map YES Urban Stormwater de M ar show where the proposed effluent pipe, for ac Pinal County: Proposed Effluent pipe Map content shows the 100 year flood zone for the city of in Casa and where the expansion flow, will be located Casa Grande Grande op aH igh current water treatment facility for the area exists. The purpose of the map isEffluent wa and this will effect water flow on the site. to show where the proposed affluent pipe, for expansion flow, will be y located on the site. Affluent water will be availablewill flow the length of water will be available and and will flow the length of the 10 ‘North branch of the Santa Cruze wash’. the North branch of the Santa Cruze wash. map Legend Effluent Water YES House Greywater NO CAP Canal Water YES Santa Cruze North Branch Corridor Available water YES Roadways Infrastructure Systems No water Availalbe YES Rainwater Catchment NO Aquifer Pumping Urban Stormwater Water Available
- 8. Corridor research (site) looking at planting zones Pinal County: loss of planting zones Map content shows the condition of the riparian planting zone for the North branch of the Santa Cruze wash (Color) and where the current head streams and waters for the area exist. The map shows that the conditions of the waterway range from medium to worst condition possible. The worst condition possible on the North branch of the Santa Cruze wash was chosen for the project site in order to maintain corridor stability for wildlife. Why the planting condition is this way can be seen on land use mapping. Best Planting Conditions Worst Planting Conditions Planting Zones: Grayed out Zones are the ones that were found to be missing from this riparian corridor. Information based upon ground truthing of site. Planting Zones: These are the unique planting zones which make up the Riparian Ecosystem on the site and should be availalbe.
- 9. Corridor Research (site) understanding land use and space availability Corridor research: space conflicts map Legend Development and wildland conflict -places where developed comes into conflict with important Space conflicts identified and then measured riparian wildlands. in Google Earth to find distance from urban Development edge to urban edge. Corridor research: land use development map Legend Santa Cruze North Branch Corridor Industrial Development Roadways Infrastructure Systems Current housing Development Agriculture Development Future housing Development Corridor research: habitat fragmentation development over Corridor research: development and wildlife conflict wildlands map Legend Urban Housing Density Santa Cruze North Branch Corridor Roadways Infrastructure Systems Developers (6) Places of Ecological Importance - Maxhimer (105 units) -1unit per ac - Rancho Doro Estates (110 units)- 1unit per ac Ca Casa Grande: Current Development - Condon Park Estates (108 Units) -4 units per ac sa Gr - Lillian Master plan community (108 units) -4 units per ac an Casa Grande: To be developed - Rodea Ranch Estates (68 units) -4 units per ac de M - Rodea Estates (64 units) -4 units per ac ar ac op Total: 558 Homes aH igh 1,500 -2,000’ feet per unit wa Other development (2) y -Office condominiums 10 -Industurial park Corridor research: development and wildlife conflict