SlideShare uma empresa Scribd logo
1 de 5
5/21/2012
UrbP 278/ EnvS 179, Kos | Jessica Setiawan and Kenneth Rosales
Spring 2012
SENIOR
SERVICES
DESERT:
SENIORSERVICES DESERT:LACK OF
ACCESSIBLE SERVICES FOR SENIOR SERVICES IN
EAST SAN JOSÉ
SENIORSERVICESDESERT: LACK OF ACCESSIBLESERVICESFORSENIOR SERVICESIN EAST SAN JOSÉ Setiawan and Rosales
1
PROJECT SUMMARY
Nationwide, the United States will be experiencing a demographic phenomenon in the
next few decades due to the aging population of Baby Boomers and Generation X babies.
Between the year 2000 and 2010, the US Census Bureau 2010 found that the 65 and over
population increased at a quicker rate of 15.1% than the entire population comprised at a rate
of 9.7% (Werner 2011). In the year 2000, the senior population of ages 65 and beyond was 35
million and inclined to 40.3 million in 2010, an increase of 5.3 million seniors (Werner 2011). In 2010,
the senior population made up 13% of the entire population, while in 2000, it was 12.4% (Werner
2011). TransForm California and Transportation for America, both progressive public transit
advocate nonprofit organizations released a newsletter in 2011 detailing that more than 15.5
million Americans ages 65 and up who are unable to drive will reside in areas with poor
transportation options (i.e. suburban settings). Therefore, services such as hospitals, clinics,
supermarkets, parks, community centers, and theatres will be far of reach from this population
group. Moreover, most Americans who turn 55 do not move from their respective areas and in
fact, just about 2% move from state to state while only 5% change their residence (Bullok and
Cohen 2011). As a consequence, the aging populations of 65 and beyond who are unable to
drive make 59% fewer trips to local shops and restaurants, 15% fewer trips to medical
professionals, and 65% fewer trips to close acquaintances and relatives (Bullok and Cohen 2011).
Within the Bay Area, the population size of seniors will escalate to 35% from the year 2010
to 2020 (US Census Bureau and Metropolitan Transportation Commission 2002). In the Santa
Clara County, the population of adults over 65 will nearly double, reaching close to 300,000 in
2020 (Weden 2008). In other words, 25% of the population, or 1 of 4 people in the County of
Santa Clara will be ages 65 and beyond (Weden 2008). Between 2000 and 2015, San Jose’s
percent of seniors with poor access to public transportation increases by 66%, thus a total of 15%
or approximately 35,316 San Jose’s seniors will have poor public transportation connectivity by
2015 (Bullok and Cohen 2011). By the year 2040, San Jose’s aging population will increase at an
even more substantial level and is equally projected to have inadequate transit services (Weden
2008).
When compared to the rest of the country, the Bay Area’s figures do not look as
catastrophic. For example, in Kansas City, Missouri, about 88% of their senior population is
predicted to have less than sufficient transit services by 2015 (Bullok and Cohen 2011).
Furthermore, the Center for Neighborhood Technology found that 90% of Atlanta Georgia
seniors will be in the same situation (Transportation for America 2011). Furthermore, Houston and
Dallas, Texas, Nashville, Tennessee, and Oklahoma City, Oklahoma will face analogous
circumstances of “aging in place, and being stuck without options” for their senior populations
(Transportation for America 2011).
This project only concentrates in East San Jose since it is commonly known to be
underserved. According to the United States Census Bureau, _______ seniors reside in East San
Jose out of a total of _____ seniors in the entire city (GIS US Census 2010 data). The main
objective of this dual map is to depict how far the most concentrated senior citizen populations
lie from recreational and necessary services, how far they reside from projected dense
developments such as the “Urban Villages” detailed in San Jose’s General Plan, Envision 2040,
and how necessary it is to improve such amenities in the planning areas of Berryessa, Alum Rock,
and Evergreen that make up East San Jose.
SENIORSERVICESDESERT: LACK OF ACCESSIBLESERVICESFORSENIOR SERVICESIN EAST SAN JOSÉ Setiawan and Rosales
2
STATEMENT OF PURPOSE
On Monday March 26th of the year 2012, our group entered a discussion group for our
internship with the Sierra Club. Since the Sierra Club has been centered on their Building Climate-
Friendly Communities (BCFC) campaign, we have been focusing on smart land use planning to
reduce greenhouse gas emissions. Furthermore, these efforts have been successful with the
leveraging of our Cool Cities teams who are residential environmental advocacy groups. The
most current discussion group we attended was titled “Aging Population and Urban Planning,”
which spawned the purpose of our project.
In the “Aging Population and Urban Planning” discussion group the attendees and hosts,
young and old, stressed the lack of sufficient planning for the current and future older residents
in San Jose. The discussion group decided to take action by submitting informational pages to
San Jose City Council Members with the support of partnerships (at least 10) that will outline the
problems of current circumstances, effects of projected developments, and alternatives
associated with aging populations and city planning. Towards the end of the meeting, our
group initially came up with the great idea of including a map that shows current conditions,
projected developments, and with the inclusion of senior population consultation, an alternative
project since we both were registered in the same GIS course. In essence, three maps were
going to be created for a single project. However, we were too ambitious and the time
constraints our GIS course had embarked on us forced us to re-arrange our project to a dual
map that shows recreational and necessary services in the vicinity of senior dwelling areas.
Our group felt that creating a map with the support of a plethora of organizations can
create a great impact on San Jose’s decision makers. Not only do we believe that providing
adequate services to the current senior population is just, but we are also concerned for our
own generation and others down the line. Moreover, our group has read through the City of San
Jose’s General Plan, Envision 2040 and it unfortunately does not make its senior citizens a priority.
The plan describes the projection of 70 urban villages and its consequent increase in walkability
and bikability of the city. However, it does not specify the locations of the predominant areas of
current and future senior populations in relation to the urban villages. This issue is rather vital to us
because not only do we believe that creating denser planning in our cities can have a wide
range of benefits as outlined in Envision 2040, but it can provide even more. They include
maintenance services such as sewage, electrical lines, and streets, and enhanced medical and
police responses provided to seniors while achieving urban sustainability and significant
greenhouse gas reduction (Henning, 2008).
On the other hand, Envision 2040 does ascertain that the population of people ages 65
and up will grow significantly and will be considered. “Focusing new job and housing growth to
build attractive, compact, walkable, urban districts or ‘Urban Villages’ will enable location of
commercial and public services in close proximity to residential and employee populations,
allowing people to walk to services while also providing greater mobility for the expanding senior
and youth segments of the population” (City of san Jose and Planning division 2011). It is an
absolute relief that the topic of our aging population is brought up in the General Plan, however,
it is imperative that citizens take proactive measures to include their own inputs in the
development of their city. The energy of the community in engaging on issues of inequity is the
primary reason why our group is extremely adamant on this topic of our senior populace.
Fortunately, we can achieve prodigious advancements since the concept of Smart Growth and
the needs of the aging population are similar to the needs of younger generations. Envision 2040
already addresses Smart Growth and with a great number of taxpayers that will soon be senior
SENIORSERVICESDESERT: LACK OF ACCESSIBLESERVICESFORSENIOR SERVICESIN EAST SAN JOSÉ Setiawan and Rosales
3
citizens, incorporating the needs of the elderly in planning the future of San Jose should be
mandatory.
GIS DATA SOURCES
The following is a list of GIS data sources utilized in creation of the final dual map:
 U.S. Census Bureau, 2010
 CommUniverCity
 ESRI US Topographic Basemap
 Yellowpages.com
 City of San Jose, Housing Department
 City of San Jose, Planning Division
 City of San Jose, Parks, Recreation & Neighborhood Services
 San Jose State University, Urban Planning & Regional Department, Community Planning
(URBP 2011) Spring 2011
The following listings are all the data sets used to create the final dual map:
 Hospitals (addresses geocoded from the City of San Jose website)
 Clinics (addresses geocoded from yellowpages.com)
 Grocery stores (feature class obtained from the City of San Jose)
 Public libraries (______________)
 Community/Senior Centers (_______________)
 Movie Theatres (_____________)
 Senior Housing (_____________)
 Envision 2040 Planned Urban Villages ( Shapefile retrieved from City of San Jose Planning
Division)
 Freeways (Shapefile retrieved from SJSU Urban & Regional Planning Department,
Mountain View Project)
 Creeks (Shapefile retrieved from from SJSU Urban & Regional Planning Department,
CommUniverCity)
 VTA Light Rail Line (Shapefile retrieved from SJSU Urban & Regional Planning Department,
Mountain View Project)
 VTA Bus Route (Shapefile retrieved from SJSU Urban & Regional Planning Department,
Mountain View Project)
 Roads (________________)
 Planning Areas (_______________)
 Lakes and Reservoirs (Shapefile retrieved from SJSU Urban & Regional Planning
Department, CommUniverCity)
 Parks (Shapefile retrieved from from SJSU Urban & Regional Planning Department,
CommUniverCity)
List of data considered to be used, but did not:
 San Jose Police Department locations
 San Jose Fire Department locations
SENIORSERVICESDESERT: LACK OF ACCESSIBLESERVICESFORSENIOR SERVICESIN EAST SAN JOSÉ Setiawan and Rosales
4
Works Cited
"Aging in Place, Stuck Without Options." Transportation for America. N.p., 2011. Web. 19
May 2012. <http://t4america.org/resources/seniorsmobilitycrisis2011/>.
City of San Jose and Planning. (2011). Envision san jose 2040 general plan draft.
Retrieved from website:
http://www.sanjoseca.gov/planning/gp_update/DraftPlan/FinalDraft/Draft_EnvisionSaJo
se2040GeneralPlan.pdf
Bullok,C.,Moler,K.,&Cohen,S.(2011, June 14). New report:Most aging baby boomers will
face poormobility options.Retrieved from
http://transformamerica.org/files/transform_sacramento_aging_press_release_6.13.pdf
Metropolitan Transportation Commission and US Census Bureau 2000. San Francisco Bay Area
Older Adults Transportation Study. San Francisco : nelson/ngyaard Consulting Associates,
2002. Web. <http://www.mtc.ca.gov/library/oats/OATS_FINAL_Report.pdf>.
Weden, D. (2010, June). Land use planning and our aging population. City of palo alto
pallning and communitenvironment speaker series forum. Retrieved from
http://www.cityofpaloalto.org/depts/pln/news/details.asp?NewsID=1472&TargetI
D=85
Werner, Carrie. United States Government. US Census Bureau 2010. Older Population:
2010 (2010 Census Briefs). 2011. Web.
<http://www.census.gov/prod/cen2010/briefs/c2010br-09.pdf>.
Henning, T. (Producer) (2008). Jan gehl:3 qualities of sustainable city [Web]. Retrieved
from http://vimeo.com/1677412a

Mais conteúdo relacionado

Semelhante a FinalReport

Urban-Redevelopment-PB-1(1)
Urban-Redevelopment-PB-1(1)Urban-Redevelopment-PB-1(1)
Urban-Redevelopment-PB-1(1)Aaron Beitman
 
Community Profile of Boddington Shire
Community Profile of Boddington ShireCommunity Profile of Boddington Shire
Community Profile of Boddington ShirePatricia Gorman
 
Due Thurs. 4-30-15 4pmPlease answer in 1 ½ two 2 paragraphs, be very.docx
Due Thurs. 4-30-15 4pmPlease answer in 1 ½ two 2 paragraphs, be very.docxDue Thurs. 4-30-15 4pmPlease answer in 1 ½ two 2 paragraphs, be very.docx
Due Thurs. 4-30-15 4pmPlease answer in 1 ½ two 2 paragraphs, be very.docxjacksnathalie
 
International Journal of Humanities and Social Science Invention (IJHSSI)
International Journal of Humanities and Social Science Invention (IJHSSI)International Journal of Humanities and Social Science Invention (IJHSSI)
International Journal of Humanities and Social Science Invention (IJHSSI)inventionjournals
 
EVCC-Final-Report-Capstone-2015
EVCC-Final-Report-Capstone-2015EVCC-Final-Report-Capstone-2015
EVCC-Final-Report-Capstone-2015Rui Xu
 
DSDP Demographic Study 2016
DSDP Demographic Study 2016DSDP Demographic Study 2016
DSDP Demographic Study 2016Caroline Stevens
 
Equity-Report_12-14_150ppi
Equity-Report_12-14_150ppiEquity-Report_12-14_150ppi
Equity-Report_12-14_150ppiJessie Grogan
 
Nashville Area Regional Transportation Plan
Nashville Area Regional Transportation PlanNashville Area Regional Transportation Plan
Nashville Area Regional Transportation PlanNashville Area MPO
 
Shaping the City that Decreases Overweight and Obesity through Healthy Built ...
Shaping the City that Decreases Overweight and Obesity through Healthy Built ...Shaping the City that Decreases Overweight and Obesity through Healthy Built ...
Shaping the City that Decreases Overweight and Obesity through Healthy Built ...Journal of Contemporary Urban Affairs
 

Semelhante a FinalReport (20)

Urban-Redevelopment-PB-1(1)
Urban-Redevelopment-PB-1(1)Urban-Redevelopment-PB-1(1)
Urban-Redevelopment-PB-1(1)
 
Boone County Snapshot
Boone County SnapshotBoone County Snapshot
Boone County Snapshot
 
Community Profile of Boddington Shire
Community Profile of Boddington ShireCommunity Profile of Boddington Shire
Community Profile of Boddington Shire
 
Rush County SnapShot
Rush County SnapShotRush County SnapShot
Rush County SnapShot
 
Jackson County Snapshot
Jackson County SnapshotJackson County Snapshot
Jackson County Snapshot
 
Jackson County Snapshot
Jackson County SnapshotJackson County Snapshot
Jackson County Snapshot
 
Due Thurs. 4-30-15 4pmPlease answer in 1 ½ two 2 paragraphs, be very.docx
Due Thurs. 4-30-15 4pmPlease answer in 1 ½ two 2 paragraphs, be very.docxDue Thurs. 4-30-15 4pmPlease answer in 1 ½ two 2 paragraphs, be very.docx
Due Thurs. 4-30-15 4pmPlease answer in 1 ½ two 2 paragraphs, be very.docx
 
Data Day 2012_Kahn_Using Indicators-Boston Indicators
Data Day 2012_Kahn_Using Indicators-Boston IndicatorsData Day 2012_Kahn_Using Indicators-Boston Indicators
Data Day 2012_Kahn_Using Indicators-Boston Indicators
 
Tippecanoe County SnapShot
Tippecanoe County SnapShotTippecanoe County SnapShot
Tippecanoe County SnapShot
 
International Journal of Humanities and Social Science Invention (IJHSSI)
International Journal of Humanities and Social Science Invention (IJHSSI)International Journal of Humanities and Social Science Invention (IJHSSI)
International Journal of Humanities and Social Science Invention (IJHSSI)
 
EVCC-Final-Report-Capstone-2015
EVCC-Final-Report-Capstone-2015EVCC-Final-Report-Capstone-2015
EVCC-Final-Report-Capstone-2015
 
SOCReportHarlingen
SOCReportHarlingenSOCReportHarlingen
SOCReportHarlingen
 
Data SnapShot Report Booklet
Data SnapShot Report BookletData SnapShot Report Booklet
Data SnapShot Report Booklet
 
DSDP Demographic Study 2016
DSDP Demographic Study 2016DSDP Demographic Study 2016
DSDP Demographic Study 2016
 
Steuben County Snapshot
Steuben County SnapshotSteuben County Snapshot
Steuben County Snapshot
 
Equity-Report_12-14_150ppi
Equity-Report_12-14_150ppiEquity-Report_12-14_150ppi
Equity-Report_12-14_150ppi
 
OP02/21
OP02/21OP02/21
OP02/21
 
Nashville Area Regional Transportation Plan
Nashville Area Regional Transportation PlanNashville Area Regional Transportation Plan
Nashville Area Regional Transportation Plan
 
Shaping the City that Decreases Overweight and Obesity through Healthy Built ...
Shaping the City that Decreases Overweight and Obesity through Healthy Built ...Shaping the City that Decreases Overweight and Obesity through Healthy Built ...
Shaping the City that Decreases Overweight and Obesity through Healthy Built ...
 
Rural Minnesota Journal: Who Lives in Minnesota?
Rural Minnesota Journal: Who Lives in Minnesota?Rural Minnesota Journal: Who Lives in Minnesota?
Rural Minnesota Journal: Who Lives in Minnesota?
 

Mais de Kenneth Rosales

KennethRosales_FinalBMPComparison_Seattle_WashingtonDC_Combined
KennethRosales_FinalBMPComparison_Seattle_WashingtonDC_CombinedKennethRosales_FinalBMPComparison_Seattle_WashingtonDC_Combined
KennethRosales_FinalBMPComparison_Seattle_WashingtonDC_CombinedKenneth Rosales
 
Rosales_2015_Resume_PACT
Rosales_2015_Resume_PACTRosales_2015_Resume_PACT
Rosales_2015_Resume_PACTKenneth Rosales
 
SK_APA_Award_Presentation
SK_APA_Award_PresentationSK_APA_Award_Presentation
SK_APA_Award_PresentationKenneth Rosales
 
CEQAREFORM_POLICYANALYSIS
CEQAREFORM_POLICYANALYSISCEQAREFORM_POLICYANALYSIS
CEQAREFORM_POLICYANALYSISKenneth Rosales
 
FINAL_SantaTeresa_Bernal_UrbanVillagePlan
FINAL_SantaTeresa_Bernal_UrbanVillagePlanFINAL_SantaTeresa_Bernal_UrbanVillagePlan
FINAL_SantaTeresa_Bernal_UrbanVillagePlanKenneth Rosales
 
Heavy Metal Soil Contamination Analysis
Heavy Metal Soil Contamination AnalysisHeavy Metal Soil Contamination Analysis
Heavy Metal Soil Contamination AnalysisKenneth Rosales
 
ECOLOGICAL CHANGES OF LAKES
ECOLOGICAL CHANGES OF LAKESECOLOGICAL CHANGES OF LAKES
ECOLOGICAL CHANGES OF LAKESKenneth Rosales
 
final final copy of BIKE SHARE IN SAN JOSE
final final copy of BIKE SHARE IN SAN JOSEfinal final copy of BIKE SHARE IN SAN JOSE
final final copy of BIKE SHARE IN SAN JOSEKenneth Rosales
 
Cool Cities Flyer_Spanish
Cool Cities Flyer_SpanishCool Cities Flyer_Spanish
Cool Cities Flyer_SpanishKenneth Rosales
 
ssfwalkingtourflyer_finishedv2
ssfwalkingtourflyer_finishedv2ssfwalkingtourflyer_finishedv2
ssfwalkingtourflyer_finishedv2Kenneth Rosales
 
moving_silicon_valley_forward-_community_flyer
moving_silicon_valley_forward-_community_flyermoving_silicon_valley_forward-_community_flyer
moving_silicon_valley_forward-_community_flyerKenneth Rosales
 
SJSUHIApresentationcompleteFINAL
SJSUHIApresentationcompleteFINALSJSUHIApresentationcompleteFINAL
SJSUHIApresentationcompleteFINALKenneth Rosales
 

Mais de Kenneth Rosales (20)

KennethRosales_FinalBMPComparison_Seattle_WashingtonDC_Combined
KennethRosales_FinalBMPComparison_Seattle_WashingtonDC_CombinedKennethRosales_FinalBMPComparison_Seattle_WashingtonDC_Combined
KennethRosales_FinalBMPComparison_Seattle_WashingtonDC_Combined
 
Rosales_2015_Resume_PACT
Rosales_2015_Resume_PACTRosales_2015_Resume_PACT
Rosales_2015_Resume_PACT
 
Rosales_2015_Resume
Rosales_2015_ResumeRosales_2015_Resume
Rosales_2015_Resume
 
SK_APA_Award_Presentation
SK_APA_Award_PresentationSK_APA_Award_Presentation
SK_APA_Award_Presentation
 
INDUSTRIAL ECOLOGY
INDUSTRIAL ECOLOGYINDUSTRIAL ECOLOGY
INDUSTRIAL ECOLOGY
 
CEQAREFORM_POLICYANALYSIS
CEQAREFORM_POLICYANALYSISCEQAREFORM_POLICYANALYSIS
CEQAREFORM_POLICYANALYSIS
 
FINAL_SantaTeresa_Bernal_UrbanVillagePlan
FINAL_SantaTeresa_Bernal_UrbanVillagePlanFINAL_SantaTeresa_Bernal_UrbanVillagePlan
FINAL_SantaTeresa_Bernal_UrbanVillagePlan
 
Project Citizen
Project CitizenProject Citizen
Project Citizen
 
Heavy Metal Soil Contamination Analysis
Heavy Metal Soil Contamination AnalysisHeavy Metal Soil Contamination Analysis
Heavy Metal Soil Contamination Analysis
 
ECOLOGICAL CHANGES OF LAKES
ECOLOGICAL CHANGES OF LAKESECOLOGICAL CHANGES OF LAKES
ECOLOGICAL CHANGES OF LAKES
 
FIXEDSanJoseAgingMap
FIXEDSanJoseAgingMapFIXEDSanJoseAgingMap
FIXEDSanJoseAgingMap
 
198 Presentation
198 Presentation198 Presentation
198 Presentation
 
final final copy of BIKE SHARE IN SAN JOSE
final final copy of BIKE SHARE IN SAN JOSEfinal final copy of BIKE SHARE IN SAN JOSE
final final copy of BIKE SHARE IN SAN JOSE
 
URBP 276-Assignment 4
URBP 276-Assignment 4URBP 276-Assignment 4
URBP 276-Assignment 4
 
Cool Cities Flyer_Spanish
Cool Cities Flyer_SpanishCool Cities Flyer_Spanish
Cool Cities Flyer_Spanish
 
AFGF_Flyer_FINAL
AFGF_Flyer_FINALAFGF_Flyer_FINAL
AFGF_Flyer_FINAL
 
ssfwalkingtourflyer_finishedv2
ssfwalkingtourflyer_finishedv2ssfwalkingtourflyer_finishedv2
ssfwalkingtourflyer_finishedv2
 
moving_silicon_valley_forward-_community_flyer
moving_silicon_valley_forward-_community_flyermoving_silicon_valley_forward-_community_flyer
moving_silicon_valley_forward-_community_flyer
 
FINALTullyStopMap
FINALTullyStopMapFINALTullyStopMap
FINALTullyStopMap
 
SJSUHIApresentationcompleteFINAL
SJSUHIApresentationcompleteFINALSJSUHIApresentationcompleteFINAL
SJSUHIApresentationcompleteFINAL
 

FinalReport

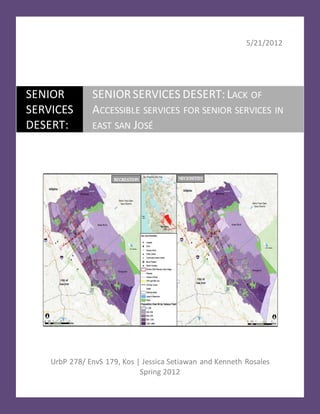
  • 1. 5/21/2012 UrbP 278/ EnvS 179, Kos | Jessica Setiawan and Kenneth Rosales Spring 2012 SENIOR SERVICES DESERT: SENIORSERVICES DESERT:LACK OF ACCESSIBLE SERVICES FOR SENIOR SERVICES IN EAST SAN JOSÉ
  • 2. SENIORSERVICESDESERT: LACK OF ACCESSIBLESERVICESFORSENIOR SERVICESIN EAST SAN JOSÉ Setiawan and Rosales 1 PROJECT SUMMARY Nationwide, the United States will be experiencing a demographic phenomenon in the next few decades due to the aging population of Baby Boomers and Generation X babies. Between the year 2000 and 2010, the US Census Bureau 2010 found that the 65 and over population increased at a quicker rate of 15.1% than the entire population comprised at a rate of 9.7% (Werner 2011). In the year 2000, the senior population of ages 65 and beyond was 35 million and inclined to 40.3 million in 2010, an increase of 5.3 million seniors (Werner 2011). In 2010, the senior population made up 13% of the entire population, while in 2000, it was 12.4% (Werner 2011). TransForm California and Transportation for America, both progressive public transit advocate nonprofit organizations released a newsletter in 2011 detailing that more than 15.5 million Americans ages 65 and up who are unable to drive will reside in areas with poor transportation options (i.e. suburban settings). Therefore, services such as hospitals, clinics, supermarkets, parks, community centers, and theatres will be far of reach from this population group. Moreover, most Americans who turn 55 do not move from their respective areas and in fact, just about 2% move from state to state while only 5% change their residence (Bullok and Cohen 2011). As a consequence, the aging populations of 65 and beyond who are unable to drive make 59% fewer trips to local shops and restaurants, 15% fewer trips to medical professionals, and 65% fewer trips to close acquaintances and relatives (Bullok and Cohen 2011). Within the Bay Area, the population size of seniors will escalate to 35% from the year 2010 to 2020 (US Census Bureau and Metropolitan Transportation Commission 2002). In the Santa Clara County, the population of adults over 65 will nearly double, reaching close to 300,000 in 2020 (Weden 2008). In other words, 25% of the population, or 1 of 4 people in the County of Santa Clara will be ages 65 and beyond (Weden 2008). Between 2000 and 2015, San Jose’s percent of seniors with poor access to public transportation increases by 66%, thus a total of 15% or approximately 35,316 San Jose’s seniors will have poor public transportation connectivity by 2015 (Bullok and Cohen 2011). By the year 2040, San Jose’s aging population will increase at an even more substantial level and is equally projected to have inadequate transit services (Weden 2008). When compared to the rest of the country, the Bay Area’s figures do not look as catastrophic. For example, in Kansas City, Missouri, about 88% of their senior population is predicted to have less than sufficient transit services by 2015 (Bullok and Cohen 2011). Furthermore, the Center for Neighborhood Technology found that 90% of Atlanta Georgia seniors will be in the same situation (Transportation for America 2011). Furthermore, Houston and Dallas, Texas, Nashville, Tennessee, and Oklahoma City, Oklahoma will face analogous circumstances of “aging in place, and being stuck without options” for their senior populations (Transportation for America 2011). This project only concentrates in East San Jose since it is commonly known to be underserved. According to the United States Census Bureau, _______ seniors reside in East San Jose out of a total of _____ seniors in the entire city (GIS US Census 2010 data). The main objective of this dual map is to depict how far the most concentrated senior citizen populations lie from recreational and necessary services, how far they reside from projected dense developments such as the “Urban Villages” detailed in San Jose’s General Plan, Envision 2040, and how necessary it is to improve such amenities in the planning areas of Berryessa, Alum Rock, and Evergreen that make up East San Jose.
  • 3. SENIORSERVICESDESERT: LACK OF ACCESSIBLESERVICESFORSENIOR SERVICESIN EAST SAN JOSÉ Setiawan and Rosales 2 STATEMENT OF PURPOSE On Monday March 26th of the year 2012, our group entered a discussion group for our internship with the Sierra Club. Since the Sierra Club has been centered on their Building Climate- Friendly Communities (BCFC) campaign, we have been focusing on smart land use planning to reduce greenhouse gas emissions. Furthermore, these efforts have been successful with the leveraging of our Cool Cities teams who are residential environmental advocacy groups. The most current discussion group we attended was titled “Aging Population and Urban Planning,” which spawned the purpose of our project. In the “Aging Population and Urban Planning” discussion group the attendees and hosts, young and old, stressed the lack of sufficient planning for the current and future older residents in San Jose. The discussion group decided to take action by submitting informational pages to San Jose City Council Members with the support of partnerships (at least 10) that will outline the problems of current circumstances, effects of projected developments, and alternatives associated with aging populations and city planning. Towards the end of the meeting, our group initially came up with the great idea of including a map that shows current conditions, projected developments, and with the inclusion of senior population consultation, an alternative project since we both were registered in the same GIS course. In essence, three maps were going to be created for a single project. However, we were too ambitious and the time constraints our GIS course had embarked on us forced us to re-arrange our project to a dual map that shows recreational and necessary services in the vicinity of senior dwelling areas. Our group felt that creating a map with the support of a plethora of organizations can create a great impact on San Jose’s decision makers. Not only do we believe that providing adequate services to the current senior population is just, but we are also concerned for our own generation and others down the line. Moreover, our group has read through the City of San Jose’s General Plan, Envision 2040 and it unfortunately does not make its senior citizens a priority. The plan describes the projection of 70 urban villages and its consequent increase in walkability and bikability of the city. However, it does not specify the locations of the predominant areas of current and future senior populations in relation to the urban villages. This issue is rather vital to us because not only do we believe that creating denser planning in our cities can have a wide range of benefits as outlined in Envision 2040, but it can provide even more. They include maintenance services such as sewage, electrical lines, and streets, and enhanced medical and police responses provided to seniors while achieving urban sustainability and significant greenhouse gas reduction (Henning, 2008). On the other hand, Envision 2040 does ascertain that the population of people ages 65 and up will grow significantly and will be considered. “Focusing new job and housing growth to build attractive, compact, walkable, urban districts or ‘Urban Villages’ will enable location of commercial and public services in close proximity to residential and employee populations, allowing people to walk to services while also providing greater mobility for the expanding senior and youth segments of the population” (City of san Jose and Planning division 2011). It is an absolute relief that the topic of our aging population is brought up in the General Plan, however, it is imperative that citizens take proactive measures to include their own inputs in the development of their city. The energy of the community in engaging on issues of inequity is the primary reason why our group is extremely adamant on this topic of our senior populace. Fortunately, we can achieve prodigious advancements since the concept of Smart Growth and the needs of the aging population are similar to the needs of younger generations. Envision 2040 already addresses Smart Growth and with a great number of taxpayers that will soon be senior
  • 4. SENIORSERVICESDESERT: LACK OF ACCESSIBLESERVICESFORSENIOR SERVICESIN EAST SAN JOSÉ Setiawan and Rosales 3 citizens, incorporating the needs of the elderly in planning the future of San Jose should be mandatory. GIS DATA SOURCES The following is a list of GIS data sources utilized in creation of the final dual map:  U.S. Census Bureau, 2010  CommUniverCity  ESRI US Topographic Basemap  Yellowpages.com  City of San Jose, Housing Department  City of San Jose, Planning Division  City of San Jose, Parks, Recreation & Neighborhood Services  San Jose State University, Urban Planning & Regional Department, Community Planning (URBP 2011) Spring 2011 The following listings are all the data sets used to create the final dual map:  Hospitals (addresses geocoded from the City of San Jose website)  Clinics (addresses geocoded from yellowpages.com)  Grocery stores (feature class obtained from the City of San Jose)  Public libraries (______________)  Community/Senior Centers (_______________)  Movie Theatres (_____________)  Senior Housing (_____________)  Envision 2040 Planned Urban Villages ( Shapefile retrieved from City of San Jose Planning Division)  Freeways (Shapefile retrieved from SJSU Urban & Regional Planning Department, Mountain View Project)  Creeks (Shapefile retrieved from from SJSU Urban & Regional Planning Department, CommUniverCity)  VTA Light Rail Line (Shapefile retrieved from SJSU Urban & Regional Planning Department, Mountain View Project)  VTA Bus Route (Shapefile retrieved from SJSU Urban & Regional Planning Department, Mountain View Project)  Roads (________________)  Planning Areas (_______________)  Lakes and Reservoirs (Shapefile retrieved from SJSU Urban & Regional Planning Department, CommUniverCity)  Parks (Shapefile retrieved from from SJSU Urban & Regional Planning Department, CommUniverCity) List of data considered to be used, but did not:  San Jose Police Department locations  San Jose Fire Department locations
  • 5. SENIORSERVICESDESERT: LACK OF ACCESSIBLESERVICESFORSENIOR SERVICESIN EAST SAN JOSÉ Setiawan and Rosales 4 Works Cited "Aging in Place, Stuck Without Options." Transportation for America. N.p., 2011. Web. 19 May 2012. <http://t4america.org/resources/seniorsmobilitycrisis2011/>. City of San Jose and Planning. (2011). Envision san jose 2040 general plan draft. Retrieved from website: http://www.sanjoseca.gov/planning/gp_update/DraftPlan/FinalDraft/Draft_EnvisionSaJo se2040GeneralPlan.pdf Bullok,C.,Moler,K.,&Cohen,S.(2011, June 14). New report:Most aging baby boomers will face poormobility options.Retrieved from http://transformamerica.org/files/transform_sacramento_aging_press_release_6.13.pdf Metropolitan Transportation Commission and US Census Bureau 2000. San Francisco Bay Area Older Adults Transportation Study. San Francisco : nelson/ngyaard Consulting Associates, 2002. Web. <http://www.mtc.ca.gov/library/oats/OATS_FINAL_Report.pdf>. Weden, D. (2010, June). Land use planning and our aging population. City of palo alto pallning and communitenvironment speaker series forum. Retrieved from http://www.cityofpaloalto.org/depts/pln/news/details.asp?NewsID=1472&TargetI D=85 Werner, Carrie. United States Government. US Census Bureau 2010. Older Population: 2010 (2010 Census Briefs). 2011. Web. <http://www.census.gov/prod/cen2010/briefs/c2010br-09.pdf>. Henning, T. (Producer) (2008). Jan gehl:3 qualities of sustainable city [Web]. Retrieved from http://vimeo.com/1677412a