proforma sample
•
0 gostou•278 visualizações

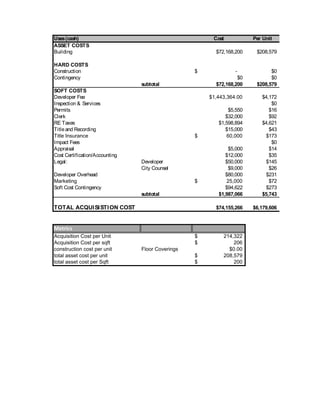
This document provides cost and revenue information for a proposed real estate development project. It includes a breakdown of acquisition costs totaling $74,155,266. It also provides projected annual gross rents totaling $7,877,537 for the first stabilized year. Estimated operating expenses are provided, resulting in a projected net operating income of -$683,066 for the first year. The document also includes calculations for tax payments, returns on investment, and a potential sale of the property in year 10 with a net cash to the seller of $247,533,050.

Recomendados
Mais conteúdo relacionado
Mais procurados
Mais procurados (19)
Semelhante a proforma sample
Semelhante a proforma sample (20)
Mais de Kelvin Xuna
Mais de Kelvin Xuna (20)
proforma sample
- 1. Uses(cash) Cost Per Unit ASSET COSTS Building $72,168,200 $208,579 HARD COSTS Construction -$ $0 Contingency $0 $0 subtotal $72,168,200 $208,579 SOFT COSTS Developer Fee $1,443,364.00 $4,172 Inspection & Services $0 Permits $5,550 $16 Clerk $32,000 $92 RE Taxes $1,598,894 $4,621 Titleand Recording $15,000 $43 Title Insurance 60,000$ $173 Impact Fees $0 Appraisal $5,000 $14 Cost Certification/Accounting $12,000 $35 Legal: Developer $50,000 $145 City Counsel $9,000 $26 Developer Overhead $80,000 $231 Marketing 25,000$ $72 Soft Cost Contingency $94,622 $273 subtotal $1,987,066 $5,743 TOTAL ACQUISISTION COST $74,155,266 $6,179,606 Metrics Acquisition Cost per Unit 214,322$ Acquisition Cost per sqft 206$ construction cost per unit Floor Coverings $0.00 total asset cost per unit 208,579$ total asset cost per Sqft 200$
- 2. % of TDC Assumptions 97.3% 0.0% 0.0% 5.00% 97.3% 1.9% 0.0% 0.0% 0.0% 2.2% 0.0% 0.1% 0.0% 0.0% 0.0% 0.1% 0.0% 0.1% 0.0% 0.1% 5% 2.7% 100.0%
- 3. Setup For First Stabilized year studio/1 551 1,019$ 8 8,155$ studio/1 601 1,112$ 13 14,454$ studio/1 604 1,117$ 15 16,761$ studio/1 613 11,334$ 9 102,006$ studio/1 843 1,560$ 19 29,631$ 1/1. 731 1,352$ 24 32,456$ 1/1. 896 1,658$ 1 1,658$ 1/1. 925 1,711$ 2 3,423$ 1/1. 929 1,719$ 2 3,437$ 1/1. 945 1,748$ 41 71,678$ 1/1. 963 1,782$ 1 1,782$ 1/1. 1,268 2,219$ 1 2,219$ 1/1.5 963 1,782$ 20 35,631$ Loft 1/1.5 968 1,791$ 6 10,745$ Loft 1/1.5 982 1,817$ 8 14,534$ Loft 1/1.5 1,128 2,087$ 23 47,996$ Loft 1/1.5 1,147 2,122$ 8 16,976$ Loft 1/1.5 1,053 1,948$ 10 19,481$ Loft 1+1den/1.5 1,024 1,894$ 2 3,789$ Loft 1+1den/1.5 1,040 1,924$ 3 5,772$ Loft 1+1den/1.5 1,167 2,159$ 4 8,636$ Loft 1+1den/2 1,000 1,850$ 22 40,700$ Loft 2/2 1,440 2,520$ 7 17,640$ 2/2. 1,088 2,013$ 32 64,410$ 2/2.5 1,268 2,219$ 5 11,095$ 2/2.5 1,278 2,237$ 13 29,075$ 2/2.5 1,368 2,394$ 28 67,032$ 2+1den/2.5 1,765 3,089$ 6 18,533$ 2+1den/2.5 1,867 3,267$ 6 19,604$ 3+1den/3.5 2,466 4,316$ 1 4,316$ Loft 3+1den/3.5 2,564 4,487$ 2 8,974$ Loft 3+1den/3.5 2,238 3,917$ 4 15,666$ Total Annual Gross Rent 360,841 656,461$ 346 $7,877,537 Less: Vacancies 20% $1,575,507 Effective Gross Income $6,302,030 HOA (Maintanace) provided 2,914,719$ Real Estate Taxes provided 1,598,894$ Concessions Insurace fees 346 2,254$ 780,012.55$ Management Fees 1.5/sqft 541,262$ Annual Utilities Vacants and Common A 100,000$ Replacement Resesrves provided (misc) $415,200 Contingency 10% $635,009 Total Operating Expenses 6,985,096$ ($683,066) Annual Payment -$ Cash Flow After Financing (CAF) or Cash Flow Before taxes (CFBT) ($683,066.15) Tax Payment see ($99,110.48) Cash Flow After Taxes (CFAT) CF ($583,955.68) Return on Total Assests (ROTA) F&C (NOI) divided by TAC -0.92% After Tax Return on Equity (ROE) or Cash-on-cash reCFAT divided by equity -0.79% cash Flow After Financing ($683,066.15) Add: Replacement Reserves $415,200.00 Add: Mortgage Amortization $0.00 Less: Depreciation (Note: Land is not included in the dep(TDC-Land Cost) / 27.5 2,624,298.18$ Taxable Income ($267,866.15) Tax Rate 37% Tax Payable ($99,110.48) Annual Gross Income SqFt monthly rent Units Assumptions/Notes TOTALS Free and Clear Cash Flow (F&C) or Net Operating Income (NOI) Expenses Calculation of Tax Payment Debt Service
- 4. Projected Setup Year 1 Year 2 Year 3 Year 4 Year 5 Year 6 Year 7 Year 8 Year 9 Year 10 Annual Gross Rent $7,877,537 $8,113,863 $8,357,279 $8,607,997 $8,866,237 $9,132,224 $9,406,191 $9,688,377 $9,979,028 $10,278,399 Less: Vacancies 20% $1,575,507 $1,622,773 $1,671,456 $1,721,599 $1,773,247 $1,826,445 $1,881,238 $1,937,675 $1,995,806 $2,055,680 Effective Gross Income $6,302,030 $6,491,090 $6,685,823 $6,886,398 $7,092,990 $7,305,780 $7,524,953 $7,750,702 $7,983,223 $8,222,719 HOA (Maintanace) 2,914,719$ 3,002,161$ 3,092,225$ 3,184,992$ 3,280,542$ 3,378,958$ 3,480,327$ 3,584,737$ 3,692,279$ 3,803,047$ Real Estate Taxes 1,598,894$ 1,646,861$ 1,696,267$ 1,747,155$ 1,799,569$ 1,853,556$ 1,909,163$ 1,966,438$ 2,025,431$ 2,086,194$ Concessions -$ -$ -$ -$ -$ -$ -$ -$ -$ -$ Insurace fees 780,013$ 803,413$ 827,515$ 852,341$ 877,911$ 904,248$ 931,376$ 959,317$ 988,097$ 1,017,739$ Management Fees 541,262$ 557,499$ 574,224$ 591,451$ 609,195$ 627,470$ 646,295$ 665,683$ 685,654$ 706,223$ Annual Utilities 100,000$ 103,000$ 106,090$ 109,273$ 112,551$ 115,927$ 119,405$ 122,987$ 126,677$ 130,477$ Replacement Resesrves 415,200$ 427,656$ 440,486$ 453,700$ 467,311$ 481,331$ 495,771$ 510,644$ 525,963$ 541,742$ Contingency 635,009$ 654,059$ 673,681$ 693,891$ 714,708$ 736,149$ 758,234$ 780,981$ 804,410$ 828,542$ Total Operating Expenses $6,985,096 7,194,649$ 7,410,488$ 7,632,803$ 7,861,787$ 8,097,640$ 8,340,570$ 8,590,787$ 8,848,510$ 9,113,966$ -$683,066 -$703,558 -$724,665 -$746,405 -$768,797 -$791,861 -$815,617 -$840,085 -$865,288 -$891,246 Annual Payment $0.00 $0.00 $0.00 $0.00 $0.00 $0.00 $0.00 $0.00 $0.00 $0.00 Cash Flow After Financing (CAF) or Cash Flow Before taxes (CFBT) ($683,066.15) ($703,558.14) ($724,664.88) ($746,404.83) ($768,796.97) ($791,860.88) ($815,616.71) ($840,085.21) ($865,287.77) ($891,246.40) Tax Payment (see of sheet calculation) ($1,070,100.80) ($1,073,074.12) ($1,076,136.63) ($1,079,291.02) ($1,082,540.04) ($1,085,886.53) ($1,089,333.42) ($1,092,883.71) ($1,096,540.51) ($1,100,307.02) Cash Flow After Taxes (CFAT) $387,034.65 $369,515.98 $351,471.75 $332,886.19 $313,743.07 $294,025.65 $273,716.71 $252,798.50 $231,252.75 $209,060.62 Return on Total Assests (ROTA) -0.92% -0.95% -0.98% -1.01% -1.04% -1.07% -1.10% -1.13% -1.17% -1.20% After Tax Return on Equity (ROE) or Cash-on-cash ret 0.52% 0.50% 0.47% 0.45% 0.42% 0.40% 0.37% 0.34% 0.31% 0.28% Calculation of Tax Payment Year 1 Year 2 Year 3 Year 4 Year 5 Year 6 Year 7 Year 8 Year 9 Year 10 Cash Flow After Finaning ($683,066.15) ($703,558.14) ($724,664.88) ($746,404.83) ($768,796.97) ($791,860.88) ($815,616.71) ($840,085.21) ($865,287.77) ($891,246.40) Add: Replacement Reserves $415,200 $427,656 $440,486 $453,700 $467,311 $481,331 $495,771 $510,644 $525,963 $541,742 Less: Depreciation 2,624,298.18$ 2,624,298.18$ 2,624,298.18$ 2,624,298.18$ 2,624,298.18$ 2,624,298.18$ 2,624,298.18$ 2,624,298.18$ 2,624,298.18$ 2,624,298.18$ Acumilated Depreciation 26,242,982$ Taxable income ($2,892,164.34) ($2,900,200.32) ($2,908,477.38) ($2,917,002.76) ($2,925,783.90) ($2,934,828.47) ($2,944,144.38) ($2,953,739.76) ($2,963,623.01) ($2,973,802.76) Tax Rate 37% 37% 37% 37% 37% 37% 37% 37% 37% 37% Tax Payable ($1,070,100.80) ($1,073,074.12) ($1,076,136.63) ($1,079,291.02) ($1,082,540.04) ($1,085,886.53) ($1,089,333.42) ($1,092,883.71) ($1,096,540.51) ($1,100,307.02) Expenses Income 52800*(1.03)^9 132000*(1.03)^9 Assumptions 2574432*(1.03)^9 50,4000*(1.05)^9 Free and Clear Cash Flow (F&C) or Net Operating Income (NOI) Assumptions Debt Service
- 5. Year of Sale Free and Clear Cash Flow on Year of Sale (891,246)$ 10 Cap Rate 0% Capitalized Value or Selling Price (Value = income /R) -$316,131,341 1.Calculation of Book Value Purchase Price or Total Development Cost $74,155,266 Add: Capital Improvements $3,707,763.31 Less:Accumulated Depreciation 26,242,981.82$ = Net Book value $51,620,047.69 2. Calculation of gain on Sale Selling Price -$316,131,341 Less: Broker's Commission, Legal Fees (10%) (15,806,567.04)$ Net Selling Price (300,324,773.71)$ Less: Net Book Value $51,620,047.69 Gain on Sale -$351,944,821.40 3. Calculation of Tax Payment Gain on Sale -$351,944,821.40 Multiplied by: Capital gain Tax Rate 15% Capital Gain Tax Liability -$52,791,723.21 4. Calculation of Net Cash to Seller Net Sale Price -$300,324,773.71 Less: Capital Gain Tax Liability -$52,791,723.21 Net Cash From Sale -$247,533,050.50 Estimate Selling Price Using the Cap Rate Net Cash from Sale
- 6. Year 1 Year 2 Year 3 Year 4 Year 5 Year 6 Year 7 Year 8 Year 9 Year 10 1. Calculate Total Cash Flow for Each Year Cash Flow after taxes 387,035$ 369,516$ 351,472$ 332,886$ 313,743$ 294,026$ 273,717$ 252,799$ 231,253$ 209,061$ add: net cash from sale -$ -$ -$ -$ -$ -$ -$ -$ -$ (247,533,050)$ total cash flow for each year (1-10) 387,035$ 369,516$ 351,472$ 332,886$ 313,743$ 294,026$ 273,717$ 252,799$ 231,253$ (247,323,990)$ 2. Calculate the Discount Factor (=1/(1+i)^n), where the discount rate of the investor is assumed to be 12% Discount Factor Formula for each year 1/(1+.12)^1 1/(1+.12)^2 1/(1+.12)^3 1/(1+.12)^4 1/(1+.12)^5 1/(1+.12)^6 1/(1+.12)^7 1/(1+.12)^8 1/(1+.12)^9 1/(1+.12)^10 Discount Factor 0.8928571 0.7971939 0.7117802 0.6355181 0.5674269 0.5066311 0.4523492 0.4038832 0.3606100 0.3219732 3. Present Value (PV) of each cash flow total cash flow for each year multiplied by the year's discount factor 345,567$ 294,576$ 250,171$ 211,555$ 178,026$ 148,963$ 123,816$ 102,101$ 83,392$ (79,631,706)$ 4. Net Present Value (NPV) Present Value of all total cash flows (1-10) (77,893,540)$ Less: Equity invested 74,155,266$ NPV (152,048,806)$ Calculation of Discounted Cash Flow, Net Present Value (NPV)
- 7. Year 1 Year 2 Year 3 Year 4 Year 5 Year 6 Year 7 Year 8 Year 9 1. Total Cash Flow for Each Year ($74,155,266) $387,034.65 $369,515.98 $351,471.75 $332,886.19 $313,743.07 $294,025.65 $273,716.71 $252,798.50 $231,252.75 2. Calculate the IRR (=1/(1+i)^n) Discount Factor Formula for each year 1/(1+.32)^1 1/(1+.32)^2 1/(1+.18)^3 1/(1+.18)^4 1/(1+.18)^5 1/(1+.18)^6 1/(1+.18)^7 1/(1+.18)^8 1/(1+.18)^9 Discount Factor 0.757575758 0.573921028 0.434788658 0.329385347 0.249534354 0.189041177 0.143213013 0.108494707 0.08219296 3. Present Value (PV) of each cash flow total cash flow for each year multiplied by the year's discount factor 293,208.07$ 212,072.99$ 152,815.93$ 109,647.83$ 78,289.67$ 55,582.96$ 39,199.79$ 27,427.30$ 19,007.35$ 4. Net Present Value (NPV) Present Value of all total cash flows (1-10) (14,412,968.35)$ Less: Equity invested $74,155,266 NPV (88,568,234.55)$ Off-Sheet Verification Years Calculation of the Internal Rate of Return (IRR) by Interpolation
- 9. 2008 2009 Jul Oct Jan Apr Jul Start Date End Date Q3 Q4 Q1 Q2 Q3 Pre-Development Community Planning Current Ongoing RFP Process Current Jan-09 Coordinate Financing Current Oct-08 Regulatory/permit Approcval Oct-08 Apr-09 Contracor Negotiations Jan-08 Jul-11 Jan-08 Jul-09 Oct-08 Jul-10 Development Site Excavation Jul-09 Jan-10 Constructin Apr-10 Apr-11 Retail Occupancy Jul-11 Jan-12 Low-Income Occupancy Jul-11 Apr-12 Market rate Occupancy Jul-11 Oct-12 Operations Marketing & Leasing Jul-11 Ongoing Property Management Oct-11 Ongoing
- 10. 2010 2011 2012 2013 Oct Jan Apr Jul Oct Jan Apr Jul Oct Jan Apr Jul Oct Jan Apr Jul Q4 Q1 Q2 Q3 Q4 Q1 Q2 Q3 Q4 Q1 Q2 Q3 Q4 Q1 Q2 Q3
- 11. Oct Q4
- 12. SOURCES of Funds Sources Closing Month 1 Month 2 Month 3 Month 4 Month 5 Month 6 Month 7 Month 8 Month 9 Month 10 Month 11 Total Sources $0 Sterling America Equity $50,000,000 $270,546 $269,454 $59,666 $334 $600,000 Condo Sales #REF! $114,814 $374,418 $5,768 $6,187 $12,033 $9,305 $27,475 $550,000 Condo Leases #REF! #REF! ($370,718) ($5,068) $700 $3,700 $143,822 $72,747 #REF! Cable ($66,967) ($66,967) ($66,967) ($66,967) ($267,866) $0 $0 Total Sources #REF! #REF! $270,546 $384,268 $3,700 $700 $700 $3,700 $143,822 $71,633 ($54,934) ($57,662) ($39,158) #REF! #REF! $254,512 $373,568 $0 $0 $0 $0 $143,122 $137,900 $3,033 $3,305 $99,857 #REF! USES of Funds USES Closing Month 1 Month 2 Month 3 Month 4 Month 5 Month 6 Month 7 Month 8 Month 9 Month 10 Month 11 Total Uses Acquisition Costs: Acquisition: Building $72,168,200 $72,168,200 $72,168,200 SUBTOTAL: ACQUISITION COST $72,168,200 $72,168,200 $0 $0 $0 $0 $0 $0 $0 $0 $0 $0 $0 $72,168,200 Construction Costs: 10% 15% 15% 20% 15% 15% 5% 5% Contract Amount $0 $0 $0 $0 $0 $0 $0 $0 $0 $0 $0 $0 $0 Contingency $0 $0 $0 $0 $0 $0 $0 $0 $0 $0 $0 $0 $0 SUBTOTAL: CONSTRUCTION COST $0 $0 $0 $0 $0 $0 $0 $0 $0 $0 $0 $0 $0 General Development Costs: Developer Fee $1,443,364.00 Inspection & Services $0.00 $0 $0 $0 $0 $0 $0 $0 $0 $0 Permits $5,550.00 $5,550 $5,550 Clerk $32,000.00 $32,000 $32,000 RE Taxes $1,598,894.00 $8,527 $8,527 Titleand Recording $15,000.00 $24,666 $5,334.00 $30,000 TitleInsurance $60,000.00 $10,000 $10,000 $20,000 Impact Fees $0.00 $0 $0 $0 $0 $0 $0 $0 $0 $0 Appraisal $5,000.00 $45,000 $45,000 Cost Certification/Accounting $12,000.00 $3,000 $3,000 $3,000 $3,000 $12,000 Legal: $50,000.00 $1,000 $700 $700 $700 $700 $700 $700 $700 $700 $6,600 Developer Overhead $9,000.00 $4,296 $4,296 Marketing $80,000.00 $12,000 $12,000 Soft Cost Contingency $25,000.00 $35,000 $6,000 $6,000 $6,000 $53,000 Repay Sterling America $94,622.20 ($66,967) ($66,967) ($66,967) ($157,015) ($357,914) SUBTOTAL: SOFT COSTS $1,987,066.20 $159,039 $16,034 $10,700 $3,700 $700 $700 $3,700 $700 ($66,267) ($57,967) ($60,967) ($139,015) ($128,941) TOTAL ACQ., CONSTR., & SOFT COSTS $0.00 $72,327,239 $16,034 $10,700 $3,700 $700 $700 $3,700 $700 ($66,267) ($57,967) ($60,967) ($139,015) $72,039,259 $0 $0 $0 Total DEVELOPMENT COST $0 $72,327,239 $16,034 $10,700 $3,700 $700 $700 $3,700 $700 ($66,267) ($57,967) ($60,967) ($139,015) $72,039,259