Lean logistics operations process map
•
6 gostaram•7,759 visualizações

This document outlines a lean logistics operations process map to streamline processes, reduce inventory, and control supply chain networks. The process map details four phases - Plan, Do, Check, Act - to continuously improve customer satisfaction, reliability, supplier performance, and total logistics costs through strategic planning, tactical execution, performance monitoring, and root cause analysis. Key performance indicators are tracked to stabilize and sustain the lean supply chain long-term.

Recomendados
Mais conteúdo relacionado
Mais procurados
Mais procurados (20)
Destaque
Destaque (10)
Semelhante a Lean logistics operations process map
Semelhante a Lean logistics operations process map (20)
Mais de LeanCor Supply Chain Group
Mais de LeanCor Supply Chain Group (9)
Último
Último (20)
Lean logistics operations process map
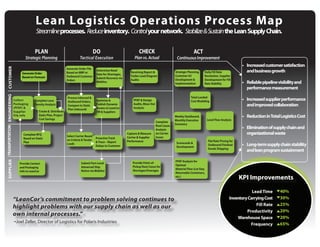
- 1. Lean Logistics Operations Process Map Streamline processes. Reduce inventory. Control your network. Stabilize & Sustain the Lean Supply Chain. PLAN DO CHECK ACT Strategic Planning Tactical Execution Plan vs. Actual Continuous Improvement • Increased customer satisfaction CUSTOMER Generate Order File Generate Order Based on MRP or Determine Need Receiving Report & Strategic Planning, Daily Fill Rate and business growth Date for Shortages, Based on Forecast Outbound Customer Trailer Load Diagram Customer A3 Resolution, Supplier Submit Recovery via Orders Audits Development & Development for Fill Weblinx Implementation Rate Stability • Reliable pipeline visibility and performance measurement SUPPLIER TRANSPORTATION ENGINEERING Process Inbound & Total Landed Collect Complete Lane Outbound Orders, Optimize & PFEP & Design Cost Modeling • Increased supplier performance Packaging Density Analysis Compare to Static Publish Dynamic Audits, Blow-Out and improved collaboration (PFEP) & Plan (Inbound) Routes to LeanCor Analysis Supplier Create & Distribute TM & Suppliers File Info Static Plan, Project Weekly Dashboard, • Reduction in Total Logistics Cost Cost Savings Monthly Executive Level Flow Analysis Complete Summary Root Cause Analysis • Elimination of supply chain and Complete RFQ Capture & Measure on Carrier organizational waste Select Carrier Based Carrier & Supplier Issues Based on Static Proactive Track on Criteria & Tender Performance Flat Rate Pricing for Plan & Trace – Report Scorecards & Loads Delays to Customer Development Outbound Finished • Long-term supply chain stability Goods Shipping and lean program sustainment Provide Point-of- PFEP Analysis for Provide Contact Submit Part-Level Pickup Root Cause for Optimal and Packaging Advanced Ship Shortages/Overages Material Flow (Lot Size, Info to LeanCor Notice via Weblinx Returnable Containers, etc.) KPI Improvements Lead Time 40% “LeanCor’s commitment to problem solving continues to Inventory Carrying Cost 30% Fill Rate 25% highlight problems with our supply chain as well as our Productivity 20% own internal processes.” Warehouse Space 20% -Joel Zeller, Director of Logistics for Polaris Industries Frequency 65%