1. The Development of a Pipeline for the Characterization of
Novel Small RNAs Discovered via NextGen Sequencing of
Clinical Blood Samples
Kareem Osman, John Chevillet, Kelsey Scherler, David Baxter, Xiaogang Wu, Taek-Kyun Kim,
and Kai Wang
Introduction
The Pipeline
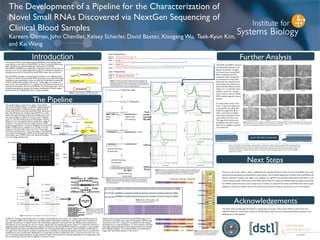
Further Analysis
Next Steps
Acknowledgements
Band 1
Band 2
The advent of Next Gen Sequencing and RNAseq has enabled major
exploration in the realm of small RNA. Cell-free circulating RNAs have
been identified as potential diagnostic biomarkers of disease.
MicroRNAs (miRNAs) are especially intriguing, as their function has im-
plications on various physiological processes. It is therefore valuable to
develop protocols to characterize novel RNAs when they are found.
During RNAseq analysis of patient blood samples in an ongoing study
of sepsis, hundreds of novel small RNA sequences were disovered. Eight
sequences were specifically chosen as they were identified consistently
in both whole blood samples and serum. These eight are chosen as a
pilot set for the development of a pipeline for the characterization and
functional assessment of novel small RNAs.The following project aims to
achieve these goals by taking a thorough consideration of each experi-
mental factor to ultimately produce a robust pipeline.
The pipeline gets its input from either whole blood
cell or serum RNA (Figure 2.) cDNAs originating from
whole blood RNA are obained from a sepsis study. 8
novel small RNAs previously identified from these sam-
ples with RNAseq are verified using qPCR.Two candi-
dates with appropriate products by melting curve anal-
ysis were chosen to follow, Cad 3 and Cad 7 (Figures
3 and 4.) Gel Electrophoresis and Bioanalyzer analysis
(Figure 5.) are next performed to reveal their range of
products more specifically.The length of each cDNA
products is predicted to result in fragments of minimum
length of 80bp (from a sequence of ~20 bp. It is inter-
esting to note that both Cad 3 and Cad 7 have larger
secondary products form. The next stage in the pipeline
is to excise and elute the cDNAs from each gel band to
clone them into a TOPO vector for bacterial transfec-
tion and Sanger Sequencing.
TOPO TA Cloning is next performed to transfect and proliferate Cad 3 and 7 on a larger scale.Transformation of
the invitrogen TOPO vector (Figure 6.) into Alpha Select chemically competent E. coli is performed. 6 colonies are
selected to proliferate in liquid culture.The recombinant plasmid is extracted with the QiaPrep spin miniprep kit,
and aliquots of each sample are sent for Sanger sequencing.The sequencing results (Figure 7.) reveal the variation in
fragment length of these RNA products may be functional, as the queried RNA sequence is present in each product.
With evidence that these identified small RNAs are real and polymorphic, another round of qPCR is perfomed on
the sepsis and control plasma samples, revealing more candidates to develop the pipeline with.There is an observed
temperature and concentration dependence in many these products (Figure 8.) Cad 1, Cad 2-5p, and Cad 3 are cho-
sen to continue experimentation, as they consist of either one product or the least dependence on temperature and
not concentration, factors that are difficult to control in-vitro.
Figure 7. Analysis of the Sanger sequencing results reveals that the
smallest of the multiple products observed via gel elecrophoresis and
Bioanalyzer analysis all contain the query sequence of the RNA product
(red), followed by the poly-A tail and Quantitect universal tag (blue), and
sometimes followed by an unknown sequence (green).
Figure 9. Reverse Transcription of NCI-60 cell line RNA is next performed
using the miScript II RT kit (HiSpec Buffer) to identify cell lines with high rel-
ative abundance of all Cad 1, Cad 2, and Cad 3 primer products (indicated by
low CT during qPCR).
Figure 8. Melt Curve analysis of the qPCR of cDNA using each of the eight small
RNA primers reveals an annealing temperature dependance in the the Cad 4 prod-
uct (above quadrant, highlighted dark green) and a cDNA concentration depen-
dance in the observed products of primers 5, 6, and 7 (lower quadrant).
Reverse Transcription of NCI-60 cell line RNA (Figure 9.) is
performed to broaden the scope of this pipeline. qPCR using
the primers for Cad 1, 2-5p, and 3 is performed and relative
abundances are compared (Figure 11.) Once specific cell lines
with high relative abundance of all three products are chosen,
IDT inhibitors (Figure 10.) of these RNAs are purchased to
begin their functional analysis in cell culture.
Figure 1. Two of the eight novel sequences are cho-
sen first to analyze (referred to as Cad 3 and Cad 7)
Figure 3. Gel Image of
Cad 3 Products
There are still further steps to take in establishing this pipeline.While a number of novel small RNAs have been
characterized,sequenced,and assessed for conservation, the functional significance of these novel small RNAs still
remains unknown. Function may begin to be analyzed via a qPCR of the purified experimental cell RNAs vs the
control samples and/or qPCR of the same RNA with primers for these small RNAs potential targets should they
be miRNAs (determined by custom target scan). If evidence is obtained that these small RNAs have roles in gene
regulation, microarray analysis may then be performed to discover systemic alterations to the transcriptome.
We thank those funding agencies below for supporting this project. Also, special thanks to Arian Smit who
helped facilitate the conservation study and the ISB Sequencing Core who maintained facilities essential to the
development of this pipeline.
Figure 4. Gel Image of Cad 7 Products
Figure 2. RNA may be extracted
from both whole blood and serum
samples. cDNAs obtained from
whole blood samples provide the
initial input to the pipeline
cle
Figure 5. Bioanalyzer Chromatograph of Cad 4 and Cad 7 products.
Figure 6. The invitrogenTOPO
TA Cloning kit was used to gen-
erate recombinant plasmid for
transfection of alpha select K12
strain Ecoli.
Figure 10. IDT inhibitor design: a Zen
modified reverse and complement strand
to each novel small RNA analyzed
Figure 11. Heatmap generated to analyze the
relative abundance of Cad 1, Cad 2, and Cad
3 products in the NCI-60 and LNCaP,Tera1,
293T cell lines via CT threshold analysis
Figure 12. Phase Contrast imaging of transfected and control of A549 and SNB19 cells 24 and 48 hours after transfection with
IDT inhibitors.There does not appear to be any indication of morphologic change or reduced cell viability when comparing the
cell density of the experimental groups with that of the negative controls.
The A549 and SNB19 cell lines
are ultimately selected to un-
dergo the inhibitor transfec-
tion experiment (using RNAi-
MAX Lipofectamine).Two
timepoints after transfection
are examined to empirically
determine the required time-
frame before the cultures are
lysed and their RNAs purified
(Figure 12.) A miR-34a mimic
positive control for transfec-
tion is used, as well as a RNAi-
MAX-treated negative control
(water).
A conservation study of the
Cad 1, 2-5p, and 3 sequences
is also performed using the
PhastCons algorithm. Both
Cad 1 and Cad 3 are highly
conserved in eutherian mam-
mals, while Cad 2-5p is not.
The algorithm indicates the
probability that each nucleo-
tide and its neighbors queried
are conserved.
Figure 13. The UCSC Genome Browser is used to perform a conservation analysis of Cad 1-3 through a BLAT and subsequent anal-
ysis using the PhastCons algorithm. PhastCons indicates that both Cad 1 and Cad 3 have 100% base-pair conservation through ~70%
of the query length when compared against the UCSC database of 100 vertebrates.These results furthermore indicate complete
conservation in eutherian mammals. Cad 2-5p, however, is not highly conserved, displaying a PhastCons score of 0 across alleach
basepair of its sequence.
P50 GM076547