SlideShare uma empresa Scribd logo
1 de 2
Baixar para ler offline
Job Aid
IEA RegAction
1 | P a g e
3.1.3 How to get Help
There are three ways to access the help tools in the regAction system:
1. Live Support – Click on the Live Support icon at the top left to
chat in real time with a support specialist from regAction. When the
button shows ONLINE, a person is available to chat.
2. Click on the Help hyperlink – Located at the top center of the
browser to access help pertinent to the current screen.
3. Call – Place a phone call to: IEA regAction at the phone
number at the bottom of any page in the system.
5.2.1 Data Entry
Data entry can be completed in a manual process via the web interface.
This is typically more applicable for cases when only a few values need
to be entered or adjusted. The spreadsheet interface described
previously is typically more convenient for bulk data entry. To add data:
1. Click the Data Entry button under the Activities menu.
2. Select the Unit/Year Range from the top middle dropdown list.
3. Click on the Area (Period) for which data will be entered.
4. Select the data entry Period (Year, Quarter, Month, Week) from the
top left corner dropdown list(s).
5.2.1 Data Entry (Cont.)
5. Enter data as it applies for the different metrics on the selected time
periods.
6. To enter a comment, click on the Comment bubble icon next to the
Data Value entered.
7. Type your comment on the text box.
8. Click Ok to save your comment.
9. Click the Save button to save the data entered in the screen.
10. To enter data for other Units/Areas/periods repeat steps #2
through #9.
Notes
• The data entry page view will differ depending on the template for
the currently selected site.
• Each parameter name can be clicked to display an historical view of
the value including the data of entry and the employee who entered
the data.
• Comments display in a popup entry dialog. The comment indicator
will display green where there are existing comments.
• When data limits exist an ! icon will display on the far right of the
parameter row. Placing your mouse over the icon will display
information on the defined limit.
5.2.2 Bulk Data Upload
The data request capability of the Sustainability application allows a
user to download/upload bulk data via a convenient spreadsheet
interface. The spreadsheet interface produces a workbook that can be
completed off line and then uploaded into the system. The workbook is
Site/Unit specific and generated for single years. Thus, one bulk upload
workbook needs to be generated for each Unit/Site, for each year.
To generate a new Bulk Data Upload Template:
1. Click the Data Request button under the Maintenance menu.
2. Click on the Download Tab.
3. Select the Year for which data will be uploaded into the system.
4. Select the Unit for which data will be uploaded into the system.
5. Select the Area(s) for which data will be uploaded into the system.
6. Click on Generate Spreadsheet.
7. An Excel template will be downloaded to your computer.
8. Open the file and populate it with the desired data and save it on a
known location.
Job Aid
IEA RegAction
2 | P a g e
5.2.2 Bulk Data Upload (Cont.)
To upload a populated Bulk Data Upload Template:
9. Click the Data Request button under the Maintenance menu.
10. Click on the Upload Tab.
11. Click on the Choose File button and browse for the saved file on
Step #8. You may choose multiple files to upload simultaneously.
12. Click the Upload button.
13. Data will upload if no errors are found. If some errors are found, the
system will alert the user on the errors. Please correct the errors and
then retry steps #9 through #12.
5.3.2 Data Chart Report
The Data Chart Report is the most flexible report in the system, but it
does not allow ownership rules on reported data. To run the Data Chart
Report:
1. Click the Data Chart button under the Reports menu.
2. Select the Site/Units to be included in the report from the list by
clicking on the applicable checkboxes.
3. The middle column that contains all parameters in the system is set
to automatically show common parameters among the Site/Unit
selection. Based on the configuration of the system as it stands, it is
recommended that you remove this filter by unchecking the Common
Parameter Only option at the top of the middle frame of the report
window.
5.3.2 Data Chart Report (Cont.)
4. Select the parameters that you want to report by clicking the
appropriate checkboxes next to each applicable metric.
5. Click the top arrow to the left of the Selected Items list
6. If you want to normalize data, repeat Step #4, and click the top arrow
to the left of the Divisor list.
7. To run the report, click on the View Chart button. A separate tab
will open on your browser displaying the report results. If you click the
View Report button, it will display a tabular report instead of a graph.
The report viewer tab that opens when you run either report allows the
user to switch back and forth between tabular and chart view. Thus, we
recommend using the View Chart option and follow the instructions
below to navigate inside the Report Viewer screen to switch between
reports or see both simultaneously.
Report Viewer Options
a. On the new tab that is generated after running the report, the user
can change the reporting frequency and the reporting year range by
selecting the desired parameters from the top three dropdown lists in
the Report Viewer.
b. The user can also select what to view in the report utilizing the four
checkboxes below the frequency/period selection dropdown lists.
Select one or all of these to generate different views of the report.
c. The user can update the selection(s), by clicking the Update button.
5.3.2 Data Chart Report (Cont.)
d. Alternatively, the user can reset the view by clicking the reset
button.
e. Finally, the user can chose to export the view to Excel by clicking the
Excel button.
f. Both Tables and Graphs are drillable. Click on the different areas of
the report to drill up or down.
g. The chart and tables also display the percent of data completed for
each period and an overall completed data percentage. This helps the
user understand the completeness of the data set being viewed.
h. The user may also change the units displayed on the chart or table by
selecting a new unit available from the dropdown list in the top center
of the table or graph. This will require that the user also clicks on the
Update button to apply the changes.

Mais conteúdo relacionado

Mais procurados

Report Builder Training 7i
Report Builder Training 7iReport Builder Training 7i
Report Builder Training 7iDydacomp
 
6.3 Adding a Control to a Report
6.3 Adding a Control to a Report6.3 Adding a Control to a Report
6.3 Adding a Control to a ReportPyi Soe
 
Access Database Manager for iOS (iPhone and iPad)
Access Database Manager for iOS (iPhone and iPad)Access Database Manager for iOS (iPhone and iPad)
Access Database Manager for iOS (iPhone and iPad)John Li
 
Access Database Manager fro Mac
Access Database Manager fro MacAccess Database Manager fro Mac
Access Database Manager fro MacJohn Li
 
EHughes OSCUI Template
EHughes OSCUI TemplateEHughes OSCUI Template
EHughes OSCUI TemplateEm'mia Hughes
 
Trans data upload SAP BCP 10.0 NW
Trans data upload SAP BCP 10.0 NWTrans data upload SAP BCP 10.0 NW
Trans data upload SAP BCP 10.0 NWSatish Kumar Boddu
 
SAP BPC 10.0 NW FLAT FILE (csv)Master data upload doc
SAP BPC 10.0 NW FLAT FILE (csv)Master data upload docSAP BPC 10.0 NW FLAT FILE (csv)Master data upload doc
SAP BPC 10.0 NW FLAT FILE (csv)Master data upload docSatish Kumar Boddu
 
In press checking with crossref API
In press checking with crossref APIIn press checking with crossref API
In press checking with crossref APIukcorr
 
6.2 Creating a Report Using the Report Wizard
6.2 Creating a Report Using the Report Wizard6.2 Creating a Report Using the Report Wizard
6.2 Creating a Report Using the Report WizardPyi Soe
 
Style Scope Mobile App Documentation
Style Scope Mobile App DocumentationStyle Scope Mobile App Documentation
Style Scope Mobile App DocumentationArleneWatson
 

Mais procurados (10)

Report Builder Training 7i
Report Builder Training 7iReport Builder Training 7i
Report Builder Training 7i
 
6.3 Adding a Control to a Report
6.3 Adding a Control to a Report6.3 Adding a Control to a Report
6.3 Adding a Control to a Report
 
Access Database Manager for iOS (iPhone and iPad)
Access Database Manager for iOS (iPhone and iPad)Access Database Manager for iOS (iPhone and iPad)
Access Database Manager for iOS (iPhone and iPad)
 
Access Database Manager fro Mac
Access Database Manager fro MacAccess Database Manager fro Mac
Access Database Manager fro Mac
 
EHughes OSCUI Template
EHughes OSCUI TemplateEHughes OSCUI Template
EHughes OSCUI Template
 
Trans data upload SAP BCP 10.0 NW
Trans data upload SAP BCP 10.0 NWTrans data upload SAP BCP 10.0 NW
Trans data upload SAP BCP 10.0 NW
 
SAP BPC 10.0 NW FLAT FILE (csv)Master data upload doc
SAP BPC 10.0 NW FLAT FILE (csv)Master data upload docSAP BPC 10.0 NW FLAT FILE (csv)Master data upload doc
SAP BPC 10.0 NW FLAT FILE (csv)Master data upload doc
 
In press checking with crossref API
In press checking with crossref APIIn press checking with crossref API
In press checking with crossref API
 
6.2 Creating a Report Using the Report Wizard
6.2 Creating a Report Using the Report Wizard6.2 Creating a Report Using the Report Wizard
6.2 Creating a Report Using the Report Wizard
 
Style Scope Mobile App Documentation
Style Scope Mobile App DocumentationStyle Scope Mobile App Documentation
Style Scope Mobile App Documentation
 

Semelhante a Nextera Energy Job Aid

GEIT 3341 DATABASE I LAB 2 GEIT 3341 Database I
GEIT 3341  DATABASE I  LAB 2  GEIT 3341 Database I  GEIT 3341  DATABASE I  LAB 2  GEIT 3341 Database I
GEIT 3341 DATABASE I LAB 2 GEIT 3341 Database I MatthewTennant613
 
20230723 Anaplan user guide_vShare_vENG.pptx
20230723 Anaplan user guide_vShare_vENG.pptx20230723 Anaplan user guide_vShare_vENG.pptx
20230723 Anaplan user guide_vShare_vENG.pptxArvizaAzhar1
 
The Ultimate Guide to Ad5 e808 adobe audience manager business practitioner e...
The Ultimate Guide to Ad5 e808 adobe audience manager business practitioner e...The Ultimate Guide to Ad5 e808 adobe audience manager business practitioner e...
The Ultimate Guide to Ad5 e808 adobe audience manager business practitioner e...PennyJose1
 
How to Navigate PerformancePoint 2010 Dashboards and Explore Data - EPC Group
How to Navigate PerformancePoint 2010 Dashboards and Explore Data - EPC GroupHow to Navigate PerformancePoint 2010 Dashboards and Explore Data - EPC Group
How to Navigate PerformancePoint 2010 Dashboards and Explore Data - EPC GroupEPC Group
 
Lsmw for master data upload simple explanation
Lsmw for master data upload simple explanationLsmw for master data upload simple explanation
Lsmw for master data upload simple explanationManoj Kumar
 
Lc solutions sop manual2
Lc solutions sop manual2Lc solutions sop manual2
Lc solutions sop manual2RAVI KANT
 
Create a basic performance point dashboard epc
Create a basic performance point dashboard   epcCreate a basic performance point dashboard   epc
Create a basic performance point dashboard epcEPC Group
 
Management of database information system
Management of database information systemManagement of database information system
Management of database information systemKAZEMBETVOnline
 
Paymo 3 - Get Started Guide
Paymo 3 - Get Started GuidePaymo 3 - Get Started Guide
Paymo 3 - Get Started GuidePaymo
 
Axex Dental Practice Management System Manual (v.1.0)
Axex Dental Practice Management System Manual (v.1.0)Axex Dental Practice Management System Manual (v.1.0)
Axex Dental Practice Management System Manual (v.1.0)Axex Dental
 
Monitoring of computers
Monitoring of computers Monitoring of computers
Monitoring of computers carlosrudy_45
 
Pentaho_Tableau_Comparison
Pentaho_Tableau_ComparisonPentaho_Tableau_Comparison
Pentaho_Tableau_ComparisonSrinivas Rao
 
Chapter 10.1.6
Chapter 10.1.6Chapter 10.1.6
Chapter 10.1.6patcha535
 

Semelhante a Nextera Energy Job Aid (20)

Send ghana
Send ghanaSend ghana
Send ghana
 
GEIT 3341 DATABASE I LAB 2 GEIT 3341 Database I
GEIT 3341  DATABASE I  LAB 2  GEIT 3341 Database I  GEIT 3341  DATABASE I  LAB 2  GEIT 3341 Database I
GEIT 3341 DATABASE I LAB 2 GEIT 3341 Database I
 
20230723 Anaplan user guide_vShare_vENG.pptx
20230723 Anaplan user guide_vShare_vENG.pptx20230723 Anaplan user guide_vShare_vENG.pptx
20230723 Anaplan user guide_vShare_vENG.pptx
 
Reporting
ReportingReporting
Reporting
 
The Ultimate Guide to Ad5 e808 adobe audience manager business practitioner e...
The Ultimate Guide to Ad5 e808 adobe audience manager business practitioner e...The Ultimate Guide to Ad5 e808 adobe audience manager business practitioner e...
The Ultimate Guide to Ad5 e808 adobe audience manager business practitioner e...
 
User preference Option in Oracle Primavera EPPM P6
User preference Option in Oracle Primavera EPPM P6User preference Option in Oracle Primavera EPPM P6
User preference Option in Oracle Primavera EPPM P6
 
Simplymap guide
Simplymap guideSimplymap guide
Simplymap guide
 
How to Navigate PerformancePoint 2010 Dashboards and Explore Data - EPC Group
How to Navigate PerformancePoint 2010 Dashboards and Explore Data - EPC GroupHow to Navigate PerformancePoint 2010 Dashboards and Explore Data - EPC Group
How to Navigate PerformancePoint 2010 Dashboards and Explore Data - EPC Group
 
Lsmw for master data upload simple explanation
Lsmw for master data upload simple explanationLsmw for master data upload simple explanation
Lsmw for master data upload simple explanation
 
Lc solutions sop manual2
Lc solutions sop manual2Lc solutions sop manual2
Lc solutions sop manual2
 
Create a basic performance point dashboard epc
Create a basic performance point dashboard   epcCreate a basic performance point dashboard   epc
Create a basic performance point dashboard epc
 
Adi manual
Adi manualAdi manual
Adi manual
 
Management of database information system
Management of database information systemManagement of database information system
Management of database information system
 
社會網絡分析UCINET Quick Start Guide
社會網絡分析UCINET Quick Start Guide社會網絡分析UCINET Quick Start Guide
社會網絡分析UCINET Quick Start Guide
 
Paymo 3 - Get Started Guide
Paymo 3 - Get Started GuidePaymo 3 - Get Started Guide
Paymo 3 - Get Started Guide
 
Report designer
Report designerReport designer
Report designer
 
Axex Dental Practice Management System Manual (v.1.0)
Axex Dental Practice Management System Manual (v.1.0)Axex Dental Practice Management System Manual (v.1.0)
Axex Dental Practice Management System Manual (v.1.0)
 
Monitoring of computers
Monitoring of computers Monitoring of computers
Monitoring of computers
 
Pentaho_Tableau_Comparison
Pentaho_Tableau_ComparisonPentaho_Tableau_Comparison
Pentaho_Tableau_Comparison
 
Chapter 10.1.6
Chapter 10.1.6Chapter 10.1.6
Chapter 10.1.6
 

Nextera Energy Job Aid

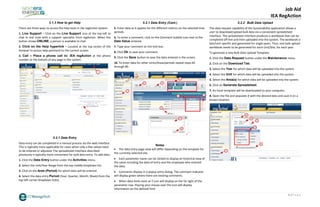
  • 1. Job Aid IEA RegAction 1 | P a g e 3.1.3 How to get Help There are three ways to access the help tools in the regAction system: 1. Live Support – Click on the Live Support icon at the top left to chat in real time with a support specialist from regAction. When the button shows ONLINE, a person is available to chat. 2. Click on the Help hyperlink – Located at the top center of the browser to access help pertinent to the current screen. 3. Call – Place a phone call to: IEA regAction at the phone number at the bottom of any page in the system. 5.2.1 Data Entry Data entry can be completed in a manual process via the web interface. This is typically more applicable for cases when only a few values need to be entered or adjusted. The spreadsheet interface described previously is typically more convenient for bulk data entry. To add data: 1. Click the Data Entry button under the Activities menu. 2. Select the Unit/Year Range from the top middle dropdown list. 3. Click on the Area (Period) for which data will be entered. 4. Select the data entry Period (Year, Quarter, Month, Week) from the top left corner dropdown list(s). 5.2.1 Data Entry (Cont.) 5. Enter data as it applies for the different metrics on the selected time periods. 6. To enter a comment, click on the Comment bubble icon next to the Data Value entered. 7. Type your comment on the text box. 8. Click Ok to save your comment. 9. Click the Save button to save the data entered in the screen. 10. To enter data for other Units/Areas/periods repeat steps #2 through #9. Notes • The data entry page view will differ depending on the template for the currently selected site. • Each parameter name can be clicked to display an historical view of the value including the data of entry and the employee who entered the data. • Comments display in a popup entry dialog. The comment indicator will display green where there are existing comments. • When data limits exist an ! icon will display on the far right of the parameter row. Placing your mouse over the icon will display information on the defined limit. 5.2.2 Bulk Data Upload The data request capability of the Sustainability application allows a user to download/upload bulk data via a convenient spreadsheet interface. The spreadsheet interface produces a workbook that can be completed off line and then uploaded into the system. The workbook is Site/Unit specific and generated for single years. Thus, one bulk upload workbook needs to be generated for each Unit/Site, for each year. To generate a new Bulk Data Upload Template: 1. Click the Data Request button under the Maintenance menu. 2. Click on the Download Tab. 3. Select the Year for which data will be uploaded into the system. 4. Select the Unit for which data will be uploaded into the system. 5. Select the Area(s) for which data will be uploaded into the system. 6. Click on Generate Spreadsheet. 7. An Excel template will be downloaded to your computer. 8. Open the file and populate it with the desired data and save it on a known location.
  • 2. Job Aid IEA RegAction 2 | P a g e 5.2.2 Bulk Data Upload (Cont.) To upload a populated Bulk Data Upload Template: 9. Click the Data Request button under the Maintenance menu. 10. Click on the Upload Tab. 11. Click on the Choose File button and browse for the saved file on Step #8. You may choose multiple files to upload simultaneously. 12. Click the Upload button. 13. Data will upload if no errors are found. If some errors are found, the system will alert the user on the errors. Please correct the errors and then retry steps #9 through #12. 5.3.2 Data Chart Report The Data Chart Report is the most flexible report in the system, but it does not allow ownership rules on reported data. To run the Data Chart Report: 1. Click the Data Chart button under the Reports menu. 2. Select the Site/Units to be included in the report from the list by clicking on the applicable checkboxes. 3. The middle column that contains all parameters in the system is set to automatically show common parameters among the Site/Unit selection. Based on the configuration of the system as it stands, it is recommended that you remove this filter by unchecking the Common Parameter Only option at the top of the middle frame of the report window. 5.3.2 Data Chart Report (Cont.) 4. Select the parameters that you want to report by clicking the appropriate checkboxes next to each applicable metric. 5. Click the top arrow to the left of the Selected Items list 6. If you want to normalize data, repeat Step #4, and click the top arrow to the left of the Divisor list. 7. To run the report, click on the View Chart button. A separate tab will open on your browser displaying the report results. If you click the View Report button, it will display a tabular report instead of a graph. The report viewer tab that opens when you run either report allows the user to switch back and forth between tabular and chart view. Thus, we recommend using the View Chart option and follow the instructions below to navigate inside the Report Viewer screen to switch between reports or see both simultaneously. Report Viewer Options a. On the new tab that is generated after running the report, the user can change the reporting frequency and the reporting year range by selecting the desired parameters from the top three dropdown lists in the Report Viewer. b. The user can also select what to view in the report utilizing the four checkboxes below the frequency/period selection dropdown lists. Select one or all of these to generate different views of the report. c. The user can update the selection(s), by clicking the Update button. 5.3.2 Data Chart Report (Cont.) d. Alternatively, the user can reset the view by clicking the reset button. e. Finally, the user can chose to export the view to Excel by clicking the Excel button. f. Both Tables and Graphs are drillable. Click on the different areas of the report to drill up or down. g. The chart and tables also display the percent of data completed for each period and an overall completed data percentage. This helps the user understand the completeness of the data set being viewed. h. The user may also change the units displayed on the chart or table by selecting a new unit available from the dropdown list in the top center of the table or graph. This will require that the user also clicks on the Update button to apply the changes.