Recent Trends in Employer-Sponsored Insurance - jama 111114
•
2 gostaram•5,090 visualizações

Recent Trends in Employer-Sponsored Insurance

Recomendados
Recomendados
Mais conteúdo relacionado
Mais procurados
Mais procurados (20)
Semelhante a Recent Trends in Employer-Sponsored Insurance - jama 111114
Semelhante a Recent Trends in Employer-Sponsored Insurance - jama 111114 (20)
Mais de KFF
Mais de KFF (20)
Último
Último (20)
Recent Trends in Employer-Sponsored Insurance - jama 111114
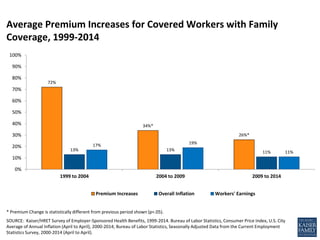
- 1. 72% 34%* 26%* 13% 13% 11% 17% 19% 11% 0% 10% 20% 30% 40% 50% 60% 70% 80% 90% 100% 1999 to 2004 2004 to 2009 2009 to 2014 Premium Increases Overall Inflation Workers' Earnings * Premium Change is statistically different from previous period shown (p<.05). SOURCE: Kaiser/HRET Survey of Employer-Sponsored Health Benefits, 1999-2014. Bureau of Labor Statistics, Consumer Price Index, U.S. City Average of Annual Inflation (April to April), 2000-2014; Bureau of Labor Statistics, Seasonally Adjusted Data from the Current Employment Statistics Survey, 2000-2014 (April to April). Average Premium Increases for Covered Workers with Family Coverage, 1999-2014
- 2. * Estimate is statistically different from estimate for the previous year shown (p<.05). SOURCE: Kaiser/HRET Survey of Employer-Sponsored Health Benefits, 1999-2014. Average Annual Premiums for Single and Family Coverage, 1999-2014 $16,834* $16,351* $15,745* $15,073* $13,770* $13,375* $12,680* $12,106* $11,480* $10,880* $9,950* $9,068* $8,003* $7,061* $6,438* $5,791 $6,025 $5,884* $5,615* $5,429* $5,049* $4,824 $4,704* $4,479* $4,242* $4,024* $3,695* $3,383* $3,083* $2,689* $2,471* $2,196 $0 $2,000 $4,000 $6,000 $8,000 $10,000 $12,000 $14,000 $16,000 $18,000 2014 2013 2012 2011 2010 2009 2008 2007 2006 2005 2004 2003 2002 2001 2000 1999 Single Coverage Family Coverage
- 3. $6,472 $4,497 $4,823 $7,706 $13,084 $12,011 $0 $2,000 $4,000 $6,000 $8,000 $10,000 $12,000 $14,000 $16,000 $18,000 $20,000 Many Workers are Lower-Wage Many Workers are Higher-Wage All Firms $14,177 $17,582 $16,834 Average Worker and Employer Premium Contributions For Covered Workers at Higher- and Lower-Wage Firms Enrolled in Family Coverage, 2014 *Estimate for many workers are lower-wage is statistically different from estimate for many workers are higher-wage, within coverage type (p<.05). NOTE: Firms with many lower-wage workers are ones where 35% or more of employees earn $23,000 or less. Firms with many higher-wage workers are ones where 35% or more of employees earn $57,000 or more. Wage cutoffs are the inflation adjusted- 25th and 75th percentile of national wages according to Bureau of Labor Statistics using data from the Occupational Employment Statistics (OES). 1% of covered workers are in firms which are both high income and low income, excluding these firms does not change the estimates or significance testing. SOURCE: Kaiser/HRET Survey of Employer-Sponsored Health Benefits, 2014. Bureau of Labor Statistics. Occupational Employment Statistics Available from: http://www.bls.gov/oes/oes_emp.htm#scope Worker Premium Contribution Employer Premium Contribution
- 4. Among Large Firms (200 or More Workers) Offering Health Benefits, The Prevalence of Various Health Promotion Programs, 2014 98% 51% 51% 0% 20% 40% 60% 80% 100% Offers at least one Wellness Program~ Firm Offers Biometric Screening Firm Provides Employees the Opportunity to Complete a Health Risk Assessment Large Firms (200 or more Workers) *Percent of firms offering incentives is among firms offering health benefits who also offer the specified health program or activity. ~ Includes the following wellness programs: weight loss programs, biometric screenings, gym membership discounts or on-site exercise facilities, smoking cessation program, lifestyle or behavioral coaching, classes in nutrition or healthy living, web-based resources for healthy living, flu shots or vaccinations, or employee assistance programs (EAP) or a wellness newsletter. ``Biometric screening is a health examination that measures an employee's risk factors such as cholesterol, blood pressure, stress, and nutrition. ‡ A health risk assessment includes questions about medical history, health status, and lifestyle and is designed to identify the health risks of the person being assessed. SOURCE: Kaiser/HRET Survey of Employer-Sponsored Health Benefits, 2014.
- 5. Percentage of All Workers Covered by Their Employers’ Health Benefits, in Firms Both Offering and Not Offering Health Benefits, by Firm Size, 1999-2014 * Estimate is statistically different from estimate for the previous year shown (p<.05). SOURCE: Kaiser/HRET Survey of Employer-Sponsored Health Benefits, 1999-2014. 55% 57% 58% 54% 53% 50% 50% 53% 50% 52% 49% 52% 48% 47% 46% 44% 66% 67% 69% 69% 68% 68% 66% 63% 65% 66% 65% 63% 64% 62% 61% 62% 62% 63% 65% 63% 62% 61% 60% 59% 59% 60% 59% 59% 58% 56% 56% 55% 20% 30% 40% 50% 60% 70% 80% 1999 2000 2001 2002 2003 2004 2005 2006 2007 2008 2009 2010 2011 2012 2013 2014 All Small Firms (3-199 Workers) All Large Firms (200 or More Workers) ALL FIRMS
- 6. Among Covered Workers with a General Annual Health Plan Deductible for Single Coverage, Average Deductible, by Firm Size, 2006-2014 NOTE: Note: Average general annual health plan deductibles for PPOs, POS plans, and HDHP/SOs are for in-network services. SOURCE: Kaiser/HRET Survey of Employer-Sponsored Health Benefits, 2006-2014. $775 $852 $1,124 $1,254 $1,391 $1,537 $1,596 $1,715 $1,797 $496 $519 $553 $640 $686 $757 $875 $884 $971 $584 $616 $735 $826 $917 $991 $1,097 $1,135 $1,217 $- $200 $400 $600 $800 $1,000 $1,200 $1,400 $1,600 $1,800 $2,000 2006 2007 2008 2009 2010 2011 2012 2013 2014 All Small Firms (3-199 Workers) All Large Firms (200 or More Workers) ALL FIRMS