SlideShare uma empresa Scribd logo
1 de 17
Baixar para ler offline
ANALYSIS OF EARLY INTERVENTION 45-DAY COMPLIANCE DATA
CALENDAR YEAR 2006 AND CALENDAR YEAR 2007
SUMMARY
OBJECTIVE
This analysis was created to examine how long it took, on average, for children who had an
initial IFSP meeting to move through the 5 distinct stages between referral and the initial
service plan meeting in calendar year 2006 versus how long it took in calendar year 2007. This
was achieved by comparing data from the last 6 months of CY 2006 to the last 6 months of CY
2007.
HIGHLIGHTS (Full report attached)
• In both 2006 and 2007, more than half of new EI children had an initial service plan meeting
which was held well beyond the 45 day from referral date requirement. When measured by
median days, citywide performance in 2007 appears to be only marginally worse than what
it had been in 2006.
• The distribution of new EI children grouped by the length of their referral to initial IFSP
timing reveals that citywide performance was significantly worse in 2007 than it had been in
2006. While the percentage of children who went to initial IFSP on time remained
approximately 30%, the percentage of children with initial IFSP meetings in the very late
category grew from just over 20% in 2006 to almost 30% in 2007.
• Each regional office had very different median day numbers to IFSP, which moved in very
different directions in 2007. The Staten Island Regional Office’s performance improved
dramatically, the Manhattan and Brooklyn Regional Offices each had a small improvement,
and the Queens and Bronx Regional Offices both had showed a significant decline in their
2007 performance.
• Regional Office performance with respect to the distribution of child groups by IFSP process
length was also very mixed across the city. While overall performance of the Staten Island
Regional Office improved dramatically and the Brooklyn Regional Office improved slightly,
the Manhattan Regional Office’s performance was mixed, and both the Bronx and Queens
Regional Offices’ performances were worse in 2007.
APPROACH AND DATA SOURCES
The data used in this analysis was extracted from the following Early Intervention KIDS datasets:
Child, IFSP, Referral (Ecref), House, and Family. These database extracts contained observations
through July 2, 2008. First Health Early Intervention paid claims data with observations through
July 4, 2008 and data extracted from EI DocTrac containing observations through August 20,
2008 were also used in this analysis. See the appendix of this report for a detailed description of
the approach used in the data manipulation piece of this analysis.
REPORT AUTHOR
Josiane Georges, Analyst
August 2008 Office of Policy & Planning
Table 1. Median Days from Referral to IFSP Meeting, CY 2006 and CY 2007
In Stage Cumulative In Stage Cumulative # In Stage # Cumulative
Referral to Initial service coordination 4 4 4 4 0 0
Initial service coordination to First evaluation 11 15 10 14 -1 -1
First evaluation to Last evaluation 7 22 8 22 1 0
Last evaluation to MDE receipt date 13 35 13 35 0 0
MDE receipt date to IFSP meeting date 21 56 22 57 1 1
Source: KIDS data as of 07/02/08; First Health data as of 07/04/08; DocTrac data as of 08/20/08.
Change2006 (last 6 months) 2007 (last 6 months)
Stages Defined
ANALYSIS OF EARLY INTERVENTION 45-DAY COMPLIANCE DATA
CALENDAR YEAR 2006 AND CALENDAR YEAR 2007
CITYWIDE MEDIAN # OF DAYS FROM REFERRAL TO IFSP MEETING
In the last half of calendar year 2007, the median number of days that elapsed between the
initial referral date and the initial IFSP meeting date of new EI children was 57 days, up from 56
days in calendar year 2006.1
1
A significant portion of the new EI children for which the Brooklyn Regional Office (BRO) was responsible in CY
2006 were missing key event data and had to be dropped from the final, aggregated dataset used in the analysis of
CY 2006 data. As such, the distribution of observations by borough was skewed with the BRO data being under
represented. Therefore the CY 2006 citywide median # of days from referral to initial service coordination is
understated while the referral to MDE receipt findings is overstated in the CY2006 findings.
Chart 1: Median Days from Referral to IFSP Meeting, CY 2006 and CY 2007
4
4 14
15
22
22 35
35 57
561
2
Year
# of days
Referral to Initial service coordination Initial service coordination to First evaluation First evaluation to Last evaluation
Last evaluation to MDE receipt date MDE receipt date to IFSP meeting date
2006 (last
6 months)
----10---- ----8---- ----13---- ----22----
----11---- ----7---- ----13---- ----21----
45
2007 (last
6 months)
August 2008 Page 1 Office of Policy & Planning
# of Days
# of
Children
% of
children in
group
# of
Children
% of
children in
group
0 - 45 1,455 30.2% 1,704 29.6%
46 - 50 534 11.1% 587 10.2%
51 - 60 760 15.8% 777 13.5%
61 - 75 977 20.3% 1,027 17.9%
over 75 1,090 22.6% 1,656 28.8%
Total 4,816 100.0% 5,751 100.0%
2006 (last 6 months) 2007 (last 6 months)
Table 2. EI Children Grouped by Length of Referral
and IFSP Process, CY 2006 and CY 2007
Source: KIDS data as of 07/02/08; First Health data as of
07/04/08; DocTrac data as of 08/20/08.
Chart 2: EI Children by Length of Referral to IFSP Process, CY 2006 and CY 2007
1,455 1,704
534 587
760
777
977
1,027
1,090
1,656
0%
10%
20%
30%
40%
50%
60%
70%
80%
90%
100%
2006 (last 6 months) 2007 (last 6 months)
%ofchildreningroup
0 - 45 46 - 50 51 - 60 61 - 75 over 75
CITYWIDE DISTRIBUTION OF NEW CHILDREN BY LENGTH OF REFERRAL TO IFSP PROCESS
The percentage of children receiving their initial IFSP meeting within 45 days or less decreased
slightly (about half of a percentage point). However, the percentage of children who received
their initial IFSP meeting over 75 days from initial referral increased by just over 6 percentage
points, which was the largest increase observed in any of the groups. In order to reach the goal
of holding 80% of initial IFSP meetings within 45 days, children whose cases are now going to
IFSP between 46 and 75 days, as well as just under a third of the children whose cases go
beyond 75 days will have to be brought in on time.
August 2008 Page 2 Office of Policy & Planning
MEDIAN # OF DAYS FROM REFERRAL TO IFSP MEETING BY BOROUGH
Overview of Entire Process
Borough level progress towards greater 45 day compliance was mixed in 2007. While the Staten
Island Regional Office’s compliance numbers showed remarkable improvement in CY 2007, by
decreasing the median number of days it took their children to complete the initial IFSP process
to 43 days (down from 50 days in CY 2006), the Queens and the Bronx Regional Office data
shows an increase of 4 total median days each during this same period. This brought their
number of total median days to IFSP to 55 days and 63 days respectively. And while the
Manhattan and Brooklyn Regional Office data shows the median number of days it took their
children to reach IFSP decreased by 1 day, their median total number of days to IFSP were 62
and 55 days respectively, which is still well beyond the 45 day mandate.
MDE receipt to initial IFSP meeting (Regional Offices’ Responsibility)
In 2007 there was a slight overall improvement in the median number of days it took each of
the regional offices to hold an initial IFSP meeting after MDE receipt. In 2006 all 5 regional
offices took more than a median of 15 day after MDE receipt to hold initial IFSP meetings. The
Bronx had the lowest median with 17 days and Manhattan had the highest with 26 days. In
2007 one regional office had a median number of days to IFSP post-MDE receipt that was 15
days or less. The 2007 low and high values of this range also decreased. Staten Island had the
lowest median of 13 days while Brooklyn had the highest median of 24 days.
Referral to MDE receipt (Provider Agencies’ Responsibility)
In 2007, provider agency performance with respect to the median number of days it took from
referral to MDE receipt declined. In 2006 only the Brooklyn Regional Office had a median
number of days to MDE receipt that was 30 days or less. It should be noted that the Queens
and Staten Island Regional Offices had median number of days to MDE receipt that were pretty
close to the 30 day mark (their numbers were 32 and 31 days respectively). The Bronx Regional
Office had the largest median of 42 days to MDE receipt. In 2007 the Staten Island Regional
Office experienced a decrease of 1 day in the median number of days to MDE receipt and was
the only office with a median of 30 days or less. The Bronx Regional Office’s median remained
42 days while all other regional offices experienced an increase in the median number of days
from referral to MDE receipt. The Manhattan and Queens Regional Offices each experienced an
increase of 3 days while the Brooklyn Regional Office experienced an increase of 1 day.
Significant Findings by Borough
Manhattan: By 2007 the median number of total days it took new children to go to IFSP was 62
which dropped by 1 day from where it had been in 2006. The total number of 63 days to IFSP in
2006 was the largest among the 5 regional offices in that year. It is important to note however,
that there was a 4 day decline in the number of days within Stage 5 (MDE receipt to IFSP
meeting) in 2007. Only Staten Island was able to decrease the number of days in this stage by a
August 2008 Page 3 Office of Policy & Planning
larger number in 2007. Increases of 1 and 2 days in Stages 2 and 3 (initial service coordination
to first evaluation and first evaluation to last evaluation) all but eliminated the progress the
MRO made on bringing cases to IFSP quicker after the MDE was received.
Bronx: The median number of total days it took new children to go to IFSP was 63 days in 2007
(up from 59 days in 2006). This was the largest median total number of days among the 5
regional offices. Furthermore the Bronx Regional Office tied with the Queens Regional Office
for single largest increase in the median number of days from referral to IFSP in 2007. Provider
performance overall was the same in 2007 as it had been in 2006. Providers continued to take a
median of 42 days after referral to send the MDEs to the Bronx Regional Office, which is the
worst performance in the city. While the number of days it took to complete Stages 1 and 4
decreased by 1 and 2 days, the median number of days that elapsed during Stage 3 increased
by 3 days. Also the number of days the regional office took to hold the initial IFSP meeting post
MDE-receipt grew by 4 days.
Brooklyn: By 2007 the median number of total days it took new children to go to IFSP was 55,
which dropped by 1 day from where it had been in 2006. Provider performance was only
slightly worse in 2007 than what it had been in 2006. The median number of days which
elapsed in Stages 1 and 3 decreased by one day, but the number of days that elapsed during
Stage 4 increased by 3 days, wiping out the progress made in the earlier stages. Regional office
performance improved slightly as there was a 2 day decline in the median number of days it
took for the initial IFSP to be held post-MDE receipt, but the total number of days in Stage 5
was still 24 days, 9 days above the target of 15 days for this stage.
Queens: The median number of total days it took new children to go to IFSP was 55 days in
2007 (up from 51 days in 2006). This 4 day increase tied with the Bronx Regional Office for
largest increase in the median number of days from referral to IFSP in 2007. Provider
performance was worse in 2007. Providers took a median of 35 days after referral to send the
MDEs to the Queens Regional Office, an increase of 3 days from what it had been in 2006.
While the number of days it took to complete Stages 1 decreased by 1 day, the median number
of days that elapsed during Stages 2 - 4 increased by 4 days total. The median number of days
the regional office took to hold the initial IFSP meeting post MDE-receipt grew by 1 day.
Staten Island: In 2007 the median number of total days from referral to IFSP dropped to 43
days. Provider agency performance improved slightly in 2007 with the median number of days
that elapsed in Stage 2 decreasing by 1 day. The biggest improvement occurred in Stage 5. The
Staten Island Regional Office decreased the median number of days it took to hold initial IFSP
meetings post-MDE receipt by 6 days. This is the most dramatic improvement in regional office
performance in the entire city.
August 2008 Page 4 Office of Policy & Planning
Chart 3a. Manhattan Regional Office Median Days from Referral to IFSP Meeting,
CY 2006 and CY 2007
-4-
-4-
-13-
-12- -6-
-8- -15-
-15-
-22-
-26-
2006 (last 6 months)
2007 (last 6 months)
Year
# of days
1 Referral to Initial service coordination 2 Initial service coordination to First evaluation 3 First evaluation to Last evaluation
4 Last evaluation to MDE receipt date 5 MDE receipt date to IFSP meeting date
4 17 25 40 62
4 16 22 37 63
Chart 3c. Brooklyn Regional Office Median Days from Referral to IFSP Meeting,
CY 2006 and CY 2007
-5-
-6-
-9-
-9- -7-
-6- -11-
-8-
-24-
-26-
2006 (last 6 months)
2007 (last 6 months)
Year
# of days
1 Referral to Initial service coordination 2 Initial service coordination to First evaluation 3 First evaluation to Last evaluation
4 Last evaluation to MDE receipt date 5 MDE receipt date to IFSP meeting date
5 14 20 31 55
6 15 22 30 56
Chart 3e. Staten Island Regional Office Median Days from Referral to IFSP Meeting,
CY 2006 and CY 2007
-2-
-2-
-10-
-11- -6-
-6- -12-
-12-
-13-
-19-
2006 (last 6 months)
2007 (last 6 months)
Year
# of days
1 Referral to Initial service coordination 2 Initial service coordination to First evaluation 3 First evaluation to Last evaluation
4 Last evaluation to MDE receipt date 5 MDE receipt date to IFSP meeting date
2 12 18 30 43
2 13 19 31 50
Manhattan
Number of
Days
Cumulative
Days
Number of
Days
Cumulative
Days # in stage
#
cumulative
1 Referral to Initial service coordination 4 4 4 4 0 0
2 Initial service coordination to First evaluation 12 16 13 17 1 1
3 First evaluation to Last evaluation 6 22 8 25 2 3
4 Last evaluation to MDE receipt date 15 37 15 40 0 3
5 MDE receipt date to IFSP meeting date 26 63 22 62 -4 -1
Bronx
Number of
Days
Cumulative
Days
Number of
Days
Cumulative
Days # in stage
#
cumulative
1 Referral to Initial service coordination 5 5 4 4 -1 -1
2 Initial service coordination to First evaluation 12 17 12 16 0 -1
3 First evaluation to Last evaluation 7 24 10 26 3 2
4 Last evaluation to MDE receipt date 18 42 16 42 -2 0
5 MDE receipt date to IFSP meeting date 17 59 21 63 4 4
Brooklyn
Number of
Days
Cumulative
Days
Number of
Days
Cumulative
Days # in stage
#
cumulative
1 Referral to Initial service coordination 6 6 5 5 -1 -1
2 Initial service coordination to First evaluation 9 15 9 14 0 -1
3 First evaluation to Last evaluation 7 22 6 20 -1 -2
4 Last evaluation to MDE receipt date 8 30 11 31 3 1
5 MDE receipt date to IFSP meeting date 26 56 24 55 -2 -1
Queens
Number of
Days
Cumulative
Days
Number of
Days
Cumulative
Days # in stage
#
cumulative
1 Referral to Initial service coordination 4 4 3 3 -1 -1
2 Initial service coordination to First evaluation 9 13 10 13 1 0
3 First evaluation to Last evaluation 7 20 8 21 1 1
4 Last evaluation to MDE receipt date 12 32 14 35 2 3
5 MDE receipt date to IFSP meeting date 19 51 20 55 1 4
Staten Island
Number of
Days
Cumulative
Days
Number of
Days
Cumulative
Days # in stage
#
cumulative
1 Referral to Initial service coordination 2 2 2 2 0 0
2 Initial service coordination to First evaluation 11 13 10 12 -1 -1
3 First evaluation to Last evaluation 6 19 6 18 0 -1
4 Last evaluation to MDE receipt date 12 31 12 30 0 -1
5 MDE receipt date to IFSP meeting date 19 50 13 43 -6 -7
Source: KIDS data as of 07/02/08; First Health data as of 07/04/08; DocTrac data as of 08/20/08.
Stages defined
CY 2006 (last 6 months) CY 2007 (last 6 months)
CY 2007 (last 6 months)
Stages defined
CY 2006 (last 6 months) CY 2007 (last 6 months) Change
Change
CY 2006 (last 6 months) CY 2007 (last 6 months) Change
Stage
#
Table 3. Median Days from Referral to IFSP Meeting By Borough, CY 2006 and CY 2007
Change
CY 2006 (last 6 months) CY 2007 (last 6 months) Change
Stages defined
Stages defined
Stages defined
CY 2006 (last 6 months)
Stage
#
Stage
#
Stage
#
Stage
#
August 2008 Page 8 Office of Policy & Planning
DISTRIBUTION OF NEW CHILDREN BY LENGTH OF REFERRAL TO IFSP PROCESS BY BOROUGH
Overview of Distribution Changes
Performance with respect to child groupings by IFSP process length was very mixed across the
regional offices. While overall performance of the Staten Island Regional Office improved
dramatically and the Brooklyn Regional Office improved slightly, the Manhattan Regional
Office’s performance was mixed, and both the Bronx and Queens Regional Offices’
performances were worse in 2007.
Manhattan: Some progress was made in 2007, but overall performance remained problematic.
There was a 1 percentage point increase in both the percentage of children with initial IFSPs
that were on-time, as well as those whose IFSP meetings were near misses (held within 46 – 50
days of referral). However, in 2007 just over 30% of all new children had an initial IFSP that was
either on-time or a near miss, which is the worst in the city. Also the percentage of new
children for which the Manhattan Regional Office was responsible who went to IFSP over 75
days after referral, grew to a full one-third of children who has an initial IFSP in 2007.
Bronx: Slight declines in the percentage of new children with initial IFSP meetings that were
either on-time or that were near misses were detected in 2007. This brought the total
percentage of children in the on-time and near miss category to just over 35% (down from over
38% in 2006). There was a sizeable increase (7.4 percentage points) in the percentage of new
children whose IFSP was held over 75 days after referral. Just over 35% of all new children had
their initial IFSP over 75 days after referral, which was the worst rate in the city in 2007.
Brooklyn: Some progress was made in 2007. Just over one-third of all new children had initial
IFSP meetings that were held within 45 days from referral (up 7 percentage points from the
2006 rate). Just over 45% of all children for which the Brooklyn Regional Office was responsible
had their initial IFSP meeting held within 50 days of referral. The percentage of new children
with IFSP meetings held over 75 days from referral was 27% in 2007, a slight increase from
2006, but the second best rate in the city.
Queens: The percentage of children with initial IFSPs held on-time decreased to approximately
22% in 2007, down 13 percentage points from the 2006 rate of 35%. The percentage of new
children who received their initial IFSP meeting within 50 days of referral declined to 33% in
2007. Also in 2007, the percentage of new children with initial IFSP meetings that were held
over 75 days after referral increased by just under 15 percentage points in 2007, bringing the
total percentage up to 30%.
Staten Island: Sizeable progress was made in improving the distribution of new children with
IFSPs held on-time in 2007. The percentage of new children with on-time IFSPs grew
approximately 19 percentage points to bring the total rate up to 62%, which was the best rate
in the city in 2007. The percentage of new children who had an initial IFSP in all of the late
categories decreased, with the largest progress made in the 61-75 and over 75 day categories.
August 2008 Page 9 Office of Policy & Planning
In 2007, only 9% of all new children had an initial IFSP meeting held over 75 days after their
date of referral.
Chart 4a: Manhattan Regional Office Children by Length of Referral to IFSP Process,
CY 2006 and CY 2007
150 164
75
86
138
141
199 159
241
275
0%
10%
20%
30%
40%
50%
60%
70%
80%
90%
100%
2006 (last 6 months) 2007 (last 6 months)
%ofchildreningroup
0 - 45 46 - 50 51 - 60 61 - 75 over 75
August 2008 Page 10 Office of Policy & Planning
Chart 4b: Bronx Regional Office Children by Length of Referral to IFSP Process,
CY 2006 and CY 2007
409 294
99
55
185
111
268
175
371
346
0%
10%
20%
30%
40%
50%
60%
70%
80%
90%
100%
2006 (last 6 months) 2007 (last 6 months)
%ofchildreningroup
0 - 45 46 - 50 51 - 60 61 - 75 over 75
Chart 4c: Brooklyn Regional Office Children by Length of Referral to IFSP Process,
CY 2006 and CY 2007
222
761
109
276
150
268
149 361
209 610
0%
10%
20%
30%
40%
50%
60%
70%
80%
90%
100%
2006 (last 6 months) 2007 (last 6 months)
%ofchildreningroup
0 - 45 46 - 50 51 - 60 61 - 75 over 75
August 2008 Page 11 Office of Policy & Planning
Chart 4d: Queens Regional Office Children by Length of Referral to IFSP Process,
CY 2006 and CY 2007
521
293
215
149
236
219
303
301
215
397
0%
10%
20%
30%
40%
50%
60%
70%
80%
90%
100%
2006 (last 6 months) 2007 (last 6 months)
%ofchildreningroup
0 - 45 46 - 50 51 - 60 61 - 75 over 75
August 2008 Page 12 Office of Policy & Planning
Chart 4e: Staten Island Regional Office Children by Length of Referral to IFSP Process,
CY 2006 and CY 2007
153
192
36
21
51
38
58
31
54
28
0%
10%
20%
30%
40%
50%
60%
70%
80%
90%
100%
2006 (last 6 months) 2007 (last 6 months)
%ofchildreningroup
0 - 45 46 - 50 51 - 60 61 - 75 over 75
August 2008 Page 13 Office of Policy & Planning
# of Days # % # % ppt. change
0 - 45 150 18.7% 164 19.9% 1.2
46 - 50 75 9.3% 86 10.4% 1.1
51 - 60 138 17.2% 141 17.1% -0.1
61 - 75 199 24.8% 159 19.3% -5.5
over 75 241 30.0% 275 33.3% 3.3
Total 803 100.0% 825 100.0%
# of Days # % # % ppt. change
0 - 45 409 30.7% 294 30.0% -0.7
46 - 50 99 7.4% 55 5.6% -1.8
51 - 60 185 13.9% 111 11.3% -2.6
61 - 75 268 20.1% 175 17.8% -2.3
over 75 371 27.9% 346 35.3% 7.4
Total 1,332 100.0% 981 100.0%
# of Days # % # % ppt. change
0 - 45 222 26.5% 761 33.4% 7.0
46 - 50 109 13.0% 276 12.1% -0.9
51 - 60 150 17.9% 268 11.8% -6.1
61 - 75 149 17.8% 361 15.9% -1.9
over 75 209 24.9% 610 26.8% 1.9
Total 839 100.0% 2,276 100.0%
# of Days # % # % ppt. change
0 - 45 521 35.0% 293 21.6% -13.4
46 - 50 215 14.4% 149 11.0% -3.5
51 - 60 236 15.8% 219 16.1% 0.3
61 - 75 303 20.3% 301 22.1% 1.8
over 75 215 14.4% 397 29.2% 14.8
Total 1,490 100.0% 1,359 100.0%
# of Days # % # % ppt. change
0 - 45 153 43.5% 192 61.9% 18.5
46 - 50 36 10.2% 21 6.8% -3.5
51 - 60 51 14.5% 38 12.3% -2.2
61 - 75 58 16.5% 31 10.0% -6.5
over 75 54 15.3% 28 9.0% -6.3
Total 352 100.0% 310 100.0%
Queens
Staten Island
Table 4. EI Children by Length of Referral and IFSP Process by
Borough, CY 2006 and CY 2007
2006 (last 6 months) 2007 (last 6 months)
Manhattan
Bronx
Brooklyn
Source: KIDS data as of 07/02/08; First Health data as of 07/04/08; DocTrac data
as of 08/20/08.
2006 (last 6 months) 2007 (last 6 months)
August 2008 Page 14 Office of Policy & Planning
APPENDIX: DATA ANALYSIS DESCRIPTION
Data Manipulation Process
EI claims paid from January 1, 2003 to June 20, 2008 for service coordination and evaluations, a
DocTrac extract of all MDE receipt dates through August 20, 2008, and KIDS data for children
whose initial IFSP meeting were held within the study period were merged. The dates of initial
service coordination, first evaluation, and last evaluation of each child included in this analysis
were captured by creating a new dataset which contained only the earliest service coordination
date, earliest evaluation date, and most recent evaluation date which were delivered after the
date of the child’s latest referral. In addition, the State-assigned EI identification number, date
of initial referral, date of initial IFSP meeting, latest referral date, borough office responsible for
child, and borough of child’s residence were all preserved in the dataset.
The number of days which elapsed between the 6 key events (latest referral, initial service
coordination, initial evaluation, last evaluation, MDE receipt date, and initial IFSP meeting) was
calculated for each child in the dataset. The total number of days between the start (date of
latest referral) and end of the process (date of initial IFSP meeting) were calculated for each
child in the dataset. Observations (children) were then grouped by the number of days that
elapsed between their latest referral date and their initial IFSP meeting date. The categories are
as follows, group 1: 45 days or less, group 2: over 45 days, but not more than 50, group 3: over
50 days, but not more than 60, groups 4: over 60 days, but not more than 75, and group 5: over
75 days. The data is presented on both a citywide and borough basis.
Included and Excluded Observations
CY 2006 dataset:
The original dataset contained 6,912 observations (unique children). 6,842 of the children
included in the dataset had initial service coordination dates. 5,085 had MDE receipt dates, and
6,613 were found to have at least one evaluation date. 4,816 children were found to have dates
for all key events. 915 children (13% of the original dataset) had a case which was closed and
reopened before they reached their initial service plan meeting.
Observations missing any of the 6 key events and observations with implausible start dates
(latest referral dates that were more recent than their initial service plan meeting date) were
dropped from the dataset. This left 4,816 observations in the dataset (70% of the original
dataset), which was large enough of a sample for the purposes of this analysis.
CY 2007 dataset:
The original dataset contained 7,017 observations (unique children). 6,959 of the children
included in the dataset had initial service coordination dates, 5,975 had MDE receipt dates, and
6,782 were found to have at least one evaluation date. 5,751 children were found to have dates
for all key events. 979 children (14% of the original dataset) had a case which was closed and
reopened before they reached their initial service plan meeting.
October 2007 Page 1 Office of Policy & Planning
Observations missing any of the 6 key events and observations with implausible start dates
(latest referral dates that were more recent than their initial service plan meeting date) were
dropped from the dataset. This left 5,751 observations in the dataset (82% of the original
dataset), which is a large enough sample for the purposes of this analysis.
August 2008 Page 2 Office of Policy & Planning

Mais conteúdo relacionado

Destaque

Ieee 2016 Information Forensics Papers Namakkal
Ieee 2016 Information Forensics Papers NamakkalIeee 2016 Information Forensics Papers Namakkal
Ieee 2016 Information Forensics Papers Namakkalkrish madhi
 
Cuidadoscomomeioambienteemnossodiaadia
CuidadoscomomeioambienteemnossodiaadiaCuidadoscomomeioambienteemnossodiaadia
CuidadoscomomeioambienteemnossodiaadiaValdirene Sales
 
Ieee Projects For Ece Eee Thanjavur
Ieee Projects For Ece Eee ThanjavurIeee Projects For Ece Eee Thanjavur
Ieee Projects For Ece Eee Thanjavurkrish madhi
 
final year application projects for cse namakkal
final year application projects for cse namakkalfinal year application projects for cse namakkal
final year application projects for cse namakkalkrish madhi
 
chỗ nào làm video quảng cáo độc đáo
chỗ nào làm video quảng cáo độc đáochỗ nào làm video quảng cáo độc đáo
chỗ nào làm video quảng cáo độc đáojim658
 
Sewage treatment-system
Sewage treatment-systemSewage treatment-system
Sewage treatment-systemApril Yoona
 

Destaque (9)

Ieee 2016 Information Forensics Papers Namakkal
Ieee 2016 Information Forensics Papers NamakkalIeee 2016 Information Forensics Papers Namakkal
Ieee 2016 Information Forensics Papers Namakkal
 
Trobada ascuma 2013
Trobada ascuma 2013Trobada ascuma 2013
Trobada ascuma 2013
 
Cuidadoscomomeioambienteemnossodiaadia
CuidadoscomomeioambienteemnossodiaadiaCuidadoscomomeioambienteemnossodiaadia
Cuidadoscomomeioambienteemnossodiaadia
 
Ieee Projects For Ece Eee Thanjavur
Ieee Projects For Ece Eee ThanjavurIeee Projects For Ece Eee Thanjavur
Ieee Projects For Ece Eee Thanjavur
 
final year application projects for cse namakkal
final year application projects for cse namakkalfinal year application projects for cse namakkal
final year application projects for cse namakkal
 
Descripción
DescripciónDescripción
Descripción
 
Team Building
Team BuildingTeam Building
Team Building
 
chỗ nào làm video quảng cáo độc đáo
chỗ nào làm video quảng cáo độc đáochỗ nào làm video quảng cáo độc đáo
chỗ nào làm video quảng cáo độc đáo
 
Sewage treatment-system
Sewage treatment-systemSewage treatment-system
Sewage treatment-system
 

Semelhante a Findings.45day.2008.08.28 - final

Apresentação diana sawyer nec rio
Apresentação diana sawyer nec rioApresentação diana sawyer nec rio
Apresentação diana sawyer nec rioUNDP Policy Centre
 
ECN 410 Final Project Paper, James Wiltbank, Nathan Waters
ECN 410 Final Project Paper, James Wiltbank, Nathan  WatersECN 410 Final Project Paper, James Wiltbank, Nathan  Waters
ECN 410 Final Project Paper, James Wiltbank, Nathan WatersNathan Waters
 
Running head LOGIC MODELLOGIC MODEL 2Logic modelStu.docx
Running head LOGIC MODELLOGIC MODEL 2Logic modelStu.docxRunning head LOGIC MODELLOGIC MODEL 2Logic modelStu.docx
Running head LOGIC MODELLOGIC MODEL 2Logic modelStu.docxwlynn1
 
Scott Duce - 2016
Scott Duce - 2016Scott Duce - 2016
Scott Duce - 2016Scott Duce
 
OPPE Annual Report 2014
OPPE Annual Report 2014OPPE Annual Report 2014
OPPE Annual Report 2014Sal Lucido
 
Article one Lethal injection -electronic resource- -.docx
Article one         Lethal injection -electronic resource- -.docxArticle one         Lethal injection -electronic resource- -.docx
Article one Lethal injection -electronic resource- -.docxnoel23456789
 
New York State Policy on Child Welfare and Two-Generation Approaches
New York State Policy on Child Welfare and Two-Generation ApproachesNew York State Policy on Child Welfare and Two-Generation Approaches
New York State Policy on Child Welfare and Two-Generation ApproachesFrancesca Vescia (she/her)
 
Female Community Health Volunteers in Nepal: What We Know and Steps Going For...
Female Community Health Volunteers in Nepal: What We Know and Steps Going For...Female Community Health Volunteers in Nepal: What We Know and Steps Going For...
Female Community Health Volunteers in Nepal: What We Know and Steps Going For...JSI
 
The potential of the case study method to understand the heterogeneity of eff...
The potential of the case study method to understand the heterogeneity of eff...The potential of the case study method to understand the heterogeneity of eff...
The potential of the case study method to understand the heterogeneity of eff...valéry ridde
 
Evidence based monitoring of local government2
Evidence based monitoring of local government2Evidence based monitoring of local government2
Evidence based monitoring of local government2Agus Dwiyanto
 
2014 August GrayReports - Student Demand Trends
2014 August GrayReports - Student Demand Trends2014 August GrayReports - Student Demand Trends
2014 August GrayReports - Student Demand TrendsGray Associates, Inc
 
Research-Driven Solutions for Innovative State Policy
Research-Driven Solutions for Innovative State PolicyResearch-Driven Solutions for Innovative State Policy
Research-Driven Solutions for Innovative State PolicyAcademyHealth
 
An Interrupted Time Series Multivariate Regression Analysis Evaluation of Sta...
An Interrupted Time Series Multivariate Regression Analysis Evaluation of Sta...An Interrupted Time Series Multivariate Regression Analysis Evaluation of Sta...
An Interrupted Time Series Multivariate Regression Analysis Evaluation of Sta...Whitney Bowman-Zatzkin
 
DR Grantee Project Match
DR Grantee Project MatchDR Grantee Project Match
DR Grantee Project MatchAdoptUSKids
 
TECS Child Outcomes Data Webinar
TECS Child Outcomes Data WebinarTECS Child Outcomes Data Webinar
TECS Child Outcomes Data WebinarLesly Wilson
 
ISM Conference 2008 Presentation
ISM Conference 2008 PresentationISM Conference 2008 Presentation
ISM Conference 2008 Presentationhigdonla
 

Semelhante a Findings.45day.2008.08.28 - final (20)

Caps report 06 24_10
Caps report 06 24_10Caps report 06 24_10
Caps report 06 24_10
 
Research Sample
Research SampleResearch Sample
Research Sample
 
Apresentação diana sawyer nec rio
Apresentação diana sawyer nec rioApresentação diana sawyer nec rio
Apresentação diana sawyer nec rio
 
ECN 410 Final Project Paper, James Wiltbank, Nathan Waters
ECN 410 Final Project Paper, James Wiltbank, Nathan  WatersECN 410 Final Project Paper, James Wiltbank, Nathan  Waters
ECN 410 Final Project Paper, James Wiltbank, Nathan Waters
 
Running head LOGIC MODELLOGIC MODEL 2Logic modelStu.docx
Running head LOGIC MODELLOGIC MODEL 2Logic modelStu.docxRunning head LOGIC MODELLOGIC MODEL 2Logic modelStu.docx
Running head LOGIC MODELLOGIC MODEL 2Logic modelStu.docx
 
Final Project
Final ProjectFinal Project
Final Project
 
Scott Duce - 2016
Scott Duce - 2016Scott Duce - 2016
Scott Duce - 2016
 
OPPE Annual Report 2014
OPPE Annual Report 2014OPPE Annual Report 2014
OPPE Annual Report 2014
 
Article one Lethal injection -electronic resource- -.docx
Article one         Lethal injection -electronic resource- -.docxArticle one         Lethal injection -electronic resource- -.docx
Article one Lethal injection -electronic resource- -.docx
 
New York State Policy on Child Welfare and Two-Generation Approaches
New York State Policy on Child Welfare and Two-Generation ApproachesNew York State Policy on Child Welfare and Two-Generation Approaches
New York State Policy on Child Welfare and Two-Generation Approaches
 
Female Community Health Volunteers in Nepal: What We Know and Steps Going For...
Female Community Health Volunteers in Nepal: What We Know and Steps Going For...Female Community Health Volunteers in Nepal: What We Know and Steps Going For...
Female Community Health Volunteers in Nepal: What We Know and Steps Going For...
 
The potential of the case study method to understand the heterogeneity of eff...
The potential of the case study method to understand the heterogeneity of eff...The potential of the case study method to understand the heterogeneity of eff...
The potential of the case study method to understand the heterogeneity of eff...
 
Evidence based monitoring of local government2
Evidence based monitoring of local government2Evidence based monitoring of local government2
Evidence based monitoring of local government2
 
2014 August GrayReports - Student Demand Trends
2014 August GrayReports - Student Demand Trends2014 August GrayReports - Student Demand Trends
2014 August GrayReports - Student Demand Trends
 
281Healthcare P
281Healthcare P281Healthcare P
281Healthcare P
 
Research-Driven Solutions for Innovative State Policy
Research-Driven Solutions for Innovative State PolicyResearch-Driven Solutions for Innovative State Policy
Research-Driven Solutions for Innovative State Policy
 
An Interrupted Time Series Multivariate Regression Analysis Evaluation of Sta...
An Interrupted Time Series Multivariate Regression Analysis Evaluation of Sta...An Interrupted Time Series Multivariate Regression Analysis Evaluation of Sta...
An Interrupted Time Series Multivariate Regression Analysis Evaluation of Sta...
 
DR Grantee Project Match
DR Grantee Project MatchDR Grantee Project Match
DR Grantee Project Match
 
TECS Child Outcomes Data Webinar
TECS Child Outcomes Data WebinarTECS Child Outcomes Data Webinar
TECS Child Outcomes Data Webinar
 
ISM Conference 2008 Presentation
ISM Conference 2008 PresentationISM Conference 2008 Presentation
ISM Conference 2008 Presentation
 

Findings.45day.2008.08.28 - final

  • 1. ANALYSIS OF EARLY INTERVENTION 45-DAY COMPLIANCE DATA CALENDAR YEAR 2006 AND CALENDAR YEAR 2007 SUMMARY OBJECTIVE This analysis was created to examine how long it took, on average, for children who had an initial IFSP meeting to move through the 5 distinct stages between referral and the initial service plan meeting in calendar year 2006 versus how long it took in calendar year 2007. This was achieved by comparing data from the last 6 months of CY 2006 to the last 6 months of CY 2007. HIGHLIGHTS (Full report attached) • In both 2006 and 2007, more than half of new EI children had an initial service plan meeting which was held well beyond the 45 day from referral date requirement. When measured by median days, citywide performance in 2007 appears to be only marginally worse than what it had been in 2006. • The distribution of new EI children grouped by the length of their referral to initial IFSP timing reveals that citywide performance was significantly worse in 2007 than it had been in 2006. While the percentage of children who went to initial IFSP on time remained approximately 30%, the percentage of children with initial IFSP meetings in the very late category grew from just over 20% in 2006 to almost 30% in 2007. • Each regional office had very different median day numbers to IFSP, which moved in very different directions in 2007. The Staten Island Regional Office’s performance improved dramatically, the Manhattan and Brooklyn Regional Offices each had a small improvement, and the Queens and Bronx Regional Offices both had showed a significant decline in their 2007 performance. • Regional Office performance with respect to the distribution of child groups by IFSP process length was also very mixed across the city. While overall performance of the Staten Island Regional Office improved dramatically and the Brooklyn Regional Office improved slightly, the Manhattan Regional Office’s performance was mixed, and both the Bronx and Queens Regional Offices’ performances were worse in 2007. APPROACH AND DATA SOURCES The data used in this analysis was extracted from the following Early Intervention KIDS datasets: Child, IFSP, Referral (Ecref), House, and Family. These database extracts contained observations through July 2, 2008. First Health Early Intervention paid claims data with observations through July 4, 2008 and data extracted from EI DocTrac containing observations through August 20, 2008 were also used in this analysis. See the appendix of this report for a detailed description of the approach used in the data manipulation piece of this analysis. REPORT AUTHOR Josiane Georges, Analyst August 2008 Office of Policy & Planning
  • 2. Table 1. Median Days from Referral to IFSP Meeting, CY 2006 and CY 2007 In Stage Cumulative In Stage Cumulative # In Stage # Cumulative Referral to Initial service coordination 4 4 4 4 0 0 Initial service coordination to First evaluation 11 15 10 14 -1 -1 First evaluation to Last evaluation 7 22 8 22 1 0 Last evaluation to MDE receipt date 13 35 13 35 0 0 MDE receipt date to IFSP meeting date 21 56 22 57 1 1 Source: KIDS data as of 07/02/08; First Health data as of 07/04/08; DocTrac data as of 08/20/08. Change2006 (last 6 months) 2007 (last 6 months) Stages Defined ANALYSIS OF EARLY INTERVENTION 45-DAY COMPLIANCE DATA CALENDAR YEAR 2006 AND CALENDAR YEAR 2007 CITYWIDE MEDIAN # OF DAYS FROM REFERRAL TO IFSP MEETING In the last half of calendar year 2007, the median number of days that elapsed between the initial referral date and the initial IFSP meeting date of new EI children was 57 days, up from 56 days in calendar year 2006.1 1 A significant portion of the new EI children for which the Brooklyn Regional Office (BRO) was responsible in CY 2006 were missing key event data and had to be dropped from the final, aggregated dataset used in the analysis of CY 2006 data. As such, the distribution of observations by borough was skewed with the BRO data being under represented. Therefore the CY 2006 citywide median # of days from referral to initial service coordination is understated while the referral to MDE receipt findings is overstated in the CY2006 findings. Chart 1: Median Days from Referral to IFSP Meeting, CY 2006 and CY 2007 4 4 14 15 22 22 35 35 57 561 2 Year # of days Referral to Initial service coordination Initial service coordination to First evaluation First evaluation to Last evaluation Last evaluation to MDE receipt date MDE receipt date to IFSP meeting date 2006 (last 6 months) ----10---- ----8---- ----13---- ----22---- ----11---- ----7---- ----13---- ----21---- 45 2007 (last 6 months) August 2008 Page 1 Office of Policy & Planning
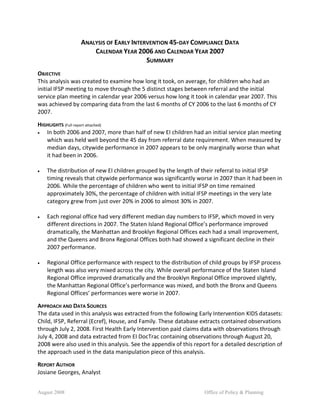
  • 3. # of Days # of Children % of children in group # of Children % of children in group 0 - 45 1,455 30.2% 1,704 29.6% 46 - 50 534 11.1% 587 10.2% 51 - 60 760 15.8% 777 13.5% 61 - 75 977 20.3% 1,027 17.9% over 75 1,090 22.6% 1,656 28.8% Total 4,816 100.0% 5,751 100.0% 2006 (last 6 months) 2007 (last 6 months) Table 2. EI Children Grouped by Length of Referral and IFSP Process, CY 2006 and CY 2007 Source: KIDS data as of 07/02/08; First Health data as of 07/04/08; DocTrac data as of 08/20/08. Chart 2: EI Children by Length of Referral to IFSP Process, CY 2006 and CY 2007 1,455 1,704 534 587 760 777 977 1,027 1,090 1,656 0% 10% 20% 30% 40% 50% 60% 70% 80% 90% 100% 2006 (last 6 months) 2007 (last 6 months) %ofchildreningroup 0 - 45 46 - 50 51 - 60 61 - 75 over 75 CITYWIDE DISTRIBUTION OF NEW CHILDREN BY LENGTH OF REFERRAL TO IFSP PROCESS The percentage of children receiving their initial IFSP meeting within 45 days or less decreased slightly (about half of a percentage point). However, the percentage of children who received their initial IFSP meeting over 75 days from initial referral increased by just over 6 percentage points, which was the largest increase observed in any of the groups. In order to reach the goal of holding 80% of initial IFSP meetings within 45 days, children whose cases are now going to IFSP between 46 and 75 days, as well as just under a third of the children whose cases go beyond 75 days will have to be brought in on time. August 2008 Page 2 Office of Policy & Planning
  • 4. MEDIAN # OF DAYS FROM REFERRAL TO IFSP MEETING BY BOROUGH Overview of Entire Process Borough level progress towards greater 45 day compliance was mixed in 2007. While the Staten Island Regional Office’s compliance numbers showed remarkable improvement in CY 2007, by decreasing the median number of days it took their children to complete the initial IFSP process to 43 days (down from 50 days in CY 2006), the Queens and the Bronx Regional Office data shows an increase of 4 total median days each during this same period. This brought their number of total median days to IFSP to 55 days and 63 days respectively. And while the Manhattan and Brooklyn Regional Office data shows the median number of days it took their children to reach IFSP decreased by 1 day, their median total number of days to IFSP were 62 and 55 days respectively, which is still well beyond the 45 day mandate. MDE receipt to initial IFSP meeting (Regional Offices’ Responsibility) In 2007 there was a slight overall improvement in the median number of days it took each of the regional offices to hold an initial IFSP meeting after MDE receipt. In 2006 all 5 regional offices took more than a median of 15 day after MDE receipt to hold initial IFSP meetings. The Bronx had the lowest median with 17 days and Manhattan had the highest with 26 days. In 2007 one regional office had a median number of days to IFSP post-MDE receipt that was 15 days or less. The 2007 low and high values of this range also decreased. Staten Island had the lowest median of 13 days while Brooklyn had the highest median of 24 days. Referral to MDE receipt (Provider Agencies’ Responsibility) In 2007, provider agency performance with respect to the median number of days it took from referral to MDE receipt declined. In 2006 only the Brooklyn Regional Office had a median number of days to MDE receipt that was 30 days or less. It should be noted that the Queens and Staten Island Regional Offices had median number of days to MDE receipt that were pretty close to the 30 day mark (their numbers were 32 and 31 days respectively). The Bronx Regional Office had the largest median of 42 days to MDE receipt. In 2007 the Staten Island Regional Office experienced a decrease of 1 day in the median number of days to MDE receipt and was the only office with a median of 30 days or less. The Bronx Regional Office’s median remained 42 days while all other regional offices experienced an increase in the median number of days from referral to MDE receipt. The Manhattan and Queens Regional Offices each experienced an increase of 3 days while the Brooklyn Regional Office experienced an increase of 1 day. Significant Findings by Borough Manhattan: By 2007 the median number of total days it took new children to go to IFSP was 62 which dropped by 1 day from where it had been in 2006. The total number of 63 days to IFSP in 2006 was the largest among the 5 regional offices in that year. It is important to note however, that there was a 4 day decline in the number of days within Stage 5 (MDE receipt to IFSP meeting) in 2007. Only Staten Island was able to decrease the number of days in this stage by a August 2008 Page 3 Office of Policy & Planning
  • 5. larger number in 2007. Increases of 1 and 2 days in Stages 2 and 3 (initial service coordination to first evaluation and first evaluation to last evaluation) all but eliminated the progress the MRO made on bringing cases to IFSP quicker after the MDE was received. Bronx: The median number of total days it took new children to go to IFSP was 63 days in 2007 (up from 59 days in 2006). This was the largest median total number of days among the 5 regional offices. Furthermore the Bronx Regional Office tied with the Queens Regional Office for single largest increase in the median number of days from referral to IFSP in 2007. Provider performance overall was the same in 2007 as it had been in 2006. Providers continued to take a median of 42 days after referral to send the MDEs to the Bronx Regional Office, which is the worst performance in the city. While the number of days it took to complete Stages 1 and 4 decreased by 1 and 2 days, the median number of days that elapsed during Stage 3 increased by 3 days. Also the number of days the regional office took to hold the initial IFSP meeting post MDE-receipt grew by 4 days. Brooklyn: By 2007 the median number of total days it took new children to go to IFSP was 55, which dropped by 1 day from where it had been in 2006. Provider performance was only slightly worse in 2007 than what it had been in 2006. The median number of days which elapsed in Stages 1 and 3 decreased by one day, but the number of days that elapsed during Stage 4 increased by 3 days, wiping out the progress made in the earlier stages. Regional office performance improved slightly as there was a 2 day decline in the median number of days it took for the initial IFSP to be held post-MDE receipt, but the total number of days in Stage 5 was still 24 days, 9 days above the target of 15 days for this stage. Queens: The median number of total days it took new children to go to IFSP was 55 days in 2007 (up from 51 days in 2006). This 4 day increase tied with the Bronx Regional Office for largest increase in the median number of days from referral to IFSP in 2007. Provider performance was worse in 2007. Providers took a median of 35 days after referral to send the MDEs to the Queens Regional Office, an increase of 3 days from what it had been in 2006. While the number of days it took to complete Stages 1 decreased by 1 day, the median number of days that elapsed during Stages 2 - 4 increased by 4 days total. The median number of days the regional office took to hold the initial IFSP meeting post MDE-receipt grew by 1 day. Staten Island: In 2007 the median number of total days from referral to IFSP dropped to 43 days. Provider agency performance improved slightly in 2007 with the median number of days that elapsed in Stage 2 decreasing by 1 day. The biggest improvement occurred in Stage 5. The Staten Island Regional Office decreased the median number of days it took to hold initial IFSP meetings post-MDE receipt by 6 days. This is the most dramatic improvement in regional office performance in the entire city. August 2008 Page 4 Office of Policy & Planning
  • 6. Chart 3a. Manhattan Regional Office Median Days from Referral to IFSP Meeting, CY 2006 and CY 2007 -4- -4- -13- -12- -6- -8- -15- -15- -22- -26- 2006 (last 6 months) 2007 (last 6 months) Year # of days 1 Referral to Initial service coordination 2 Initial service coordination to First evaluation 3 First evaluation to Last evaluation 4 Last evaluation to MDE receipt date 5 MDE receipt date to IFSP meeting date 4 17 25 40 62 4 16 22 37 63
  • 7. Chart 3c. Brooklyn Regional Office Median Days from Referral to IFSP Meeting, CY 2006 and CY 2007 -5- -6- -9- -9- -7- -6- -11- -8- -24- -26- 2006 (last 6 months) 2007 (last 6 months) Year # of days 1 Referral to Initial service coordination 2 Initial service coordination to First evaluation 3 First evaluation to Last evaluation 4 Last evaluation to MDE receipt date 5 MDE receipt date to IFSP meeting date 5 14 20 31 55 6 15 22 30 56
  • 8. Chart 3e. Staten Island Regional Office Median Days from Referral to IFSP Meeting, CY 2006 and CY 2007 -2- -2- -10- -11- -6- -6- -12- -12- -13- -19- 2006 (last 6 months) 2007 (last 6 months) Year # of days 1 Referral to Initial service coordination 2 Initial service coordination to First evaluation 3 First evaluation to Last evaluation 4 Last evaluation to MDE receipt date 5 MDE receipt date to IFSP meeting date 2 12 18 30 43 2 13 19 31 50
  • 9. Manhattan Number of Days Cumulative Days Number of Days Cumulative Days # in stage # cumulative 1 Referral to Initial service coordination 4 4 4 4 0 0 2 Initial service coordination to First evaluation 12 16 13 17 1 1 3 First evaluation to Last evaluation 6 22 8 25 2 3 4 Last evaluation to MDE receipt date 15 37 15 40 0 3 5 MDE receipt date to IFSP meeting date 26 63 22 62 -4 -1 Bronx Number of Days Cumulative Days Number of Days Cumulative Days # in stage # cumulative 1 Referral to Initial service coordination 5 5 4 4 -1 -1 2 Initial service coordination to First evaluation 12 17 12 16 0 -1 3 First evaluation to Last evaluation 7 24 10 26 3 2 4 Last evaluation to MDE receipt date 18 42 16 42 -2 0 5 MDE receipt date to IFSP meeting date 17 59 21 63 4 4 Brooklyn Number of Days Cumulative Days Number of Days Cumulative Days # in stage # cumulative 1 Referral to Initial service coordination 6 6 5 5 -1 -1 2 Initial service coordination to First evaluation 9 15 9 14 0 -1 3 First evaluation to Last evaluation 7 22 6 20 -1 -2 4 Last evaluation to MDE receipt date 8 30 11 31 3 1 5 MDE receipt date to IFSP meeting date 26 56 24 55 -2 -1 Queens Number of Days Cumulative Days Number of Days Cumulative Days # in stage # cumulative 1 Referral to Initial service coordination 4 4 3 3 -1 -1 2 Initial service coordination to First evaluation 9 13 10 13 1 0 3 First evaluation to Last evaluation 7 20 8 21 1 1 4 Last evaluation to MDE receipt date 12 32 14 35 2 3 5 MDE receipt date to IFSP meeting date 19 51 20 55 1 4 Staten Island Number of Days Cumulative Days Number of Days Cumulative Days # in stage # cumulative 1 Referral to Initial service coordination 2 2 2 2 0 0 2 Initial service coordination to First evaluation 11 13 10 12 -1 -1 3 First evaluation to Last evaluation 6 19 6 18 0 -1 4 Last evaluation to MDE receipt date 12 31 12 30 0 -1 5 MDE receipt date to IFSP meeting date 19 50 13 43 -6 -7 Source: KIDS data as of 07/02/08; First Health data as of 07/04/08; DocTrac data as of 08/20/08. Stages defined CY 2006 (last 6 months) CY 2007 (last 6 months) CY 2007 (last 6 months) Stages defined CY 2006 (last 6 months) CY 2007 (last 6 months) Change Change CY 2006 (last 6 months) CY 2007 (last 6 months) Change Stage # Table 3. Median Days from Referral to IFSP Meeting By Borough, CY 2006 and CY 2007 Change CY 2006 (last 6 months) CY 2007 (last 6 months) Change Stages defined Stages defined Stages defined CY 2006 (last 6 months) Stage # Stage # Stage # Stage # August 2008 Page 8 Office of Policy & Planning
  • 10. DISTRIBUTION OF NEW CHILDREN BY LENGTH OF REFERRAL TO IFSP PROCESS BY BOROUGH Overview of Distribution Changes Performance with respect to child groupings by IFSP process length was very mixed across the regional offices. While overall performance of the Staten Island Regional Office improved dramatically and the Brooklyn Regional Office improved slightly, the Manhattan Regional Office’s performance was mixed, and both the Bronx and Queens Regional Offices’ performances were worse in 2007. Manhattan: Some progress was made in 2007, but overall performance remained problematic. There was a 1 percentage point increase in both the percentage of children with initial IFSPs that were on-time, as well as those whose IFSP meetings were near misses (held within 46 – 50 days of referral). However, in 2007 just over 30% of all new children had an initial IFSP that was either on-time or a near miss, which is the worst in the city. Also the percentage of new children for which the Manhattan Regional Office was responsible who went to IFSP over 75 days after referral, grew to a full one-third of children who has an initial IFSP in 2007. Bronx: Slight declines in the percentage of new children with initial IFSP meetings that were either on-time or that were near misses were detected in 2007. This brought the total percentage of children in the on-time and near miss category to just over 35% (down from over 38% in 2006). There was a sizeable increase (7.4 percentage points) in the percentage of new children whose IFSP was held over 75 days after referral. Just over 35% of all new children had their initial IFSP over 75 days after referral, which was the worst rate in the city in 2007. Brooklyn: Some progress was made in 2007. Just over one-third of all new children had initial IFSP meetings that were held within 45 days from referral (up 7 percentage points from the 2006 rate). Just over 45% of all children for which the Brooklyn Regional Office was responsible had their initial IFSP meeting held within 50 days of referral. The percentage of new children with IFSP meetings held over 75 days from referral was 27% in 2007, a slight increase from 2006, but the second best rate in the city. Queens: The percentage of children with initial IFSPs held on-time decreased to approximately 22% in 2007, down 13 percentage points from the 2006 rate of 35%. The percentage of new children who received their initial IFSP meeting within 50 days of referral declined to 33% in 2007. Also in 2007, the percentage of new children with initial IFSP meetings that were held over 75 days after referral increased by just under 15 percentage points in 2007, bringing the total percentage up to 30%. Staten Island: Sizeable progress was made in improving the distribution of new children with IFSPs held on-time in 2007. The percentage of new children with on-time IFSPs grew approximately 19 percentage points to bring the total rate up to 62%, which was the best rate in the city in 2007. The percentage of new children who had an initial IFSP in all of the late categories decreased, with the largest progress made in the 61-75 and over 75 day categories. August 2008 Page 9 Office of Policy & Planning
  • 11. In 2007, only 9% of all new children had an initial IFSP meeting held over 75 days after their date of referral. Chart 4a: Manhattan Regional Office Children by Length of Referral to IFSP Process, CY 2006 and CY 2007 150 164 75 86 138 141 199 159 241 275 0% 10% 20% 30% 40% 50% 60% 70% 80% 90% 100% 2006 (last 6 months) 2007 (last 6 months) %ofchildreningroup 0 - 45 46 - 50 51 - 60 61 - 75 over 75 August 2008 Page 10 Office of Policy & Planning
  • 12. Chart 4b: Bronx Regional Office Children by Length of Referral to IFSP Process, CY 2006 and CY 2007 409 294 99 55 185 111 268 175 371 346 0% 10% 20% 30% 40% 50% 60% 70% 80% 90% 100% 2006 (last 6 months) 2007 (last 6 months) %ofchildreningroup 0 - 45 46 - 50 51 - 60 61 - 75 over 75 Chart 4c: Brooklyn Regional Office Children by Length of Referral to IFSP Process, CY 2006 and CY 2007 222 761 109 276 150 268 149 361 209 610 0% 10% 20% 30% 40% 50% 60% 70% 80% 90% 100% 2006 (last 6 months) 2007 (last 6 months) %ofchildreningroup 0 - 45 46 - 50 51 - 60 61 - 75 over 75 August 2008 Page 11 Office of Policy & Planning
  • 13. Chart 4d: Queens Regional Office Children by Length of Referral to IFSP Process, CY 2006 and CY 2007 521 293 215 149 236 219 303 301 215 397 0% 10% 20% 30% 40% 50% 60% 70% 80% 90% 100% 2006 (last 6 months) 2007 (last 6 months) %ofchildreningroup 0 - 45 46 - 50 51 - 60 61 - 75 over 75 August 2008 Page 12 Office of Policy & Planning
  • 14. Chart 4e: Staten Island Regional Office Children by Length of Referral to IFSP Process, CY 2006 and CY 2007 153 192 36 21 51 38 58 31 54 28 0% 10% 20% 30% 40% 50% 60% 70% 80% 90% 100% 2006 (last 6 months) 2007 (last 6 months) %ofchildreningroup 0 - 45 46 - 50 51 - 60 61 - 75 over 75 August 2008 Page 13 Office of Policy & Planning
  • 15. # of Days # % # % ppt. change 0 - 45 150 18.7% 164 19.9% 1.2 46 - 50 75 9.3% 86 10.4% 1.1 51 - 60 138 17.2% 141 17.1% -0.1 61 - 75 199 24.8% 159 19.3% -5.5 over 75 241 30.0% 275 33.3% 3.3 Total 803 100.0% 825 100.0% # of Days # % # % ppt. change 0 - 45 409 30.7% 294 30.0% -0.7 46 - 50 99 7.4% 55 5.6% -1.8 51 - 60 185 13.9% 111 11.3% -2.6 61 - 75 268 20.1% 175 17.8% -2.3 over 75 371 27.9% 346 35.3% 7.4 Total 1,332 100.0% 981 100.0% # of Days # % # % ppt. change 0 - 45 222 26.5% 761 33.4% 7.0 46 - 50 109 13.0% 276 12.1% -0.9 51 - 60 150 17.9% 268 11.8% -6.1 61 - 75 149 17.8% 361 15.9% -1.9 over 75 209 24.9% 610 26.8% 1.9 Total 839 100.0% 2,276 100.0% # of Days # % # % ppt. change 0 - 45 521 35.0% 293 21.6% -13.4 46 - 50 215 14.4% 149 11.0% -3.5 51 - 60 236 15.8% 219 16.1% 0.3 61 - 75 303 20.3% 301 22.1% 1.8 over 75 215 14.4% 397 29.2% 14.8 Total 1,490 100.0% 1,359 100.0% # of Days # % # % ppt. change 0 - 45 153 43.5% 192 61.9% 18.5 46 - 50 36 10.2% 21 6.8% -3.5 51 - 60 51 14.5% 38 12.3% -2.2 61 - 75 58 16.5% 31 10.0% -6.5 over 75 54 15.3% 28 9.0% -6.3 Total 352 100.0% 310 100.0% Queens Staten Island Table 4. EI Children by Length of Referral and IFSP Process by Borough, CY 2006 and CY 2007 2006 (last 6 months) 2007 (last 6 months) 2006 (last 6 months) 2007 (last 6 months) Manhattan Bronx Brooklyn Source: KIDS data as of 07/02/08; First Health data as of 07/04/08; DocTrac data as of 08/20/08. 2006 (last 6 months) 2007 (last 6 months) 2006 (last 6 months) 2007 (last 6 months) 2006 (last 6 months) 2007 (last 6 months) August 2008 Page 14 Office of Policy & Planning
  • 16. APPENDIX: DATA ANALYSIS DESCRIPTION Data Manipulation Process EI claims paid from January 1, 2003 to June 20, 2008 for service coordination and evaluations, a DocTrac extract of all MDE receipt dates through August 20, 2008, and KIDS data for children whose initial IFSP meeting were held within the study period were merged. The dates of initial service coordination, first evaluation, and last evaluation of each child included in this analysis were captured by creating a new dataset which contained only the earliest service coordination date, earliest evaluation date, and most recent evaluation date which were delivered after the date of the child’s latest referral. In addition, the State-assigned EI identification number, date of initial referral, date of initial IFSP meeting, latest referral date, borough office responsible for child, and borough of child’s residence were all preserved in the dataset. The number of days which elapsed between the 6 key events (latest referral, initial service coordination, initial evaluation, last evaluation, MDE receipt date, and initial IFSP meeting) was calculated for each child in the dataset. The total number of days between the start (date of latest referral) and end of the process (date of initial IFSP meeting) were calculated for each child in the dataset. Observations (children) were then grouped by the number of days that elapsed between their latest referral date and their initial IFSP meeting date. The categories are as follows, group 1: 45 days or less, group 2: over 45 days, but not more than 50, group 3: over 50 days, but not more than 60, groups 4: over 60 days, but not more than 75, and group 5: over 75 days. The data is presented on both a citywide and borough basis. Included and Excluded Observations CY 2006 dataset: The original dataset contained 6,912 observations (unique children). 6,842 of the children included in the dataset had initial service coordination dates. 5,085 had MDE receipt dates, and 6,613 were found to have at least one evaluation date. 4,816 children were found to have dates for all key events. 915 children (13% of the original dataset) had a case which was closed and reopened before they reached their initial service plan meeting. Observations missing any of the 6 key events and observations with implausible start dates (latest referral dates that were more recent than their initial service plan meeting date) were dropped from the dataset. This left 4,816 observations in the dataset (70% of the original dataset), which was large enough of a sample for the purposes of this analysis. CY 2007 dataset: The original dataset contained 7,017 observations (unique children). 6,959 of the children included in the dataset had initial service coordination dates, 5,975 had MDE receipt dates, and 6,782 were found to have at least one evaluation date. 5,751 children were found to have dates for all key events. 979 children (14% of the original dataset) had a case which was closed and reopened before they reached their initial service plan meeting. October 2007 Page 1 Office of Policy & Planning
  • 17. Observations missing any of the 6 key events and observations with implausible start dates (latest referral dates that were more recent than their initial service plan meeting date) were dropped from the dataset. This left 5,751 observations in the dataset (82% of the original dataset), which is a large enough sample for the purposes of this analysis. August 2008 Page 2 Office of Policy & Planning