Anti-Bribery and Corruption Compliance for Third Parties
9 Finding Fraud through Data Analytics
1. 10 APERCU - July 2015
Correlation of two factors
Fighting FraudThrough DataAnalytics
Today’s digitalised world calls for greater sophistication
C
orporations, like banks and securities
firms, deal with millions of transactions
every day. As many of these transactions
must be processed timely, it is commercially and
practically not feasible to implement perfect
preventive controls. By way of compensation,
data analytics can be used to detect abnormal
transactions.Think of the call from your credit
card centre to verify whether you did indeed
make a large purchase ten minutes earlier.That
is data analytics put into practice.
Fraudsters too have their limitations.They may
have insufficient resources to draft and execute
their “business plan”. A money launderer, for
example, could be under pressure to whitewash
$30 million in funds in a year’s time but only
have a small network to manipulate. Naturally,
that makes it more likely that deviations from
common patterns show up.
Common types of data analytics
Data analytics is an effective tool for detecting
fraud, especially when applied to the oceans
of transactions.The objective is to identify
anomalies.
Traditionally, anti-fraud specialists have relied
on trend analysis – comparing the actual figure
with that of comparable periods, with that of
companies in the same industry or with a pre
set objective (such as a budget). In theory,
trend analysis is a comparison of two results,
which can be caused by different factors. It is
more effective in identifying a difference than in
explaining it.
To look for more indicative signs, anti-fraud
specialists have to apply more sophisticated data
analytical techniques.There are three common
types of techniques, which should be used in
combinations.
Distribution analysis
This is a study of the distribution of transactions.
It is a technique generally applied in our daily
lives as our attention is naturally drawn to more
extreme cases. For example, auditors usually
sample a few more sales transactions from the
month where the sales amount significantly
deviates from the norm.
When the pool of transactions becomes too
large, however, there is a problem of finding
the norm and the threshold. In such situations,
anti-fraud specialists apply Benford’s Law which
compares the actual distribution against a set of
statistical and mathematical norms.
Benford’s law (also known as the First Digit
Law) is named after physicist Frank Albert
Benford. He discovered that figures beginning
with the number 1 have the highest probability
of occurring (at about 30%) in many listings,
tables of statistics, etc.The probability of
other numbers being the first digit decreases
progressively, as shown in the Table 1.
When the pool of data is large enough, the
normal distribution of data should conform to
this statistical norm.
Fraudsters do not usually follow this pattern
when making up transactions and figures.
Accordingly, anti-fraud specialists apply
Benford’s law – comparing the actual distribution
of transactions with the statistical norm – to
identify any variances in sample distribution.
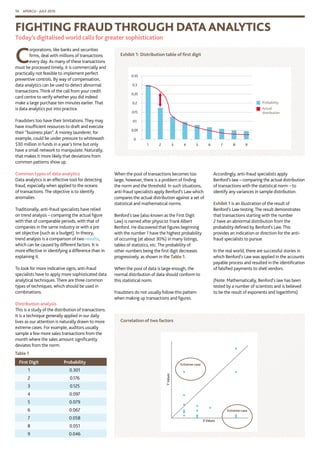
Exhibit 1 is an illustration of the result of
Benford’s Law testing.The result demonstrates
that transactions starting with the number
2 have an abnormal distribution from the
probability defined by Benford’s Law.This
provides an indication or direction for the anti-
fraud specialists to pursue.
In the real world, there are successful stories in
which Benford’s Law was applied in the accounts
payable process and resulted in the identification
of falsified payments to shell vendors.
(Note: Mathematically, Benford’s law has been
tested by a number of scientists and is believed
to be the result of exponents and logarithms)
0.35
0.3
0.25
0.2
0.15
0.1
0.05
0
1 2 3 4 5 6 7 8 9
Probability
Actual
distribution
Exhibit 1: Distribution table of first digit
XValues
YValues
Table 1
First Digit Probability
1 0.301
2 0.176
3 0.125
4 0.097
5 0.079
6 0.067
7 0.058
8 0.051
9 0.046
Extreme case
Extreme case
2. APERCU - July 2015 11
The fraud triangle
Rationalisation Incentive/Pressure
Oppurtunities
• Lack of controls
• Lack of segregation of
duties
Fraud
Triangle
Correlation analysis
Correlation analysis is the study of the strength
of the relationship of one dependent factor to
one independent factor. It is most effective in
identifying anomalies in a cause-and-effect
relationship.
Assuming that management knows their
business well enough, they should be able to
identify the real cause of an effect.Taking an
example from a call centre that has hundreds of
staff answering calls and processing numerous
small refunds, correlation analysis could be
conducted by comparing two variables - the
hours at work and the number of refunds
processed. Since there is a strong correlation
between the two variables over a period of time,
anti-fraud specialists calculate the regression
and identify the cases that fall beyond the scope.
The objective is to identify possible fraudulent
or careless refunds with an indication that
company’s policy could be overridden by those
who handled too many cases compared to
others.
Correlation analysis is usually applied in the
following situations:
1. The subject matter is not directly measurable
(eg Quality of material inspections by
corrupted engineer)
2. The volume of subject matter is large in
number, but individual samples are small in
value
3. The cost of detailed inspection is high
Scenario testing
Scenario testing is probably the most interesting
assignment in fraud risk management. It is a
simulation of the fraudster’s mind, on which
basis the possible fraudulent behaviors are
tested, assuming the related internal controls
have already been compromised.
According to the fraud triangle theory, Fraud
occurs at the cracks of internal control systems.
Pulling out the transactions from the cracks can
help anti-fraud specialists identify:
1. any suspicious transactions;
2. the control loopholes in the system; and
3. the existing controls that are not present, but
should be.
Certain anti-money laundering measures at
banks are a manifestation of scenario testing. For
example, there is a daily cash deposit threshold
of HK$80,000. Crossing the threshold will set
off an internal alarm. By scenario testing, anti-
fraud specialists first assume that the fraudsters
know the threshold and are trying to defeat the
system by depositing cash in amounts ranging
from HK$70,000 to HK$79,999. Accordingly,
anti fraud specialists pull in the transactions
in the range of HK$70,000 to HK$79,999 and
study whether there are any unusual patterns –
such as a concentration warning, when most of
those deposits are made by a small number of
account holders.
However, these data analytics techniques do
have their limitations. Benford’s law may not
work accurately in a small pool of samples;
operational data are not always available for
conducting correlation analysis; and scenario
testing requires both sufficient knowledge of
business and unbiased creativity from fresh
minds, which do not always come together.
There are no perfect detection systems, nor
perfect scams. Fighting fraud through data
analytics is about increasing the probabilities of
winning the game of “Hide and Seek”.
For further enquiries about applying data
analytics in your fraud control programme,
please contact our Director and Head of Risk
Advisory Services, Patrick Rozario at 2218 3118
or patrickrozario@bdo.com.hk
Jason Wong
Risk Advisory Services
jasonwong@bdo.com.hk
Recent BDO
publications
HKFRS/IFRS UPDATES
HKFRS/IFRS Update 2015/07
IFRSs, Interpretations
committee - agenda rejections
(March 2015)
s
Background
This update summarises issues that the IFRS Interpretations Committee (the Interpretations
Committee) decided not to take onto its agenda at its March 2015 meeting, which were
reported in its public newsletter (the IFRIC Update). Although these agenda rejections do not
represent authoritative guidance issued by the International Accounting Standards Board
(IASB), in practice they are regarded as being highly persuasive. All entities that report in
accordance with IFRS need to be aware of these agenda rejections, and may need to modify
their accounting approach. More detailed background about agenda rejections is set out
below.
The Interpretations Committee is the interpretative body of the IASB. The role of the
Interpretations Committee is to provide guidance on financial reporting issues which have
been identified and which are not specifically addressed in IFRS, or where unsatisfactory or
conflicting interpretations either have developed, or appear likely to develop.
Any party which has an interest in financial reporting is encouraged to submit issues to the
Interpretations Committee when it is considered to be important that the issue is addressed
by either the Interpretations Committee itself, or by the IASB. When issues are raised, the
Interpretations Committee normally consults a range of other parties, including national
accounting standard setting bodies, other organisations involved with accounting standard
setting, and securities regulators.
At each of its meetings, the Interpretations Committee considers new issues that have been
raised, and decides whether they should be added to its agenda. For those issues that are not
added to the agenda, a tentative agenda decision is published in the IFRIC Update newsletter
which is issued shortly after each of the Interpretations Committee’s meetings. These
tentative agenda decisions are open to public comment for a period of 60 days, after which
point they are taken back to the Interpretations Committee for further consideration in the
light of any comment letters which have been received and further analysis carried out by
the Staff. The tentative agenda decision is then either confirmed and reported in the next
IFRIC Update, or the issue is either subjected to further consideration by the Interpretations
Committee’s agenda or referred to the IASB.
Interpretations Committee agenda decisions do not represent authoritative guidance.
However, they do set out the Interpretations Committee’s rationale for not taking an issue
onto its agenda (or referring it to the IASB). It is noted on the IFRS Foundation’s website that
they “should be seen as helpful, informative and persuasive”. In practice, it is expected that
entities reporting in accordance with IFRS will take account of and follow the agenda
decisions and this is the approach which is followed by securities regulators worldwide.
STATUS
Final
EFFECTIVE DATE
Immediate
ACCOUNTING IMPACT
Clarification of IFRS
requirements.
May lead to changes in
practice.
HKFRS / IFRS UPDATE 2015/07
IFRS INTERPRETATIONS COMMITTEE –
AGENDA REJECTIONS (MARCH 2015)
ISSUE 2015/07
MAY 2015
WWW.BDO.COM.HK
If you wish to obtain a copy of the publication, please visit
www.bdo.com.hk
BDO GLOBAL NEtWORK
DEVELOPMENT AT A GLANCE
BDO appoints new member firm in Honduras
B
DO is pleased to announce the appointment of a new member firm in Honduras
effective 7 May 2015.The new firm, BDO Honduras SRL, formerly Mendieta y
Asociados, S. de R.L., was established in 1978, making it one of the longest
standing local firms in Honduras.The firm was previously a representative of AGN
International and is headquartered inTegucigalpa, with a further presence in San Pedro
Sula. BDO Panama will cooperate closely with BDO Honduras to ease the transition into
BDO.
The core services BDO Honduras provide are audit, outsourcing, tax and consulting.
Their significant industry expertise is focused on the financial and commercial sectors, in
which they have a number of major clients.The firm has witnessed stable development in
recent years and growth is expected to accelerate under the BDO brand.