Big Apple Scrum Day 2015 - Advanced Scrum Metrics Reference Sheet
•
1 gostou•4,841 visualizações

Reference sheet for presentation given at Big Apple Scrum Day 2015 on advanced metrics for agile and scrum teams. It is recommended that teams track a few metrics for each of the 5 categories outlined in the presentation to be able to assess the impact of activities supportive of continuous improvement. This reference sheet includes over 30 metrics to give teams ideas on what they can measure. There isn’t a requirement to track 30 metrics on a scrum or agile team but rather teams should track just enough metrics to be able to understand their performance.

Recomendados
Mais conteúdo relacionado
Mais procurados
Mais procurados (20)
Destaque
Destaque (10)
Semelhante a Big Apple Scrum Day 2015 - Advanced Scrum Metrics Reference Sheet
Semelhante a Big Apple Scrum Day 2015 - Advanced Scrum Metrics Reference Sheet (20)
Mais de Jason Tice
Mais de Jason Tice (20)
Último
Último (20)
Big Apple Scrum Day 2015 - Advanced Scrum Metrics Reference Sheet
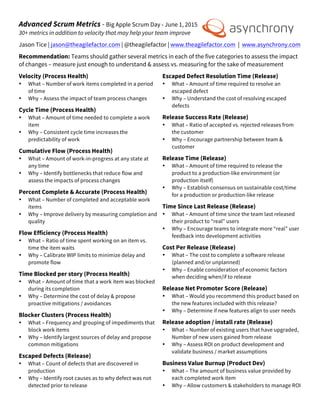
- 1. Advanced Scrum Metrics - Big Apple Scrum Day - June 1, 2015 30+ metrics in addition to velocity that may help your team improve Jason Tice | jason@theagilefactor.com | @theagilefactor | www.theagilefactor.com | www.asynchrony.com Recommendation: Teams should gather several metrics in each of the five categories to assess the impact of changes – measure just enough to understand & assess vs. measuring for the sake of measurement Velocity (Process Health) • What – Number of work items completed in a period of time • Why – Assess the impact of team process changes Cycle Time (Process Health) • What – Amount of time needed to complete a work item • Why – Consistent cycle time increases the predictability of work Cumulative Flow (Process Health) • What – Amount of work-in-progress at any state at any time • Why – Identify bottlenecks that reduce flow and assess the impacts of process changes Percent Complete & Accurate (Process Health) • What – Number of completed and acceptable work items • Why – Improve delivery by measuring completion and quality Flow Efficiency (Process Health) • What – Ratio of time spent working on an item vs. time the item waits • Why – Calibrate WIP limits to minimize delay and promote flow Time Blocked per story (Process Health) • What – Amount of time that a work item was blocked during its completion • Why – Determine the cost of delay & propose proactive mitigations / avoidances Blocker Clusters (Process Health) • What – Frequency and grouping of impediments that block work items • Why – Identify largest sources of delay and propose common mitigations Escaped Defects (Release) • What – Count of defects that are discovered in production • Why – Identify root causes as to why defect was not detected prior to release Escaped Defect Resolution Time (Release) • What – Amount of time required to resolve an escaped defect • Why – Understand the cost of resolving escaped defects Release Success Rate (Release) • What – Ratio of accepted vs. rejected releases from the customer • Why – Encourage partnership between team & customer Release Time (Release) • What – Amount of time required to release the product to a production-like environment (or production itself) • Why – Establish consensus on sustainable cost/time for a production or production-like release Time Since Last Release (Release) • What – Amount of time since the team last released their product to “real” users • Why – Encourage teams to integrate more “real” user feedback into development activities Cost Per Release (Release) • What – The cost to complete a software release (planned and/or unplanned) • Why – Enable consideration of economic factors when deciding when/if to release Release Net Promoter Score (Release) • What – Would you recommend this product based on the new features included with this release? • Why – Determine if new features align to user needs Release adoption / install rate (Release) • What – Number of existing users that have upgraded, Number of new users gained from release • Why – Assess ROI on product development and validate business / market assumptions Business Value Burnup (Product Dev) • What – The amount of business value provided by each completed work item • Why – Allow customers & stakeholders to manage ROI
- 2. Risk Burndown (Product Dev) • What – Amount of known and unmitigated risk shown across a period of time • Why – Encourage self-management to reduce project risk Push / Pull (Product Dev) • What – The ratio / count of work items completed vs. work items added • Why – Guard against team being overwhelmed with work that can compromise promise Product Forecast (Product Dev) • What – Future trend lines (best & worst case) based on historical performance of work item completion • Why – Predict when future work will be completed using work item count Product Net Promoter Score (Product Dev) • What – Would you recommend this product to a colleague? • Why – Gather simple yet comprehensive user feedback on if the product meets user needs User Analytics (Product Dev) • What – Identify usage patterns within the product • Why – Determine effectiveness of design; look for emergent usage patterns that warrant consideration for future investment Test Coverage (Technical / Code) • What – Percentage of codebase exercised by various types of automated tests • Why – Guide efforts / investments to improve test coverage to sufficient levels Build Time (Technical / Code) • What – Execution time to run build and tests to provide developer feedback • Why – Guard against slow builds & test execution that reduce frequency of feedback Defect Density (Technical / Code) • What – Percentage of defects in each area of the system – determined by functionality or code architecture • Why – Identify parts of the app/code where quality can be improved Code Churn (Technical / Code) • What – Number of lines of code changed to complete a work item • Why – Assess if the amount of code changed is reflective of the work item addressed Code Ownership (Technical / Code) • What – Frequency that team members change or commit to each area of the code base • Why – Assess and promote collective code ownership Code Complexity (Technical / Code) • What – Cyclomatic complexity score of product code base determined by a tool • Why – Promote engineering practices to create clean code using quantitative data Coding Standards Adherence (Technical / Code) • What – Assessment score of code alignment to architecture standards • Why – Promote agreed upon coding standards to create clean code Crash Rate (Technical / Code) • What – Frequency of incidents that cause the application / product to crash • Why – Be able to perform root cause analysis to reduce crashes; Improve the user experience Happiness Metric (Team / People) • What – Team member satisfaction as a member of the team (5 point scale) • Why – Create transparency regarding team member satisfaction Learning Log (Team / People) • What – A listing of items the team (or team members) have learned • Why – Direct focus to the importance of learning on scrum teams / projects throughout their duration Team Tenure (Team / People) • What – How long has each team member been on the team • Why – Encourage activities reflective of tenure (mentoring for new team members, job/knowledge sharing for long standing team members) Phone-A-Friend Stats (Team / People) • What – Number of times a former team member needs to be contacted for assistance • Why – Assess effectiveness of job sharing and knowledge transfer activities as team members change; Promote sharing of work & knowledge Whole Team Contribution (Team / People) • What – Percentage of team members that contribute to a work item throughout its lifecycle • Why – Quantitative metric to assess & improve whole- team approach