Entegris Annual Report
•
1 gostou•627 visualizações

Entegris 2002 Annual Report

Recomendados
Mais conteúdo relacionado
Semelhante a Entegris Annual Report
Semelhante a Entegris Annual Report (20)
Mais de Meeker Public Relations
Último
Último (20)
Entegris Annual Report
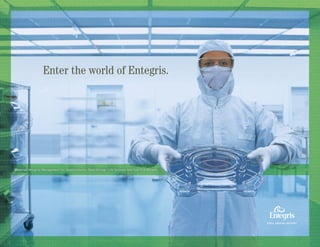
- 1. 2002 ANNUAL REPORT Enter the world of Entegris.
- 2. 2002 Financial Highlights Entegris has a history of delivering results, and has been very successful in maintaining and growing our market leadership in materials integrity management. We delivered a profitable fiscal year 2002 in an incredibly difficult market environment. We also generated cash from operations during each one of our fiscal quarters. I firmly believe that our microelectronics industry success will translate into successes in our newest markets, life sciences and fuel cell. James E. Dauwalter President and Chief Executive Officer Feb 01 May 01 Aug 01 Nov 01 Nov 00 Feb 02 May 02 Aug 02 $102.6 $105.7 $81.3 $52.7 $45.9 $50.7 $59.7 $63.6 0 20 40 60 80 100 120 Quarterly Revenue $Inmillions FY 01 FY 02 $0.26 $0.14 -$1.7 -$1.4 $0.04 $0.06 $9.9 -$0.02-$0.02 Feb 01(1) May 01(1) Aug 01 Nov 01(1) Nov 00 Feb 02 May 02(1) Aug 02(1) $Inmillions,exceptpersharedata Quarterly Net Income (Loss) (1)Excludes one-time charges and benefits. FY 01 FY 02 $0.26 $0.14 -$1.7 -$1.4 $0.04 $0.06 $9.9 -$0.02-$0.02 Earnings (loss) per share Net income (loss) $0.25 $0.26 $0.14 -$0.02 -$1.4-$3.4 $2.8 $4.4 -$1.7 $18.1 $18.9 $9.9 -$0.02 $0.04 -$0.05 $0.06 -5 0 5 10 15 20 25 Feb 01 May 01 Aug 01 Nov 01 Nov 00 Feb 02 May 02 Aug 02 $3.3 $7.2 $17.7 Strong Cash Position $117.2 $119.6 $129.8 $111.1 $113.1 $106.4 $107.5 $119.5 $17.2 $8.9 $25.8 $28.0 Cash, cash equivalents & short term investments Net cash provided by operating activity FY 01 FY 02 $0.26 $0.14 -$1.7 -$1.4 $0.04 $0.06 $9.9 -$0.02-$0.02 $Inmillions $4.7 0 5 10 15 20 25 30 100 115 130 145
- 3. 1 “Entegris achieved its 36th consecutive year of annual profitability. This was not an easy feat in light of current industry conditions. We focused on what we could control, including operational efficiencies, cost reductions, managing our assets wisely and investing in the future of Entegris. This will remain our focus for fiscal year 2003.” John D. Villas Chief Financial Officer Materials Integrity Management . . . . . . . . . . . . . . 2 Letter to Shareholders . . . . . . . . . . . . . . . . . . . . . . 4 Semiconductor . . . . . . . . . . . . . . . . . . . . . . . . . . . . . 8 Data Storage and Services . . . . . . . . . . . . . . . . . . 12 Life Sciences and Fuel Cell . . . . . . . . . . . . . . . . . 14 Glossary . . . . . . . . . . . . . . . . . . . . . . . . . . . . . . . . . . 16 Financial and Corporate Review . . . . . . . . . . . . . 17 Table of Contents Life Sciences ~1%Services ~8% Data Storage ~11% Semiconductor ~80% -$1.4 $0.04 $0.06 -$0.02 Sales by Market FY 2002 -$1.4 $0.04 $0.06 -$0.02 Year ended Year ended Percent (%) August 31, 2002 August 25, 2001 Change Operating results Net sales $ 219,831 $ 342,444 -36% Gross profit 88,706 162,670 -45% Operating profit (loss)(1) (2,271) 67,643 NM Net income(1) 2,373 45,165 -95% Pro forma earnings per share – diluted(1) 0.03 0.62 -95% Weighted shares outstanding – diluted 74,170 72,995 2% Balance sheet data Cash, cash equivalents and short-term investments $ 119,454 $ 111,079 8% Total assets 390,260 405,815 -4% Long-term debt 12,691 13,101 -3% Shareholders' equity 322,114 312,307 3% Financial ratios Gross margin 40.4% 47.5% Operating margin(1) -1.0% 19.8% Return on average shareholders’ equity(1) 0.7% 15.6% (1)Excludes nonrecurring charges for fiscal 2001 and nonrecurring charges and benefits for fiscal 2002. Financial Summary ($ In thousands, except per share data) On the Cover: 300 mm single wafer shippers, produced in Entegris’ manufac- turing Center of Excellence, safely transport valuable materials.
- 4. Enter the world of materials integrity management. The world is benefiting from amazing leaps in technology. As processes become more sophisticated, and products are developed from advances in applied physics, chemistry and biology, the need for materials integrity management grows. And that’s the world of Entegris. It’s a world where special care and purity are essential. It’s a world where integrity is required in order to manufacture, protect and transport the materials used to make the objects of dreams. It’s our world, the world of materials integrity management. Enter the world of Entegris.
- 5. 3 The global market for materials integrity management is very broad. Entegris protects and transports critical materials for key technologies. Semiconductor Data Storage ServicesLife SciencesFuel Cell Entegris provides materials integrity management products for: • Semiconductor Materials • Semiconductor Equipment • Semiconductor Devices • Semiconductor Test, Assembly and Packaging Entegris provides materials integrity management products for: • Disk Substrates • Wafers/Sliders/HGAs • Disk Media • Disk Drives Entegris provides materials integrity management products for: • Fuel Cells Portable Stationary Transportation • Reformers Entegris provides materials integrity management products for: • Pharmaceuticals • Biopharmaceuticals • Biotechnology Products • Medical Devices Entegris provides materials integrity management services for these markets: • Semiconductor • Data Storage • Life Sciences
- 7. 5 Staying focused in challenging times This year’s annual report is designed to give you a glimpse into our fiscal year 2002 financials, our markets, our products, our values, and, most importantly, the people of Team Entegris. Our fiscal year 2002, which ended August 31, 2002, was one of the most challenging in the company’s 36-year history. Our major market – the global semiconductor industry – experienced its most historic down cycle. Yet, Team Entegris recorded another profitable year. In addition, we generated over $30 million in cash from operations, entered the year with $111 million in cash and short-term investments, and closed the year with $119 mil- lion. Our balance sheet also remained strong. We were able to do so by focusing on the elements of our business environment that we can control: costs and efficiencies. During the last 12 months we continued our plant consolida- tions and brought our costs in line with the realities of today’s global economy. Our effort resulted in about $10 million in re- duction of our quarterly fixed costs. Over the last year, we had to make some tough decisions, but we did so with the conviction that we were strengthening our core business and building the foundation for taking our leading technologies into new markets. Consolidations and cost-cutting When Fluoroware and Empak merged in 1999 to form Entegris, we had 18 worldwide manufacturing facilities. In 2001, we acquired four companies with manufacturing facilities. Today, we have a total of 16 manufacturing plants, all part of manufac- turing Centers of Excellence focused on providing world-class products and services in geographies close to our customers. We did what we had to do to reduce costs and increase our over- all efficiencies. We also tackled the painful process of reducing our cost structure. In addition to closing facilities, we initiated salary freezes, reduced workweeks, shut down facilities during holidays, and relied upon temporary employees to adjust labor to workflow. During such times, the morale of a company can suffer. Yet, Team Entegris responded magnificently. By focusing on what we can control, our people were able to not only participate in our progress, but to drive that progress with a spirit of innovation and purpose. The can-do attitude of Team Entegris is as strong and focused as ever. The Entegris executive leadership team shown left to right: Gregory B. Graves, Chief Business Development Officer; Stan Geyer, Chairman; James E. Dauwalter, President and Chief Executive Officer; John D. Villas, Chief Financial Officer; Michael W. Wright, Chief Operating Officer. To our shareholders:
- 8. Innovation While we had many examples last year of successful innovation, we want to highlight two: a new horizontal wafer shipper and a proprietary valve diaphragm manufacturing process. New horizontal wafer shipper One of the problems we solved for our customers last year was the protection of thin wafers. A thin wafer is about twice the thickness of a human hair. On such wafers, semiconductor manu- facturers build chips for use in products ranging from computers to cell phones to automobiles. When a thin wafer is filled with such expensive chips, the wafer can be worth up to 50 times its weight in gold. As a result of implementing the Entegris new horizontal wafer shipper solution, our customers were able to realize a ten times reduction in breakage during transport, which translates into potential savings in the millions of dollars. As a result, Entegris saw sales of our horizontal wafer shipper increase, even during the semiconductor industry down cycle. Proprietary valve diaphragm Our new valve diaphragm manufacturing process is a classic example of Team Entegris focusing on internal efficiencies. Valves with diaphragms made out of flexible TEFLON® polymers are one of the cornerstones of our fluid handling line. Because the diaphragm is so critical, production requires very tight tolerances and process controls. We reduced the number of steps involved and automated the manufacturing process. This technique is so novel we didn’t want to reveal it in a patent application, so we are treating it as a trade secret. We were able to accomplish this thanks to an outstanding project team applying our core competencies in polymer science and manufacturing product design. New material development At the core of many new product developments is our ability to develop new polymer-based materials. In the last year, we expanded our technology leadership by introducing over 20 new materials to address the specific needs of our high-tech customers. In addition, we developed new polymer manufacturing capabilities that, to our knowledge, no other materials integrity management company in this industry has been able to accomplish. New polymer developments, new product introductions and cost-effective manufacturing techniques are at the core of Entegris’ success. “The Entegris brand has become synonymous with providing customers leading innovations that allow them to be successful.” James E. Dauwalter, President and Chief Executive Officer Addressing a critical need of customers, Entegris introduced the horizontal wafer shipper to provide the utmost protection for fragile thin wafers during transport. Cover Cushions Wafers Inserts Base 6
- 9. 7 Delivering on our goals Entegris became a publicly traded company in July 2000. At that time, we set five major goals: expand our technology leadership; broaden our product offerings; build on our presence in Japan; take our technology into new markets; and pursue selective acquisitions. Throughout this annual report, you will see evidence of those goals being met. You will also see a new Entegris emerging. In the past, we had organized around two product sets: microelec- tronics and fluid handling. Today, we are organized around five markets: semiconductor, life sciences, services, data storage, and fuel cell. This new organizational structure allows us to maintain our focus on customer service while taking our tech- nology into new and expanding markets. Each of those new market segments will focus on our core customers, our core values and our core competencies. We know that keeping a satisfied customer is just as important as finding a new one. Our new organization is designed to allow us to do just that while searching for new customers that need Entegris technology. Team Entegris has shown it knows how to handle the vagaries of a world economy. We have managed to profitability in good times and bad. Now, we need to challenge ourselves to move for- ward and retain our materials integrity management leadership in the microelectronics market and expand it into new markets. The new challenge We have established five new strategic five-year goals. First, we want to be one of the top three companies in every market we serve including the new market we entered just this year. Second, we want to generate an even greater percent- age of revenue from new products and services in all existing markets. Third, we want to increase annual revenues to $700 million. Fourth, we want our new markets to contribute at least $150 million to our revenue stream. Fifth, we want to make our operations a competitive weapon by being the most efficient producer of goods and services in every market we serve. Team Entegris will strive to achieve these new challenges. Our company is blessed to have an active and dedicated board of directors, a motivated and experienced senior management team, and some of the most talented and dedicated employees in the business today. Welcome to the world of Entegris. By demonstrating INTEGRITY we will be a trustworthy and reputable company. By demonstrating EXCELLENCE we will achieve consistently high performance. By demonstrating RESPECTFUL RELATIONSHIPS we will ensure satisfaction and retention among all our key stakeholders. By achieving FINANCIAL SUCCESS we will ensure corporate financial strength that benefits all our stakeholders. The Values of Entegris Stan Geyer James E. Dauwalter Chairman of the Board President and Chief Executive Officer
- 11. 9 Determined to succeed From our headquarters in Chaska, Minnesota, to our manufac- turing facilities in the United States, Germany, Japan and Malaysia, the men and women of Entegris are enabling the world’s leading technologies. We are determined to succeed in our mission: to provide quality manufactured products, services and systems to protect and transport critical materials. Solving critical problems every day Entegris provides a peerless level of technical expertise. Our core competencies of polymer material science, comprehensive polymer product manufacturing and microelectronics industry processing knowledge reflect this expertise. In solving critical problems for our customers, we sell more than 10,000 different products to over 1,000 customers, includ- ing virtually every company in the semiconductor industry. In addition, we have advanced research facilities and a large intel- lectual property portfolio that includes more than 125 patents in the United States and over 140 patents worldwide. A reputation built on empowerment Our ongoing success is also due to our advances in implement- ing LeanSigma Manufacturing. Under this philosophy, Entegris employees are empowered to continuously look for ways to improve business processes, to eliminate all non-value added activities or waste from manufacturing and support areas, and to compress the amount of time needed to produce a product or service. The results are greater productivity, shorter delivery times, lower costs, improved quality and increased customer satisfaction. With a well-earned reputation of expertise in managing the integrity of our customers’ critical materials throughout the microelectronics industry, 2002 saw Entegris not only strengthen- ing its position in the semiconductor and data storage markets, but also advancing into life sciences and fuel cell technologies. Enter the world of a profitable organization. Entegris has enabled microelectronics industry customers to grow exponentially. Just one reason why we’ve shown annual profits for 36 consecutive years. In Japan, workers assemble valves destined to protect the ultrapure and corrosive chemicals used to manufacture ICs. Assembly of 300 mm FOUPs in controlled environments using defined processes is only one way we ensure reliable product performance to protect critical 300 mm wafers.
- 12. 10 Enabling the world’s technologies Entegris is the world’s leading materials integrity management company. We care for the materials that go into the manufacture of today’s technological products, as they are transported to or within a manufacturing facility – all the way from their begin- nings as silicon or substrates, until they become chips or disks. The silicon wafer serves as the base material for integrated circuits (ICs) or computer chips, which are the foundation of the modern technological miracles we often take for granted. In fact, the average person encounters hundreds of semiconduc- tors every day in computers, cell phones, ABS brakes, video game consoles, digital cameras or televisions, and any other item with a chip or a disk. We have consistently demonstrated innovation over the years and 2002 was no exception. Accordingly, this past year saw the introduction of numerous products that further enabled the industry to become more efficient in both protecting and transporting its critical materials. Our latest products include: • Reticle SMIF pod • 300 mm horizontal wafer shipper • 300 mm film frame cassette • FIMS compatible FOSB door • FOUP enhancements • Flaretek® 90° sweep elbows • Integra® distribution valves • Accutek® flowmeters • Integrated flow controllers • Stream™ tape and reel Ensuring integrity at every step During the semiconductor manufacturing process, the value of a silicon wafer increases at each successive step in a fabrication facility, or fab. A wafer must be protected from contamination and breakage throughout the entire process, as it is transported from the wafer manufacturer to the chip manufacturer and within each of the approximately 900 wafer processing fabs worldwide. This is no small task, as the wafers go through as many as 500 process steps within a fab. In addition, ultrapure and corrosive chemicals used to manufac- ture semiconductors must also be protected from contamination during transport from the chemical manufacturer to the fab – as well as inside the fab. With purity levels measured in parts per trillion and the highly corrosive nature of many of the materials, this is a large undertaking. To ensure the safety and integrity of silicon wafers and ultra- pure and corrosive chemicals, the world’s leading semiconduc- tor materials manufacturers rely on Entegris, because we provide the most advanced wafer handling systems, fluid handling components, containers and services in the business. Entegris also protects, transports, cleans, reuses and recycles materials for semiconductor equipment manufacturers and semiconductor device manufacturers. Entegris’ fluid handling products protect the integrity of ultrapure and corrosive chemicals in our customers’ wafer surface conditioning equipment.
- 13. 11 Managing silicon from production to consumption No other company has as much wafer handling experience as Entegris in fabs. Our Silicon Delivery™ Systems and Services cost-effectively manage silicon from production to consumption for any wafer size. Our innovative wafer handling systems are engineered to provide secure wafer protection and precise automation interface, as well as increase yields and minimize unscheduled downtime. One of the key drivers in the semiconductor industry is the production, distribution and processing of 300 mm wafers, and we are playing an integral role. Entegris already has the broadest 300 mm wafer handling product offering in the industry. Our 300 mm Front Opening Unified Pods (FOUPs) are the finest prod- ucts designed for handling these latest-generation silicon wafers during critical process steps. Positioning in the 300 mm market is important, but 200 mm fabs and below will be a major source of Entegris’ revenue for many years to come (see chart at right). We also serve the Test, Assembly and Packaging market by ensuring the integrity of ICs once they are cut from the wafers. As tiny ICs are assembled, tested and then transported to the manufacturers of the devices consumers purchase, our protec- tive device handling systems, including matrix trays, chip trays and bare die trays ensure the integrity of these valuable devices. The broadest range of fluid handling solutions offered As previously mentioned, Entegris’ fluid handling products and services are designed and produced to safely, and with purity, deliver ultrapure, corrosive chemicals throughout the semicon- ductor manufacturing process. We offer the broadest range of fluid handling solutions for chemical applications. Our products include leading-brand valves, fittings, pipe, tubing, containers, tanks, sensors and custom manufactured products for chemical manufacturing, chemical delivery and distribution, and chemical point-of-use. When you enter the world of semiconductor manufacturing, you’ll find Entegris supporting our customers with the most comprehensive product line in the industry and unparalleled dedication to their success. After final manufacturing, packaged ICs are transported to makers of electronic goods in Entegris’ JEDEC trays to ensure the best protection. 200 mm 40% 300 mm 12% <125 mm 4% 125 mm 17% 150 mm 27% Source: VLSI Research, Inc. (06/02) 2005 Projected Industry Demand for Wafers “Entegris has the broadest product offering, the broadest customer base and in-depth knowledge of the microelectronics industry. Time and time again, Entegris’ innovations have helped solve our customers’ problems. That’s why we are the leader in materials integrity management for the microelectronics industry.” Michael W. Wright, Chief Operating Officer
- 15. Industry-standard data storage systems Entegris is the leading supplier of Disk Delivery™ Systems and Services. In the data storage market, we cost-effectively manage disk drive components from production to consumption. Our industry-standard disk shippers, disk process carriers, storage boxes and disk packages control the risk of loss during the transport of disk products. And in 2002, we expanded our prod- uct line with the F10 EVO, a next generation disk shipper. With global regional service centers, we can provide protection, transportation, cleaning, reuse and recycling services anywhere for manufacturing disk substrate, wafers/sliders and HGAs, disk media and disk drives. Industry-leading intellectual property Like the semiconductor sector, the data storage industry has gone through a significant and prolonged downturn. Still, Entegris forged ahead during this time to proactively meet the needs of customers. In 2002, we moved most of our disk shipper manufacturing to our Center of Excellence in Kulim, Malaysia. This added presence in the Far East is more efficient and closer to our largest concentration of data storage customers. As we look beyond 2002, we will continue to be a leading force in the data storage industry due to our excellence in material science and processes, as well as in industry-leading intellectual property. Controlling the full life cycle of products Entegris offers its data storage and semiconductor customers the ability to efficiently outsource the management of their entire wafer, device and disk programs. We acquired two companies last year with precision cleaning systems and service offerings. With these acquisitions, we strengthened our ability to serve our customers, and rounded out our product and industry expertise. With our Disk Delivery™ and Silicon Delivery™ Systems and Services, Entegris now can control the full life cycle of our products, including cleaning, reuse or replacement and recycling. The services we offer cover five areas: cleaning equipment, on-site serv- ices, off-site services, environmental services, and recycling of materi- als. Despite difficult industry conditions, our service offerings continue to prove their value as customers seek to out source non-core tasks. When it comes to services, Entegris is committed to offer the broadest product line, a global infrastructure, and the best industry know-how. Disk shippers receive thorough inspection prior to cleaning under the Disk Delivery™ Systems and Services programs. Enter the world of unmatched capabilities. Entegris offers the largest suite of materials integrity management products and services to the data storage and semiconductor industries. That’s why our customers trust us to handle their valuable critical materials. Entegris’ off-site services clean, inspect and certify customers’ products. 13
- 17. 15 Expanding our vision Materials integrity management ensures that products, systems and services that transport critical materials, in any industry, will provide the utmost protection to that material. This is why mate- rials integrity management is very important to the life sciences and fuel cell industries. In 2002, our continuing expansion into life sciences grew out of our fluid handling expertise. Life sciences growth areas include pharmaceutical manufacturing, biotechnology, medical devices and food and beverage processing. Many companies in these industries presently rely on stainless steel for fluid transfer. While stainless steel can be cleaned, it is costly, time-consuming, and not always entirely effective. The fact that many new drugs are sensitive to metals also negatively impacts their manufacturing. Entegris solutions for life sciences include our non-reactive and easy to clean FDA-approved TEFLON® fluoropolymer products and our steam-in-place (SIP) compatible products, including our recently released FluoroPure® fluoropolymer sheetlining. By replacing stainless steel with nonmetallic components, market leaders in life sciences can experience increased yields by enhancing cleanability and eliminating problems such as corrosion and metallic contamination. A key player in tomorrow’s world The past year also saw us enter into another exciting new market: fuel cell. For this emerging market, Entegris is produc- ing advanced components including bipolar plates, end plates, and balance-of-plant components and subsystems to fuel cell manufacturers. Fuel cells represent a major new materials in- tegrity management market. A fuel cell converts hydrogen fuel and oxygen from the air into electrical power via a chemical reaction. Water and heat are the only by-products of this reaction, that’s why some futurists predict we will eventually move to a global hydrogen economy with fuel cells powering almost every- thing. Since fuel cells have numerous gas and liquid handling issues, our fluid handling products and expertise provide ideal solutions. Fuel cells are a natural extension for Entegris: they use numerous bipolar plates that can be made from conductive polymers; the fuel cell stacks require complex assembly and expertise in handling a number of polymeric materials; and fuel cells require contamination control and must be leak-free to be reliable. Our mission in this emerging market is to be the leading provider of advanced materials, components, sub-assemblies and value-added services to fuel cell developers. Enter the world of expanding markets. The need for materials integrity management grows with each new frontier of science. Another reason we are excited about our future in the fuel cell and life sciences markets. Thorough testing of steam-in-place and clean-in-place capabilities of Cynergy® fluid handling components ensure the requirements of the pharmaceutical industry are met with Entegris’ first-to-market polymer-based product line. Conductiviety testing ensures the bipolar plate will perform properly.
- 18. 16 Balance-of-plant. Those components additional to and integrated with a fuel cell’s primary power module to make up the entire operational system, such as a reformer, valves and piping, and the fuel storage medium. Cell assemblies. The process of placing individual fuel cells adjacent to one another to form a fuel cell stack. Normally, the stack is connected in a series. Centers of Excellence. Manufacturing centers focused on excelling in the production of products with similar requirements to maximize the utilization of facilities while ensuring products get to market quickly and efficiently. Chemical point of use. The location within a fab where the chemical is introduced to the process. Chips. One unit on a silicon wafer that contains the complete circuit. Typically there are hundreds of chips per wafer. Also known as die, device or integrat- ed circuit (IC). Cleanroom manufacturing. Manufacturing of any product that occurs within a cleanroom: one that is a confined area in which humidity, temperature and particle matter are precisely controlled. Core competency. Entegris’ core competencies are polymer material science, plastics product manufac- turing and microelectronics industry processing knowledge. Critical material. Any essential material that through advanced manufacturing processes becomes part of a technical product. These critical materials require special care and protection during transportation and storage. Disk Delivery™ Systems and Services. Entegris’ unique materials integrity management solution that cost-effectively manages hard disks and related materials from production to consumption utilizing its systems and services capabilities. Entegris works with customers to develop custom packages to address individual needs. entegris.com. Entegris’ Web site containing informa- tion on materials integrity management, the company and its products and services. Fab. Short for wafer fabrication facility: The factory or plant where semiconductors (chips, die, ICs) are made. Refers to only the front end process. Front end. Separating the complex semiconductor manufacturing process into the major groupings of front end and back end. Front end is the series of processes used to create the semiconductor devices in and on the wafer surface. A blank, polished starting wafer comes into fabrication and when it exits, the surface is covered with completed chips. FOUP. Front opening unified pod: an environment used to protect and transport 300 mm wafers within a fab during wafer processing. FOSB. Front opening shipping box: a transport container for 300 mm bare wafers. Fuel cell. An electrochemical device that continuously converts the chemical energy of a fuel and an oxidant to electrical energy. The fuel and oxidant are typically stored outside of the cell and transferred into the cell as the reactants are consumed. Horizontal wafer shippers. The Entegris horizontal wafer shipper provides secure protection for process- ing, storage and shipping of full thickness or thinned wafers. Integra® valve. Entegris’ valve with all-molded PFA wetted surfaces offering unmatched purity, chemical inertness and high temperature capabilities. Integrated Circuits (ICs). See Chips. Integrity. The state of being unimpaired. Also one of Entegris’ values demonstrated by being honest with all, consistently fair with all, acting legally, responsi- bly and ethically, and making decisions that will be respected by people globally. LeanSigma manufacturing. Using six sigma tools and lean manufacturing tools to change the way of thinking and the processes within an organization. The goal is to nurture a culture where all of the employees feel empowered and continuously look for ways to improve their processes and systematize the best methods. LeanSigma is a philosophy of eliminat- ing all non-value added activities or waste from manufacturing and support areas and to drive to a single standard of operations where possible. Life Sciences. A target market comprising biophar- maceutical, bulk and finishing pharmaceutical, bio- technology, medical and food and beverage industries. These industries traditionally rely on stainless steel for fluid transfer. Our FDA-approved TEFLON® PFA based products are revolutionary for these industries. Materials Integrity Management. Most materials that go into the manufacturing of today’s technology items need special care when being transported to or within a manufacturing facility. Materials integrity management is protecting and transporting these critical materials. Microcontamination. Very small levels of unwanted material that adversely affect the physical or electri- cal characteristics of an IC. Microelectronics industry. The microelectronics industry provides the world with electronic products that make people’s lives more enjoyable and produc- tive. The semiconductor and hard disk drive/data storage industries are segments within the microelec- tronics industry. Polymer material science. The developmental research providing the basis for the design, synthesis, engineering, testing and application of polymers used to meet and anticipate our customer’s materials requirements. Production to Consumption. Describing the entire manufacturing process of the finished chip from grow- ing the wafer, to building the integrated circuit (IC) to testing, assembling and packaging the finished IC before it is integrated into the end-user product. Reformer. A fuel cell term referring to a vessel within which fuel and other gaseous recycle stream(s) (if present) are reacted with water vapor and heat, usually in the presence of a catalyst, to produce hydro- gen rich gas for use within the fuel cell power plant. Semiconductor. Generic name for transistors and integrated circuits that can control the flow of elec- tric signals. A semiconductor is an element such as silicon or germanium that acts as an intermediate in electrical conductivity. Silicon. The material used for fabricating diodes, transistors and integrated circuits. Silicon Delivery™ Systems and Services. A unique materials integrity management solution that cost- effectively manages silicon from production to consumption utilizing Entegris’ systems and services capabilities. Entegris works with customers to develop custom coordinated packages to address individual needs. Test, Assembly and Packaging (TAP). Includes the testing of ICs, assembly and putting the IC into a protective package. This often occurs at a remote location from the front end process and is commonly referred to as the back end process. Thin wafer. To thin a wafer, it undergoes a step such as backgrinding to reduce the wafer from its original thickness during chip fabrication to a diminished thickness suitable for final packaging of die after dicing. Values based. Entegris culture and the way we do business and conduct ourselves is based on our four values of integrity, excellence, respectful relation- ships and financial success. Valve diaphragm. The closing device that performs the function of opening and closing the valve orifice. It is controlled by the valve operator. Wafer. A thin slice of a semiconductor material that serves as the base for chips. Glossary
- 19. ENTEGRIS, INC. AND SUBSIDIARIES 17 MANAGEMENT’S DISCUSSION AND ANALYSIS OF FINANCIAL CONDITION AND RESULTS OF OPERATIONS INDEX Management’s discussion and analysis of financial condition and results of operations . . . . . . . . . . . . . . . . 17 Consolidated balance sheets . . . . . . . . . . . . . . . . . . . . . . . . . . . . . . 24 Consolidated statements of operations . . . . . . . . . . . . . . . . . . . . . 25 Consolidated statements of shareholders’ equity . . . . . . . . . . . . . 26 Consolidated statements of cash flows . . . . . . . . . . . . . . . . . . . . . 27 Notes to consolidated financial statements . . . . . . . . . . . . . . . . . 28 Independent auditors’ report . . . . . . . . . . . . . . . . . . . . . . . . . . . . . . 37 Selected historical financial data . . . . . . . . . . . . . . . . . . . . . . . . . . . 38 Shareholders’ information . . . . . . . . . . . . . . . . . . . . . . . . . . . . . . . . 39 Corporate information . . . . . . . . . . . . . . . . . . . . . . . . . . . . . . . . . . . 40 OVERVIEW Entegris, Inc. is a leading provider of materials integrity man- agement products and services that protect and transport the critical materials used in key technology-driven industries. Entegris was incorporated in June 1999 to effect the business combination of Fluoroware, Inc., which began operating in 1966, and EMPAK, Inc., which began operating in 1980. The business combination was accounted for as a pooling of interests. Accordingly, the historical financial statements of Entegris include the historical accounts and results of operations of Fluoroware and EMPAK and their respective subsidiaries, as if the business combination had existed for all periods presented. Entegris primarily derives its revenue from the sale of products to the semiconductor and data storage industries and generally recognizes sales upon the shipment of such goods to customers. Cost of sales includes polymers and purchased components, manufacturing personnel, supplies and fixed costs related to depreciation and operation of facilities and equipment. The Company’s customers consist primarily of semiconductor man- ufacturers, semiconductor equipment and materials suppliers, and hard disk manufacturers, and are served through various subsidiaries and sales and distribution relationships in the United States, Asia and Europe. The Company’s fiscal year is a 52- or 53-week period ending on the last Saturday of August. The last three fiscal years ended on the following dates: August 31, 2002, August 25, 2001 and August 26, 2000. Fiscal 2002 comprises 53 weeks, while fiscal years 2001 and 2000 included 52 weeks. Fiscal years are identi- fied in this report according to the calendar year in which they end. For example, the fiscal year ended August 31, 2002 is alternatively referred to as ‘‘fiscal 2002’’ or “2002”. CRITICAL ACCOUNTING POLICIES Management’s discussion and analysis of financial condition and results of operations are based upon the Company’s consolidated financial statements, which have been prepared in accordance with accounting principles generally accepted in the United States. The preparation of these financial state- ments requires the Company to make estimates, assumptions and judgments that affect the reported amounts of assets, liabilities, revenues and expenses and related disclosure of contingent assets and liabilities. At each balance sheet date, management evaluates its estimates, including, but not limited to, those related to accounts receivable, inventories, long-lived assets, warranty and sales return obligations, and income taxes. The Company bases its estimates on historical experi- ence and on various other assumptions that are believed to be reasonable under the circumstances. Actual results may differ from these estimates under different assumptions or condi- tions. The critical accounting policies affected significantly by estimates, assumptions and judgments used in the preparation of the Company’s financial statements are discussed below. Net Sales 20022001200019991998 Fiscal year $220 $342$343 $242 $267 0 50 100 150 200 250 300 350 $Inmillions Enter the world of financial stability. Entegris’ experienced team achieved 36 years of annual profitability and generated cash in every quarter in fiscal 2002. That’s a solid foundation to fund future growth.
- 20. 18 ENTEGRIS, INC. AND SUBSIDIARIES MANAGEMENT’S DISCUSSION AND ANALYSIS OF FINANCIAL CONDITION AND RESULTS OF OPERATIONS ALLOWANCE FOR DOUBTFUL ACCOUNTS AND OTHER ACCOUNTS RECEIVABLE-RELATED VALUATION ACCOUNTS. The Company maintains an allowance for doubtful accounts as well as reserves for sales returns and allowances, and warranty claims. Significant management judgments and estimates must be made and used in connection with establishing these valuation accounts. Material differences could result in the amount and timing of the Com- pany’s results of operations for any period if we made different judgments or utilized different estimates. In addition, actual results could be different from the Company’s current estimates, possibly resulting in increased future charges to earnings. The Company provides an allowance for doubtful accounts for all individual receivables judged to be unlikely for collection. For all other accounts receivable, the Company records an allowance for doubtful accounts based on a combination of factors. Specifically, management analyzes the age of receivable balances, historical bad debts write-off experience, customer concentrations, general customer creditworthiness and current economic trends when determining its allowance for doubtful accounts. At August 31, 2002 and August 25, 2001, the Company’s allowance for doubtful accounts was $1.8 million and $1.6 million, respectively. A reserve for sales returns and allowances is established based on historical trends and current trends in product returns. At August 31, 2002 and August 25, 2001, the Company’s reserve for sales returns and allowances was $1.2 million and $1.9 million, respectively. The Company records a liability for estimated warranty claims. The amount of the accrual is based on historical claims data by product group and other factors. Claims could be materially different from actual results for a variety of reasons, including a change in the Company’s warranty policy in response to industry trends, competition or other external forces, manufacturing changes that could impact product quality, or as yet unrecog- nized defects in products sold. At August 31, 2002 and August 25, 2001, the Company’s accrual for estimated future warranty costs was $0.7 million and $1.0 million, respectively. INVENTORY VALUATION. The Company uses certain estimates and judgments to properly value inventory. In general, the Company’s inventories are recorded at the lower of standard manufacturing cost or market value. Each quarter, the Company evaluates its ending inventories for obsolescence and excess quantities. This evaluation includes analyses of inventory levels, historical loss trends, expected product lives, sales levels by product and projections of future sales demand. Inventories that are considered obsolete are written off. In addition, reserves are established for inventory quantities in excess of forecasted demand. At August 31, 2002 and August 25, 2001, in- ventory reserves were $5.8 million and $5.8 million, respectively. The Company’s inventories comprise materials and products subject to technological obsolescence and which are sold in a highly competitive industry. If future demand or market condi- tions are less favorable than current analyses, additional inventory write-downs or reserves may be required and would be reflected in cost of sales in the period the revision is made. IMPAIRMENT OF LONG-LIVED ASSETS. The Company routinely considers whether indicators of impairment of its property and equipment assets, particularly its molding equipment, are present. If such indicators are present, it is determined whether the sum of the estimated undiscounted cash flows attributable to the assets in question is less than their carrying value. If less, an impairment loss is recognized based on the excess of the carrying amount of the assets over their respective fair values. Fair value is determined by discounted estimated future cash flows, appraisals or other methods deemed appropriate. If the assets determined to be impaired are to be held and used, the Company recognizes an impairment charge to the extent the present value of anticipated net cash flows attributable to the asset are less than the asset’s carrying value. The fair value of the asset then becomes the asset’s new carrying value, which we depreciate over the remaining estimated useful life of the asset. The Company assesses the impairment of intangible assets and related goodwill at least annually, or whenever events or changes in circumstances indicate that the carrying value may not be recoverable. Factors considered important which could trigger an impairment review, and potentially an impairment charge, include the following: •significant underperformance relative to historical or projected future operating results; •significant changes in the manner of use of the acquired assets or the Company’s overall business strategy; •significant negative industry or economic trends; and •significant decline in the Company’s stock price for a sustained period changing the Company’s market capitalization relative to its net book value. The Company’s marketable equity securities are periodically reviewed to determine if declines in fair value below cost basis are other-than-temporary. At August 31, 2002, the Company’s investment in Metron Technology N.V. had a carrying value of $7.6 million with a fair value of $4.2 million. If the decline in fair value is determined to be other-than-temporary, an impairment loss will be recorded and the investment written down to a new cost basis. INCOME TAXES. In the preparation of the Company’s consolidat- ed financial statements, management is required to estimate income taxes in each of the jurisdictions in which the Company operates. This process involves estimating actual current tax exposures together with assessing temporary differences result- ing from differing treatment of items for tax and accounting purposes. These differences result in deferred tax assets and liabilities, which are included in the Company’s consolidated balance sheet. The Company has significant amounts of deferred tax assets that are reviewed for recoverability and valued accordingly. Management evaluates the realizability of the deferred tax assets on a quarterly basis and assesses the need for valuation allowances. These deferred tax assets are evaluated by consider- ing historical levels of income, estimates of future taxable income streams and the impact of tax planning strategies. A valuation allowance is recorded to reduce deferred tax assets
- 21. ENTEGRIS, INC. AND SUBSIDIARIES 19 MANAGEMENT’S DISCUSSION AND ANALYSIS OF FINANCIAL CONDITION AND RESULTS OF OPERATIONS when it is determined that the Company would not be able to realize all or part of its deferred tax assets. At August 31, 2002, the Company carried a valuation allowance of $1.4 million against its net deferred tax assets with respect to certain foreign net operating loss carryforwards. RESULTS OF OPERATIONS The following table sets forth the relationship between various components of operations, stated as a percent of net sales, for fiscal year 2002, 2001 and 2000. The Company’s historical finan- cial data were derived from its audited consolidated financial statements and related notes included elsewhere in this annual report. Percent of Net Sales 2002 2001 2000 Net Sales 100.0% 100.0% 100.0% Cost of sales 59.6 52.5 53.3 Gross profit 40.4 47.5 46.7 Selling, general and administrative expenses 33.5 22.9 21.3 Engineering, research and development expenses 7.9 4.8 4.4 Nonrecurring charges 0.7 3.8 — Operating (loss) profit (1.7) 15.9 21.0 Interest (income) expense, net (0.7) (1.3) 0.7 Other income, net (0.4) (0.3) (1.4) (Loss) income before income taxes and other items below (0.6) 17.6 21.7 Income tax expense (benefit) (1.5) 6.2 7.8 Equity in net income of affiliates — (0.4) (0.5) Minority interest (0.4) 0.5 0.1 Income before extraordinary item 1.3 11.3 14.3 Extraordinary loss on extinguishment of debt, net of taxes — — (0.3) Net income 1.3 11.3 14.0 FISCAL 2002 COMPARED TO FISCAL 2001 NET SALES. Net sales were $219.8 million in fiscal 2002, down 36% from $342.4 million in fiscal 2001. The decline reflected the continuation of weakened business conditions in the semicon- ductor industry that began in the second half of fiscal 2001, as the semiconductor industry experienced unprecedented deterio- ration in market conditions, with rapidly falling rates of factory utilization and reduced capital spending. The sales decrease was attributable to softer demand for both fluid handling products, which generally depend on capital spending levels, and micro- electronics products, which also depend on the manufacturing utilization of the semiconductor industry. Although the Company reported sequentially higher quarterly sales as fiscal 2002 progressed, fourth quarter revenues were still significantly below the record levels experienced in the first half of 2001. Fiscal 2002 sales for the Microelectronics Group were down 28% from fiscal 2001 and accounted for about 76% of Entegris sales. Fluid Handling sales in 2002 were down 52% from a year ago, making up 24% of total sales. Revenue declines were recorded in all geographic regions, with approximately 40% year-to-year declines experienced for North America, Europe and Japan, while sales to the Asia Pacific region fell just 13%, which reflects a nominal decrease of Microelectronics Group product sales to that region. Overall, international sales accounted for approximately 53% of net sales in fiscal 2002, up from 50% in fiscal 2001. Fiscal 2002 sales were 47% to North America, 21% to Asia Pacific, 16% to Europe and 16% to Japan. Based on current order rates, industry analyst expectations and other information, the Company expects that sales for the first quarter of fiscal 2003 will be approximately 20% lower than sales levels experienced in the fourth quarter of fiscal 2002. However, industry volatility and uncertain global market conditions make it difficult to forecast for future quarters. GROSS PROFIT. Gross profit in fiscal 2002 decreased 45% to $88.7 million, compared to $162.7 million in fiscal 2001. The Company’s gross margin for fiscal 2002 was 40.4% compared to 47.5% for fiscal 2001. Gross margin and gross profit declines were reported by both domestic and international operations. The drop in fiscal 2002 figures was primarily caused by the lower sales levels noted above, which resulted in lower factory utilization. Gross profit levels generally improved throughout the year as sales increased sequentially by quarter. Partly offsetting the declines was the benefit of the Company’s actions in reducing costs and increasing manufacturing efficien- cies associated with the closure of manufacturing plants, investing in automation, changing process flows and instituting manufacturing Centers of Excellence. The Company also record- ed lower asset impairment charges in 2002, incurring charges of $1.1 million and $3.5 million in 2002 and 2001, respectively, mainly for asset write-offs of molds. As discussed above, the Company cannot provide guidance about fiscal 2003 sales levels. However, in general, gross profit and gross margin variances mainly track the utilization of the Company’s production capacity associated with varying sales levels. SELLING, GENERAL AND ADMINISTRATIVE EXPENSES (SG&A). SG&A expenses decreased $4.9 million, or 6%, to $73.6 million in fiscal 2002 from $78.5 million in fiscal 2001. The decline is primarily due to significantly lower incentive compensation and charitable contribution accruals, which are based on the Company’s results of operations, offset partly by increased expenditures for information systems and a continuation of building the Company’s global infrastructure which began in fiscal 2001. SG&A costs, as a percent of net sales, increased to 33.5% from 22.9% with the impact of lower SG&A expenses more than offset by the effect of lower net sales. NONRECURRING CHARGES (REVERSALS). In the first quarter of 2002, the Company’s results included a nonrecurring charge of $4.0 million in connection with the closure of the Company’s Chanhassen, MN plant. The charge included $1.5 million in ter- mination costs related to a workforce reduction of 230 employ- ees and $2.3 million for estimated losses for asset impairment. The Company recorded pre-tax benefits of $1.6 million and $0.8 million in the third quarter and fourth quarters of 2002,
- 22. 20 ENTEGRIS, INC. AND SUBSIDIARIES MANAGEMENT’S DISCUSSION AND ANALYSIS OF FINANCIAL CONDITION AND RESULTS OF OPERATIONS respectively, associated with the reversal of previous accruals related to the plant closures in 2002 and 2001. Approximately $1.0 million of the reversals was associated with the favorable settlement of future lease commitments on the Castle Rock facility, for which the Company had recorded accruals in 2001. Lower than expected impairment costs accounted for approxi- mately $1.2 million of the reversals. Operating results in fiscal 2001 included two nonrecurring charges. In fiscal 2001, the Company recorded a charge of $8.2 million related to the early termination of a distribution agree- ment and a $4.9 million charge in connection with the closing of its Castle Rock, Colorado and Munmak, Korea facilities. Both charges are described in greater detail below. As of August 31, 2002, $0.2 million remained outstanding in connection with the aforementioned nonrecurring charges. ENGINEERING, RESEARCH AND DEVELOPMENT EXPENSES (ER&D). ER&D expenses increased 5% to $17.4 million, or 7.9% of net sales, in fiscal 2002 as compared to $16.5 million, or 4.8% of net sales, in fiscal 2001. In fiscal 2002, the Company’s expen- ditures were focused on supporting current product lines, developing new manufacturing technologies and developing next generation products for new and existing markets. INTEREST (INCOME) EXPENSE, NET. The Company reported net interest income of $1.5 million in fiscal 2002 compared to $4.5 million in fiscal 2001. The change reflects the significantly lower rates of interest earned on cash equivalents and short-term investments and a shift in the mix of such investments towards tax-exempt debt securities. OTHER INCOME, NET. Other income was $1.0 million in fiscal 2002 compared to $1.1 million in fiscal 2001. Other income in fiscal 2002 consisted primarily of the foreign currency gains, with about $0.7 million associated with the realization of translation gains from the liquidation of the Company’s Korean entity, while other income in fiscal 2001 included foreign currency translation gains offset by losses on sales of property and equipment. INCOME TAX EXPENSE (BENEFIT). The Company recorded an income tax benefit of $3.4 million for fiscal 2002 compared to income tax expense of $21.3 million in fiscal 2001. The effective tax rate for fiscal 2002 was 241.8% compared to 35.5% in fiscal 2001. The variance primarily reflects the significant difference in the Company’s pre-tax operating results. The income tax benefit in fiscal 2002 includes a one-time benefit of $1.4 million related to the repatriation of earnings from certain non-U.S. subsidiaries, while income tax expense in fiscal 2001 includes a $1.6 million tax benefit associated with the closure of the Company’s Korean manufacturing operations, losses of which were previously non-deductible. The Company expects an effective tax rate of about 38% in fiscal 2003. EQUITY IN NET INCOME OF AFFILIATES. The Company recorded no equity in the net income of affiliates in fiscal 2002 compared to $1.5 million in fiscal 2001, all of which was recorded in the first half of that fiscal year. This reflects the change in account- ing for the Company’s investment in Metron Technology N.V. (Metron), which was recorded under the equity method of accounting through the second quarter of fiscal 2001 at which time the Company began accounting for its remaining invest- ment as an available-for-sale equity security, as our percentage ownership in Metron was reduced from 20% to 12%. MINORITY INTEREST. For fiscal 2002, the minority interest in subsidiaries’ net loss was $0.8 million, reflecting the operating losses of the Company’s formerly 51%-owned Japanese sub- sidiaries in the first half of the year. The Company purchased the 49% minority interests in these entities in February 2002. This compares to minority interest in subsidiaries’ net income of $1.6 million for fiscal 2001. NET INCOME. Net income decreased to $2.8 million, or $0.04 per share diluted, in fiscal 2002, compared to net income of $38.6 million, or $0.53 per share diluted, in fiscal 2001. Excluding the effects of nonrecurring charges and reversals in fiscal 2002 and 2001, pro forma diluted earnings per share declined to $0.03 from $0.62 per share in 2001. FISCAL 2001 COMPARED TO FISCAL 2000 NET SALES. Net sales were $342.4 million in fiscal 2001, flat when compared to $343.5 million in fiscal 2000. The Company reported record sales in the first half of 2001, reflecting a con- tinuation of strong business conditions in the semiconductor industry that began in the second half of 1999. However, incoming order rates began to decline rapidly late in the second quarter of 2001 for both fluid handling products, which are dependent on capital spending levels in the semiconductor industry, and microelectronics products, reflecting declining manufacturing utilization of wafer manufacturers and semiconductor manufac- turers. Consequently, the Company experienced significantly lower sales over the last half of the year, resulting in level sales with 2000. Falling order rates began to stabilize during the fourth quarter of fiscal 2001. Increased sales in Japan offset revenue declines in the North America and Asia Pacific regions, with European sales unchanged from one year ago. Overall, international sales accounted for approximately 50% of net sales in fiscal 2001, up from 48% in fiscal 2000. Sales of fluid handling products, which made up 33% of total sales, grew by 5%, while microelectronics product sales, 67% of total sales, fell slightly. GROSS PROFIT. Gross profit in fiscal 2001 increased to $162.7 million, a small increase over the $160.4 million reported in fiscal 2000. The minor improvement in fiscal 2001 partly reflects the benefit of integrating various elements of the Company’s manufacturing operations. Asset impairment charges of $3.5 million and $5.9 million were recorded in 2001 and 2000, respectively, mainly for asset write-offs of molds. Gross margin for fiscal 2001 improved to 47.5% compared to 46.7% for fiscal 2000. Gross profit and gross margin variances mainly track the utilization of the Company’s production capacity associated with varying sales levels. Consequently, the Company reported improved gross profits and gross margins in excess of 50% during the first half of 2001, but experienced declining gross profits and lower gross margins over the latter half of the year.
- 23. ENTEGRIS, INC. AND SUBSIDIARIES 21 MANAGEMENT’S DISCUSSION AND ANALYSIS OF FINANCIAL CONDITION AND RESULTS OF OPERATIONS SELLING, GENERAL AND ADMINISTRATIVE EXPENSES. Selling, general and administrative (SG&A) expenses increased $5.2 million, or 7%, to $78.5 million in fiscal 2001 from $73.3 million in fiscal 2000. SG&A costs, as a percent of net sales, increased to 22.9% from 21.3%. The year-to-year increase is due to the cost of building the Company’s global infrastructure including the addition of direct sales forces in Europe and Asia, as well as the SG&A expenses from acquired businesses. Fiscal 2001 also includes higher expenditures for information systems. NONRECURRING CHARGES. Operating results in fiscal 2001 include two nonrecurring charges. During the second quarter, the Company recorded a charge of $8.2 million related to the early termination of a distribution agreement for the Microelectronics Group with its affiliate, Metron Technology N.V. (Metron). Pursuant to the termination agreement, the Company assumed direct sales responsibility for the Microelectronics Group prod- uct sales in Europe and Asia, and transferred to Metron 1.125 million shares of Metron stock and agreed to make future cash payments totaling $1.75 million. Entegris also agreed to buy back certain microelectronics product inventory from Metron. The Company and Metron also executed a new distribution agreement for Entegris’ Fluid Handling Group products, which now runs through August 31, 2005. During the third quarter, the Company recorded a $4.9 million charge in connection with the closing of its Castle Rock, Colorado and Munmak, Korea facilities. The charge includes $1.7 million in termination costs related to a workforce reduc- tion of 170 employees and $1.4 million for estimated losses for asset disposals. In addition, the charge includes $1.8 million for future lease commitments on the Castle Rock facility, the lessor of which is a major shareholder of the Company. ENGINEERING, RESEARCH AND DEVELOPMENT EXPENSES (ER&D). ER&D expenses increased to $16.5 million in fiscal 2001, up 10% from $15.0 million in 2000. ER&D expense, as a percent of net sales, rose to 4.8% in 2001 from 4.4% in fiscal 2000. A major element of fiscal 2001 ER&D costs relates to the continued development of next generation 300 mm products. INTEREST (INCOME) EXPENSE, NET. The Company reported net interest income of $4.5 million in fiscal 2001 compared to net interest expense of $2.4 million in fiscal 2000. The variance relates to interest earnings on invested cash generated from operations and the receipt of net proceeds of $99.0 million from the Company’s initial public offering in the fourth quarter of fiscal 2000, $42 million of which was used to retire long-term debt and capital lease obligations. OTHER INCOME, NET. Other income was $1.1 million in fiscal 2001 compared to $4.9 million in fiscal 2000. The decrease was primarily due to the absence of the $5.5 million gain recognized in fiscal 2000 on the sale of approximately 612,000 shares of the Company’s investment in Metron. Other income in fiscal 2001 included foreign currency translation gains offset by losses on sales of property and equipment. INCOME TAX EXPENSE. Income tax expense was $21.3 million in fiscal 2001 compared to $26.8 million in fiscal 2000, primarily re- flecting lower pre-tax income. The effective tax rate for 2001 was STATEMENTS OF OPERATIONS DATA Fiscal 2001 Fiscal 2002 Q1 Q2 Q3 Q4 Q1 Q2 Q3 Q4 (In thousands) Net sales $ 102,639 $ 105,712 $ 81,346 $ 52,747 $ 45,852 $ 50,702 $ 59,709 $ 63,568 Gross profit 52,552 53,601 37,890 18,627 15,195 16,938 28,127 28,446 Selling, general and administrative expenses 21,235 19,727 18,761 18,787 17,630 17,566 19,299 19,074 Engineering, research and development expenses 3,533 4,035 4,697 4,252 4,041 4,475 4,228 4,664 Operating profit (loss) 27,784 21,629 9,498 (4,412) (10,477) (5,103) 6,240 5,506 Net income (loss) before extraordinary item $ 18,112 $ 13,784 $ 8,428 $ (1,708) $ (5,916) $ (1,386) $ 5,226 $ 4,852 Q1 Q2 Q3 Q4 Q1 Q2 Q3 Q4 (Percent of net sales) Net sales 100.0% 100.0% 100.0% 100.0% 100.0% 100.0% 100.0% 100.0% Gross profit 51.2 50.7 46.6 35.3 33.1 33.4 47.1 44.7 Selling, general and administrative expenses 20.7 18.7 23.1 35.6 38.4 34.6 32.3 30.0 Engineering, research and development expenses 3.4 3.8 5.8 8.1 8.8 8.8 7.1 7.3 Operating profit (loss) 27.1 20.5 11.7 (8.4) (22.8) (10.1) 10.5 8.7 Net income (loss) 17.6 13.0 10.4 (3.2) (12.9) (2.7) 8.8 7.6 Our quarterly results of operations have been, and will likely continue to be, subject to significant fluctuations due to a variety of factors, a number of which are beyond the Company’s control.
- 24. 22 ENTEGRIS, INC. AND SUBSIDIARIES MANAGEMENT’S DISCUSSION AND ANALYSIS OF FINANCIAL CONDITION AND RESULTS OF OPERATIONS 35.5% compared to 35.8% in 2000. The effective rate in 2001 in- cluded a $1.6 million tax benefit associated with the closure of the Korea operation, losses of which were previously non-deductible. EQUITY IN NET INCOME OF AFFILIATES. During March 2001, the Company surrendered ownership of 1.125 million shares of its investment in Metron in connection with the charge described above under the caption “Nonrecurring charges”. As a result, the Company’s percentage ownership in Metron decreased to approximately 12%. The Company discontinued application of the equity method to account for its investment in Metron and accounts for its remaining investment as an available-for-sale security under the provisions of Statement of Financial Accounting Standards (SFAS) No. 115, Accounting for Certain Investments in Debt and Equity Securities. Therefore, the Company recorded no equity in the net income of affiliates in the third or fourth quarters of fiscal 2001. For the first six months of 2001, the Company recorded equity in the net income of affiliates of $1.5 million in 2001 compared to $1.7 million for all of 2000. MINORITY INTEREST. For fiscal 2001, minority interest in sub- sidiaries’ net income more than tripled to $1.6 million compared to fiscal 2000. This figure reflects the improved financial per- formance at Entegris’ 51%-owned Japanese subsidiaries (wholly-owned as of February 2002). NET INCOME. Net income decreased to $38.6 million in fiscal 2001, compared to net income of $47.9 million in fiscal 2000. After the market value adjustment related to redeemable common stock, net income applicable to nonredeemable common shareholders was $38.6 million, or $0.53 per share diluted, in fiscal 2001, compared to a net loss of $0.7 million, or a loss of $0.02 per share diluted, in fiscal 2000. Excluding the effects of the market value adjustment related to redeemable common stock, nonrecurring charges in fiscal 2001 and the fiscal 2000 gain on the sale of an affiliate’s common stock, pro forma earnings per share declined to $0.62 per share in 2001 from $0.68 in 2000. QUARTERLY RESULTS OF OPERATIONS The table on page 21 presents selected data from the Company’s consolidated statements of operations for the eight quarters ended August 31, 2002. This unaudited information has been prepared on the same basis as the audited consolidated finan- cial statements appearing elsewhere in this annual report. All adjustments which management considers necessary for the fair presentation of the unaudited information have been included in the quarters presented. From mid-1999 through the second quarter of fiscal 2001, the Company reported steadily improving net sales, primarily result- ing from improved market conditions in the semiconductor industry. As sales grew, gross profits and margins improved prin- cipally due to improved utilization of production capacity, and often a more favorable product sales mix. During the last two quarters of fiscal 2001 and through fiscal 2002, the Company’s sales levels fell to well below those reported in the first half of 2001, reflecting the downturn in the global semiconductor in- dustry, including significant cutbacks in industry capital spend- ing. Quarterly sales levels improved sequentially through fiscal 2002, but were still nearly 40% lower than sales experienced in the first half of 2001. Consequently, the Company experienced lower utilization in its manufacturing operations, leading to generally lower gross profits and earnings in 2002. Net income in the second quarter of fiscal 2001 includes a pretax charge of $8.2 million related to the termination of a distribution agreement. Net income in the third quarter of 2001 includes a $4.9 million pretax charge in connection with the closure of two facilities. In the first quarter of fiscal 2002, the Company’s results include a pretax charge of $4.0 million in connection with the closure of an additional plant. In the third and fourth quarters of 2002, the Company recorded pre-tax benefits of $1.6 million and $0.8 mil- lion, respectively, associated with the reversal of aforemen- tioned pretax charges related to plant closures. Also in the third quarter of 2002, the Company recognized a one-time tax benefit of $1.4 million. LIQUIDITY AND CAPITAL RESOURCES The Company has historically financed its operations and capi- tal requirements through cash flow from operating activities, long-term loans, lease financing and borrowings under domestic and international short-term lines of credit. In fiscal 2000, Entegris raised capital via an initial public offering. OPERATING ACTIVITIES. Cash flow provided by operating activi- ties totaled $32.9 million, $80.0 million and $64.1 million in fiscal 2002, 2001 and 2000, respectively. The decline in fiscal 2002 com- pared to the two previous years mainly reflects net earnings in 2002. In 2002, noncash charges, such as depreciation and amorti- zation of $28.2 million, as well as decreases in inventory of $8.4 million, accounts receivable of $3.8 million and refundable income taxes of $7.2 million, partly offset by a $21.7 million reduction in accounts payable and accruals, accounted for the cash flow provided by operations. Working capital stood at $177.1 million at August 31, 2002, including $74.8 million in cash and cash equivalents, and short-term investments of $44.6 million. INVESTING ACTIVITIES. Cash flow used in investing activities totaled $38.3 million, $110.1 million and $15.8 million in 2002, 2001 and 2000, respectively. Acquisition of property and equip- ment totaled $19.6 million, $24.2 million and $21.4 million in 2002, 2001 and 2000, respectively. Significant capital expenditures in 2002 included the expansion of the Company’s Gilroy, California facility, site of its cleaning service business and expenditures for manufacturing equipment and information systems. The Company expects capital expenditures of approximately $25 million during fiscal 2003, consisting mainly of spending on manufacturing equipment, tooling and information systems. Acquisition of businesses totaled $8.9 million and $43.0 million in 2002 and 2001, respectively. The Company completed two transactions in 2002. In August 2002, the Company acquired assets related to products serving the semiconductor tape and reel market for $2.0 million. Identifiable intangible assets, con- sisting principally of proprietary knowledge, of approximately $1.8 million were recorded in connection with the transaction.
- 25. ENTEGRIS, INC. AND SUBSIDIARIES 23 MANAGEMENT’S DISCUSSION AND ANALYSIS OF FINANCIAL CONDITION AND RESULTS OF OPERATIONS In February 2002, the Company purchased the 49% minority interests held in its Fluoroware Valqua Japan K.K. and Nippon Fluoroware K.K subsidiaries for total consideration of $5.2 mil- lion. Identifiable intangible assets of approximately $1.3 million were recorded in connection with the transaction. The Company made purchases, net of maturities, of $8.0 million and $36.6 million of debt securities classified as short-term investments in 2002 and 2001, respectively. Short-term invest- ments stood at $44.6 million at August 31, 2002. FINANCING ACTIVITIES. Cash provided by financing activities totaled $6.1 million, $2.0 million and $38.3 million in fiscal 2002, 2001 and 2000, respectively. The Company recorded proceeds of $5.5 million and $4.7 million in 2002 and 2001, respectively, in con- nection with common shares issued under the Company’s stock option and stock purchase plans. The Company made payments on short-term borrowings and long-term debt totaling $13.7 million in fiscal 2002, while proceeds from borrowings were $13.8 million. On July 11, 2000, Entegris completed a registered underwritten initial public offering (IPO), receiving net proceeds of $99.0 mil- lion after underwriting and issuance costs. A portion of the IPO proceeds was used to eliminate domestic short-term borrowings and retire $42 million in long-term debt and capital lease obligations. The Company repurchased common shares for $0.7 million and $10.4 million in 2001 and 2000, respectively. These shares were acquired in connection with the redemption of common stock from the Company’s Employee Stock Ownership Plan and, in 2001, the repurchase of 55,000 common shares as part of a 500,000 share repurchase authorization made by the Company’s board of directors in the first quarter of fiscal 2001. As of August 31, 2002, the Company’s sources of available funds comprised $74.8 million in cash and cash equivalents, $44.6 million in short-term investments and various credit facilities. Entegris has unsecured revolving credit commitments with two commercial banks with aggregate borrowing capacity of $20 million, with no borrowings outstanding at August 31, 2002 and lines of credit with seven international banks that provide for borrowings of currencies for our overseas subsidiaries, equivalent to an aggregate $13.4 million. Borrowings outstanding on these lines of credit were $8.9 million at August 31, 2002. The company also owed $0.5 million in other short-term bank borrowings not subject to formal credit agreements at August 31, 2002. At August 31, 2002, the Company’s shareholders’ equity stood at $322.1 million. Book value per share was $4.53, up from $4.48 per share at the end of fiscal 2001. The impact of net earnings and proceeds from the issuance of shares issued under the Company’s stock option and stock purchase plans was partly offset by a $4.2 million change in accumulated comprehensive income (loss) and the effect of additional common shares outstanding. The Company believes that its cash and cash equivalents, short- term investments, cash flow from operations and available credit facilities will be sufficient to meet its working capital and capital expenditure requirements for the next 12 months. However, future growth, including potential acquisitions, may require the Company to raise capital through additional equity or debt financ- ing. There can be no assurance that any such financing would be available on commercially acceptable terms. RECENTLY ISSUED ACCOUNTING PRONOUNCEMENTS In October 2001, the FASB issued SFAS No. 144, Accounting for the Impairment or Disposal of Long-Lived Assets, which addresses financial accounting and reporting for the impair- ment or disposal of long-lived assets. While SFAS No. 144 supersedes SFAS No. 121, it retains many of the fundamental provisions of that Statement. SFAS No. 144 becomes effective for the Company at the beginning of its fiscal year ended August 30, 2003. Adoption is not expected to have an impact on the Company’s results of operations or financial position. In June 2002, the FASB issued SFAS No. 146, Accounting for Costs Associated with Exit or Disposal Activities, which addresses accounting for restructuring and similar costs. SFAS No. 146 supercedes previous accounting guidance and is required for restructuring activities initiated after December 31, 2002. SFAS No. 146 requires the recognition of the liability for costs associated with exit or disposal activities as incurred, whereas previous accounting guidance required that a liability be record- ed when the Company committed to an exit plan. QUANTITATIVE AND QUALITATIVE DISCLOSURE ABOUT MARKET RISKS Entegris’ principal market risks are sensitivities to interest rates and foreign currency exchange rates. The Company’s current exposure to interest rate fluctuations is not significant. Most of its outstanding debt at August 31, 2002 carried fixed rates of interest. The Company’s cash equivalents and short- term investments are debt instruments with maturities of 12 months or less. A 10% change in interest rates would potentially increase or decrease net income by approximately $0.8 million. The Company uses derivative financial instruments to manage foreign currency exchange rate risk associated with the sale of products in currencies other than the U.S. dollar and was party to forward contracts with notional value of $1.7 million at August 31, 2002. The cash flows and earnings of foreign-based operations are also subject to fluctuations in foreign exchange rates. A hypothetical 10% change in the foreign currency ex- change rates would potentially increase or decrease net income by approximately $1 million. The Company’s investment in Metron common stock is accounted for as an available-for-sale security. The Company is exposed to fluctuations in the price of Metron stock. A 25% adverse change in Metron’s per share price would result in an approximate $1.1 million decrease in the fair value of the Company’s investment in Metron as of August 31, 2002. IMPACT OF INFLATION The Company’s financial statements are prepared on a historical cost basis, which does not completely account for the effects of inflation. Material and labor expenses are the Company’s pri- mary costs. The cost of polymers, its primary raw material, was essentially unchanged from one year ago. Entegris expects the cost of resins to remain stable in the foreseeable future. Labor costs, including taxes and fringe benefits, rose modestly in fiscal 2002. Moderate increases also can be reasonably anticipated for fiscal 2003.
- 26. 24 ENTEGRIS, INC. AND SUBSIDIARIES CONSOLIDATED BALANCE SHEETS (In thousands, except share data) August 31, 2002 August 25, 2001 ASSETS Current assets: Cash and cash equivalents $ 74,830 $ 74,451 Short-term investments 44,624 36,628 Trade accounts receivable, net of allowance for doubtful accounts of $1,798 and $1,608, respectively 35,371 36,303 Trade accounts receivable due from affiliates 4,219 7,171 Inventories 38,859 47,202 Deferred tax assets and refundable income taxes 16,039 10,424 Other current assets 2,793 7,858 Total current assets 216,735 220,037 Property, plant and equipment, net 102,104 109,131 Other assets: Investments 7,883 12,295 Intangible assets, less accumulated amortization of $9,423 and $5,968, respectively 61,604 61,903 Other 1,934 2,449 Total assets $ 390,260 $ 405,815 LIABILITIES AND SHAREHOLDERS’ EQUITY Current liabilities: Current maturities of long-term debt $ 2,144 $ 2,238 Short-term borrowings 9,421 8,813 Accounts payable 7,977 16,572 Accrued liabilities 20,079 33,630 Total current liabilities 39,621 61,253 Long-term debt, less current maturities 12,691 13,101 Deferred tax liabilities 15,802 14,087 Minority interest in subsidiaries 32 5,067 Commitments and contingent liabilities — — Total liabilities 68,146 93,508 Shareholders’ equity: Common stock, par value $.01; 200,000,000 shares authorized; issued and outstanding shares; 71,160,539 and 69,729,821, respectively 712 697 Additional paid-in capital 132,676 121,449 Retained earnings 190,932 188,156 Accumulated other comprehensive (loss) income (2,206) 2,005 Total shareholders’ equity 322,114 312,307 Total liabilities and shareholders’ equity $ 390,260 $ 405,815 See the accompanying notes to consolidated financial statements.
- 27. ENTEGRIS, INC. AND SUBSIDIARIES 25 CONSOLIDATED STATEMENTS OF OPERATIONS Years ended (In thousands, except per share data) August 31, 2002 August 25, 2001 August 26, 2000 Sales to non-affiliates $ 190,954 $ 239,771 $ 245,286 Sales to affiliates 28,877 102,673 98,179 Net sales 219,831 342,444 343,465 Cost of sales 131,125 179,774 183,023 Gross profit 88,706 162,670 160,442 Selling, general and administrative expenses 73,569 78,510 73,293 Engineering, research and development expenses 17,408 16,517 15,041 Nonrecurring charges 1,563 13,144 — Operating (loss) profit (3,834) 54,499 72,108 Interest (income) expense, net (1,466) (4,477) 2,422 Other income, net (973) (1,134) (4,945) (Loss) income before income taxes and other items below (1,395) 60,110 74,631 Income tax (benefit) expense (3,373) 21,339 26,754 Equity in net income of affiliates — (1,488) (1,694) Minority interest in subsidiaries’ net (loss) income (798) 1,643 489 Income before extraordinary item 2,776 38,616 49,082 Extraordinary loss on extinguishment of debt, net of taxes — — (1,149) Net income 2,776 38,616 47,933 Market value adjustment to redeemable common stock — — (48,602) Net income (loss) applicable to nonredeemable common shareholders $ 2,776 $ 38,616 $ (669) Earnings (loss) per nonredeemable common share: Basic Income before extraordinary item $ 0.04 $ 0.56 $ 0.01 Extraordinary loss on extinguishment of debt, net of taxes — — (0.03) Net income (loss) $ 0.04 $ 0.56 $ (0.02) Diluted Income before extraordinary item $ 0.04 $ 0.53 $ 0.01 Extraordinary loss on extinguishment of debt, net of taxes — — (0.03) Net income (loss) $ 0.04 $ 0.53 $ (0.02) See the accompanying notes to consolidated financial statements.
- 28. 26 ENTEGRIS, INC. AND SUBSIDIARIES CONSOLIDATED STATEMENTS OF SHAREHOLDERS’ EQUITY Accumulated Common Additional other Comprehensive shares Common paid-in Retained comprehensive income (In thousands) outstanding stock capital earnings income (loss) Total (loss) Balance at August 28, 1999 18,354 $ 184 $ 15,066 $ (33,022) $ (68) $ (17,840) Repurchase and retirement of shares (13) — — (89) — (89) Shares issued pursuant to stock option plans 76 — 362 — — 362 Dilution of ownership on investments — — — 2,163 — 2,163 Market value adjustment to redeemable ESOT common stock — — — (48,602) — (48,602) Reclassification of ESOT shares upon consummation of initial public offering 21,621 216 (108) 183,708 — 183,816 Shares issued pursuant to public offering, net of issuance costs 9,890 99 98,867 — — 98,966 Stock split adjustment 18,389 184 (184) — — — Foreign currency translation adjustment — — — — (63) (63) $ (63) Net unrealized gain on marketable securities — — — — 198 198 198 Net income — — — 47,933 — 47,933 47,933 Total comprehensive income $48,068 Balance at August 26, 2000 68,317 683 114,003 152,091 67 266,844 Repurchase and retirement of shares (77) (1) (476) (246) — (723) Shares issued pursuant to stock option plans 1,235 12 2,889 — — 2,901 Dilution of ownership on investments — — — (244) — (244) Reclassification associated with change in percentage ownership in Metron Technologies N.V. stock — — — (2,061) 2,698 637 Shares issued pursuant to employee stock purchase plan 255 3 1,620 — — 1,623 Tax benefit associated with employee stock plans — — 3,413 — — 3,413 Foreign currency translation adjustment — — — — (985) (985) $ (985) Net unrealized gain on marketable securities — — — — 225 225 225 Net income — — — 38,616 — 38,616 38,616 Total comprehensive income $37,856 Balance at August 25, 2001 69,730 697 121,449 188,156 2,005 312,307 Shares issued pursuant to stock option plans 1,222 12 3,959 — — 3,971 Shares issued in connection with acquisition 41 1 437 — — 438 Shares issued pursuant to employee stock purchase plan 168 2 1,540 — — 1,542 Tax benefit associated with employee stock plans — — 5,291 — — 5,291 Foreign currency translation adjustment — — — — (71) (71) $ (71) Net unrealized loss on marketable securities — — — — (4,140) (4,140) (4,140) Net income — — — 2,776 — 2,776 2,776 Total comprehensive income (loss) $ (1,435) Balance at August 31, 2002 71,161 $ 712 $ 132,676 $ 190,932 $ (2,206) $ 322,114 See the accompanying notes to consolidated financial statements.
- 29. ENTEGRIS, INC. AND SUBSIDIARIES 27 CONSOLIDATED STATEMENTS OF CASH FLOWS Years ended (In thousands) August 31, 2002 August 25, 2001 August 26, 2000 Operating activities: Net income $ 2,776 $ 38,616 $ 47,933 Adjustments to reconcile net income to net cash provided by operating activities: Depreciation and amortization 28,164 24,260 27,246 Asset impairment 1,136 3,526 5,937 Provision for doubtful accounts 133 (482) 1,493 Provision for deferred income taxes (791) (1,894) 382 Tax benefit from employee stock plans 5,291 3,413 — Equity in net income of affiliates — (1,488) (1,694) Loss on sale of property and equipment 185 956 811 Gain on sale of investment in affiliate — — (5,468) Minority interest in subsidiaries’ net (loss) income (798) 1,459 489 Changes in operating assets and liabilities: Trade accounts receivable 859 10,666 (9,620) Trade accounts receivable due from affiliates 2,952 15,632 (12,841) Inventories 8,373 (3,561) (2,015) Accounts payable and accrued liabilities (21,710) (369) 15,251 Other current assets 5,065 (2,748) 396 Income taxes payable and refundable income taxes 1,872 (6,546) (4,075) Other (646) (1,482) (96) Net cash provided by operating activities 32,861 79,958 64,129 Investing activities: Acquisition of property and equipment (19,568) (24,231) (21,376) Acquisition of businesses, net of cash acquired (8,943) (42,954) — Purchase of intangible assets (824) (10,701) (2,448) Proceeds from sales of property and equipment 1,300 3,464 713 Proceeds from sale of investment in affiliate — — 7,398 Purchases of short-term investments (90,200) (36,628) — Maturities of short-term investments 82,204 — — Other (2,302) 916 (76) Net cash used in investing activities (38,333) (110,134) (15,789) Financing activities: Principal payments on short-term borrowings and long-term debt (13,704) (2,679) (52,466) Proceeds from short-term borrowings and long-term debt 13,809 747 2,028 Issuance of common stock 5,514 4,674 99,179 Repurchase of redeemable and nonredeemable common stock — (723) (10,446) Net cash provided by financing activities 6,054 2,019 38,295 Effect of exchange rate changes on cash and cash equivalents 232 (365) (73) Increase (decrease) in cash and cash equivalents 379 (28,522) 86,562 Cash and cash equivalents at beginning of period 74,451 102,973 16,411 Cash and cash equivalents at end of period $ 74,830 $ 74,451 $ 102,973 Non-cash operating and investing activities: Transfer of common shares owned in affiliate in connection with termination of distribution agreement — $ 6,410 — See accompanying notes to consolidated financial statements.
- 30. 28 ENTEGRIS, INC. AND SUBSIDIARIES NOTES TO CONSOLIDATED FINANCIAL STATEMENTS (1) SUMMARY OF SIGNIFICANT ACCOUNTING POLICIES PRINCIPLES OF CONSOLIDATION AND BASIS OF PRESENTATION. Entegris, Inc. (the Company) is a leading provider of materials integrity management solutions that protect and transport the critical materials used in the semiconductor and other high technology industries. The accompanying consolidated financial statements include the accounts of the Company and its majori- ty-owned subsidiaries. Intercompany profits, transactions and balances have been eliminated in consolidation. Certain amounts reported in previous years have been reclassified to conform to the current year’s presentation. The Company’s fiscal year is a 52-week or 53-week period ending on the last Saturday in August. Fiscal years 2002, 2001 and 2000 ended on August 31, 2002, August 25, 2001 and August 26, 2000, respectively, and are identified herein as 2002, 2001 and 2000. CASH, CASH EQUIVALENTS AND SHORT-TERM INVESTMENTS. Cash and cash equivalents include cash on hand and highly liquid debt securities with original maturities of three months or less, which are valued at cost. Debt securities with original maturities greater than three months and remaining maturities of less than one year are classified and accounted for as held-to-maturity and recorded at amortized cost, and are included in short-term investments. The fair market value of short-term investments is essentially the same as amortized cost. INVENTORIES. Inventories are stated at the lower of cost or market. Cost is determined by the first-in, first-out (FIFO) method. PROPERTY, PLANT, AND EQUIPMENT. Property, plant and equip- ment are carried at cost and are depreciated principally on the straight-line method over the estimated useful lives of the assets. When assets are retired or disposed of, the cost and related accu- mulated depreciation are removed from the accounts, and gains or losses are recognized in the same period. Maintenance and repairs are expensed as incurred; significant additions and improvements are capitalized. Property, plant and equipment are reviewed for impairment whenever events or changes in circumstances indicate that the carrying amount of an asset may not be recoverable based on estimated future undiscounted cash flows. The Company recorded asset write-offs on molds and equipment of approximately $1.1 million, $3.5 million and $5.9 million for 2002, 2001 and 2000, respectively. All impairment losses are included in the Company’s cost of sales. INVESTMENTS. Substantially all of the Company’s equity invest- ments are marketable and are classified as available-for-sale. Accordingly, such securities are recorded at fair value, with any unrealized holding gains and losses, net of taxes, excluded from income, and recognized as a separate component of sharehold- ers’ equity. All equity investments are periodically reviewed to determine if declines in fair value below cost basis are other- than-temporary. Significant and sustained decreases in quoted market prices and a series of historical and projected operating losses by investees are considered in the review. If the decline in fair value is determined to be other-than-temporary, an impair- ment loss is recorded and the investment written down to a new cost basis. The Company’s nonmarketable investments are recorded at cost. GOODWILL AND OTHER INTANGIBLE ASSETS. Goodwill is the excess of the purchase price over the fair value of net assets of acquired businesses. Upon the adoption of Statement of Financial Accounting Standards (SFAS) No. 142, Goodwill and Other Intangible Assets in the first quarter of 2002, the Company no longer amortizes goodwill, but instead is required to test for impairment at least annually. See Note 6 for the pro forma effects of adopting this standard. Other intangible assets include, among other items, patents and unpatented technology and are amortized using the straight- line method over their respective estimated useful lives of 5 to 17 years. SFAS No. 142 requires that intangible assets with defi- nite useful lives be reviewed for impairment in accordance with SFAS No. 121, Accounting for the Impairment of Long-Lived Assets and for Long-Lived Assets to Be Disposed Of. DERIVATIVE FINANCIAL INSTRUMENTS. Effective August 27, 2000, the Company adopted SFAS No. 133, Accounting for Derivative Instruments and Hedging Activities, which requires companies to record derivatives on the balance sheet as assets or liabilities, measured at fair value. Changes in the fair value of derivatives are recorded each period in current earnings or other comprehensive income, depending on whether the deriva- tive is designated as part of a hedge transaction and, if it is, depending on the type of hedge transaction. Gains and losses on derivative instruments that are reported in other compre- hensive income will be recognized in the periods in which earnings are impacted by the variability of the cash flows of the hedged item. The Company periodically enters into forward foreign currency contracts to reduce exposures relating to rate changes in certain foreign currencies. Certain exposures to credit losses related to counterparty nonperformance exist, however, the Company does not anticipate nonperformance by the counter- parties as they are large, well-established financial institutions. None of these derivatives is accounted for as a hedge transac- tion under the provisions of SFAS No. 133. Accordingly, changes in the fair value of forward foreign currency contracts are recorded in current earnings. The fair values of the Company’s derivative financial instruments are based on prices quoted by financial institutions for these instruments. The Company was a party to forward foreign currency contracts with notional amounts of $1.7 million and $10.7 million at August 31, 2002 and August 25, 2001, respectively. FOREIGN CURRENCY TRANSLATION. Except for certain foreign subsidiaries whose functional currency is the United States (U.S.) dollar, assets and liabilities of foreign subsidiaries are translated from foreign currencies into U.S. dollars at current exchange rates. Income statement amounts are translated at the weighted average exchange rates for the year. Gains and losses resulting from foreign currency transactions are included in net income. For certain foreign subsidiaries whose functional cur- rency is the U.S. dollar, currency gains and losses resulting from translation are determined using a combination of current and historical rates and are reported as a component of net income.
- 31. ENTEGRIS, INC. AND SUBSIDIARIES 29 NOTES TO CONSOLIDATED FINANCIAL STATEMENTS REVENUE RECOGNITION/CONCENTRATION OF RISK. Revenue and the related cost of sales are generally recognized upon shipment of the products. The Company provides for estimated returns and warranty obligations when the revenue is recorded. The Company sells its products throughout the world primarily to companies in the microelectronics industry. The Company performs continuing credit evaluations of its customers and generally does not require collateral. Letters of credit may be required from its customers in certain circumstances. The Company maintains an allowance for doubtful accounts which management believes is adequate to cover any losses on trade receivables. Certain materials included in the Company’s products are obtained from a single source or a limited group of suppliers. Although the Company seeks to reduce dependence on those sole and limited source suppliers, the partial or complete loss of these sources could have at least a temporary adverse effect on the Company’s results of operations. Furthermore, a significant increase in the price of one or more of these components could adversely affect the Company’s results of operations. INCOME TAXES. Deferred income taxes are provided in amounts sufficient to give effect to temporary differences between finan- cial and tax reporting. The Company accounts for tax credits as reductions of income tax expense in the year in which such credits are allowable for tax purposes. The Company utilizes the asset and liability method for computing its deferred income taxes. Under the asset and liability method, deferred tax assets and liabilities are based on the temporary difference between the financial statement and tax basis of assets and liabilities and the enacted tax rates expected to apply to taxable income in the years in which these temporary differences are expected to be recovered or settled. The effect on deferred tax assets and liabilities of a change in tax rates is recognized in income in the period that includes the enactment date. ACCOUNTING ESTIMATES. The preparation of financial state- ments in conformity with accounting principles generally accepted in the United States requires management to make estimates and assumptions that affect the reported amounts of assets and liabilities and disclosure of contingent assets and liabilities at the date of the financial statements and the report- ed amounts of revenues and expenses during the reporting period. Actual results could differ from those estimates. STOCK-BASED COMPENSATION. The Company accounts for stock-based compensation under Accounting Principles Board (APB) Opinion No. 25, Accounting for Stock Issued to Employees. APB No. 25 requires compensation cost to be recorded on the date of the grant only if the current market price of the underlying stock exceeds the exercise price. The Company has adopted the disclosure-only provisions of SFAS No. 123, Accounting for Stock-based Compensation. COMPREHENSIVE INCOME (LOSS). Comprehensive income (loss) represents the change in shareholders’ equity resulting from other than shareholder investments and distributions. The Company’s foreign currency translation adjustments and unreal- ized gains and losses on marketable securities are included in accumulated comprehensive income. RECENT ACCOUNTING PRONOUNCEMENTS. In October 2001, the FASB issued SFAS No. 144, Accounting for the Impairment or Disposal of Long-Lived Assets, which addresses financial accounting and reporting for the impairment or disposal of long- lived assets. While SFAS No. 144 supersedes SFAS No. 121, it retains many of the fundamental provisions of that Statement. SFAS No. 144 becomes effective for the Company at the begin- ning of its fiscal year ending August 30, 2003. Adoption is not expected to have an impact on the Company’s results of opera- tions or financial position. In June 2002, the FASB issued SFAS No. 146, Accounting for Costs Associated with Exit or Disposal Activities, which address- es accounting for restructuring and similar costs. SFAS No. 146 supercedes previous accounting guidance and is required for restructuring activities initiated after December 31, 2002. SFAS No. 146 requires the recognition of the liability for costs associ- ated with exit or disposal activities as incurred, whereas previous accounting guidance required that a liability be recorded when the Company committed to an exit plan. (2) ACQUISITIONS The Company completed two transactions in 2002. In August 2002, the Company acquired assets related to products serving the semiconductor tape and reel market for $2.0 million. Identifiable intangible assets, consisting principally of propri- etary knowledge, of approximately $1.8 million was recorded in connection with the transaction. In February 2002, the Company purchased the 49% minority interests held in its Fluoroware Valqua Japan K.K. and Nippon Fluoroware K.K subsidiaries for total consideration of $5.1 million. Identifiable intangible assets of approximately $1.3 million were recorded in connection with the transaction. The Company completed four acquisitions in fiscal 2001. In March 2001, the Company acquired the fluid handling compo- nent product line of Nisso Engineering Co., Ltd. a Japanese company for $10.4 million. Patents and goodwill of approximately $2.3 million and $8.0 million, respectively, were recorded in connection with the transaction. In May 2001, the Company completed its acquisition of 100% of the common stock of NT International, which designs and manufactures patented ultra- high purity flow and pressure measurement sensors and controllers, for a cash payment of $27.5 million. Identifiable intangible assets, including patents, and goodwill of approxi- mately $18.5 million and $12.1 million, respectively, were recorded in connection with the transaction. In the fourth quar- ter of fiscal 2001, the Company completed the acquisition of 100% of the common stock of Atcor Corporation and the operating assets and liabilities of Critical Clean Solutions, Inc., which provide precision cleaning systems, products and services to the semiconductor industry, for consideration totaling $17.8 mil- lion, including cash payments of $16.0 million and $1.8 million, payable in common stock, in contingent consideration recorded in 2002. Identifiable intangible assets and goodwill of approxi- mately $7.6 million and $7.5 million, respectively, were recorded in connection with the transactions.