SlideShare uma empresa Scribd logo
1 de 11
Baixar para ler offline
After the Big Bang: Estimating the effects of decentralization on
educational outcomes in Indonesia through a difference-in-differences
analysis
Jane Leer 1,
*
Stanford Graduate School of Education, Stanford University, 485 Lasuen Mall, Stanford, CA 94305, United States
1. Introduction
Education policy makers around the world are faced with the
same question: should education be the responsibility of the
central government, or should education provision be decentra-
lized? Over the last several decades, decentralization has been one
of the most hotly debated policy issues affecting countries across
the income spectrum. Proponents of decentralization claim that
local stakeholders, who are less constrained by state bureaucracy
and more in touch with the local context, are better equipped to
provide education than central authorities. In this way, it is argued
that decentralization reforms have the potential to improve
student achievement by increasing schools’ efficiency, ensuring
that schools are more aligned with local educational needs and
preferences, and empowering local communities to hold schools
accountable for providing quality education (Barrera-Osorio et al.,
2009; Jimenez et al., 1986; World Bank, 2011).
Despite the proliferation of these reforms, the empirical
evidence of the capacity of decentralization to improve education-
al quality and equity is limited. To a certain extent, the lack of
consistency in the literature on decentralization is not surprising,
considering that decentralization relies on local resources and
institutional capacity, both of which vary significantly across
contexts. Despite the uneven nature of communities’ responses to
decentralization reforms, however, few studies have explored the
role of decentralization in perpetuating or alleviating educational
disparities.
My study explores the effects of decentralization on educational
outcomes in elementary and junior secondary schools in Indonesia.
Indonesia makes for an interesting case study of decentralization
for several reasons. The Indonesian public education sector has
gone from being one of the most highly centralized in the world to
one of the most decentralized. These reforms are often referred to
as ‘‘Big Bang Decentralization,’’ given the swiftness with which the
decentralization policies were enacted and the contrast they
pose to the country’s previously tightly centralized governance
structure (Chen, 2011). Decentralization occurred at the same
time as dramatic growth in primary and secondary enrollment.
Despite this expansion, however, regional and socioeconomic
disparities persist in both enrollment and achievement, particu-
larly at the secondary level (Arze del Granado et al., 2007; World
Bank, 2013). My study addresses the role of decentralization in
improving school quality and alleviating these disparities.
Leveraging school level data spanning fifteen years, I estimate
the effects of decentralization on school quality using a difference-
in-differences mode. Specifically, I compare before and after
International Journal of Educational Development 49 (2016) 80–90
A R T I C L E I N F O
Article history:
Received 1 November 2015
Received in revised form 15 February 2016
Accepted 19 February 2016
Keywords:
Decentralization
School-based management
Difference-in-differences
Teacher effort
Student achievement
Educational policy
A B S T R A C T
Proponents of decentralization argue that bringing decisions closer to the people improves school
quality and efficiency by ensuring that schools are more responsive to local educational needs. In
practice, the effects of decentralization vary substantially, given that the implementation of these
reforms relies on local resources and management capacity. In this paper, I estimate the effects of
decentralization on educational outcomes in Indonesia using a difference-in-differences model. I find no
overall effect on achievement, but a negative effect on teacher effort, particularly in rural areas and
among schools with inactive school committees.
ß 2016 Elsevier Ltd. All rights reserved.
* Corresponding author. Tel.: +1 7074974627.
E-mail address: jleer@alumni.stanford.edu
1
Current address: 2000 L St. NW, Suite 500, Washington, DC 20036,
United States.
Contents lists available at ScienceDirect
International Journal of Educational Development
journal homepage: www.elsevier.com/locate/ijedudev
http://dx.doi.org/10.1016/j.ijedudev.2016.02.005
0738-0593/ß 2016 Elsevier Ltd. All rights reserved.
changes in educational outcomes in Ministry of Education and
Culture (MoEC) schools to the analogous changes in outcomes in a
comparison group of schools that have always been decentra-
lized—private school1
. I find no effect of decentralization on math
and language achievement, although there is a weak negative
effect on math achievement among schools with inactive school
committees. I also measure the effects of decentralization on
teacher effort, as measured by the number of hours that teachers
spend in the classroom per week, and I find a negative effect,
particularly in rural areas and among schools with inactive school
committees. These findings contribute to the growing body of
literature challenging the assumption that decentralization
improves school quality. Given the global popularity of decentrali-
zation, it is essential that policy makers understand the mecha-
nisms through which these reforms can influence achievement,
and the resulting implications for educational equity. My findings
contribute to this understanding.
2. Theoretical and empirical background
At its most basic, decentralization refers to the devolution of
fiscal responsibility and decision-making power from the central
government to local authorities. In practice, of course, no education
system is completely centralized nor completely decentralized,
and a great deal of variation exists across school systems in terms
of the division of responsibilities between central and local
authorities. The policy debate revolves around the degree of fiscal
responsibility and decision-making power that should be decen-
tralized, and to whom authority should be granted at the local level
(e.g., provincial governments, district governments, school com-
mittees, or even private firms or individuals).
The assumption is that by reducing the role of the central
government, and allowing schools to operate in a quasi-market
framework, schools will be more flexible, innovative, and
responsive to local needs (Barrera-Osorio et al., 2009; Carnoy,
1999; Jimenez et al., 1986). In this sense, decentralization is one of
the market-based reforms that have dominated education
planning since the 1990s, especially among the development aid
community, where decentralization has been a favored policy item
on the ‘‘menu’’ of education reforms promoted by the World Bank
and other multilateral agencies (Mundy, 2007, 2002; Riddell,
1998). Indeed, the popularity of these reforms is here to stay: local
autonomy is one of the World Bank’s primary strategies for
strengthening education systems through 2020 (World Bank,
2011). In the following, I describe the theoretical assumptions
underlying decentralization and the empirical evidence of the
relationship between decentralization and educational outcomes.
First, decentralization is based on the assumption that bringing
decisions closer to the people improves the efficiency of the
education system. In the context of low and middle-income
countries, for example, decentralization may ensure that teachers
are paid on time via the introduction of a more direct payment
model, in which teachers are paid by district governments, rather
than central governments (Di Gropello and Marshall, 2009).
Similarly, by eliminating the bureaucratic ‘‘middle-man’’ role of
the central government, decentralization can ensure that schools
adapt more quickly to local educational needs and labor markets.
A second mechanism through which decentralization can
improve school quality is by strengthening the accountability
mechanisms between schools and communities. In countries like
Indonesia, where teacher absenteeism is common, increased
community monitoring (not to mention the possibility of
withholding pay) may serve as an incentive for improved teacher
performance (Asian Development Bank and OECD, 2015; Di
Gropello and Marshall, 2009).
Finally, a third reason for the popularity of decentralization is
the notion that these reforms will stimulate a shared sense of
responsibility for educational outcomes between teachers, princi-
pals, families, and community members (De Grauwe, 2005). It is
assumed that decentralization empowers communities to work
together to support schools; parents will promote students’
educational efforts at home and in school, families will visit
classrooms and help out with academic and extracurricular
activities, and community members and local businesses will
work together to ensure that schools are adequately supplied, for
example.
Empirically, the capacity of decentralization to meet these
assumptions is contested. Evidence from Chile suggests that
decentralization (in the form of state-subsidized privatization)
does not improve the overall efficiency of education provision
(McEwan and Carnoy, 2000). McEwan and Carnoy (2000) find that
the achievement gains in private (Catholic) schools are offset by
the higher cost of Catholic school education as compared to public
education. Thus, the relative efficiency of private schools and
public schools is similar. An additional threat to the assumption
that decentralization improves efficiency is the possibility of elite
capture of public funds (Bardhan, 2002). This is particularly
relevant in the context of Indonesia, widely recognized as one of
the most corrupt countries in the world (Suryadarma, 2012).
Indeed, Suryadarma (2012) finds that public spending in less
corrupt regions of Indonesia has a positive effect on enrollment,
while in more corrupt regions the relationship between public
education spending and enrollment is negligible. This suggests that
a significant portion of public funds in these more corrupt regions
never makes it to schools.
A growing body of research from Latin America and sub-
Saharan Africa focuses on the capacity of decentralization to
improve educational outcomes through school-based manage-
ment. Studies show that autonomous schools improve school
participation and student achievement vis-a`-vis increased paren-
tal involvement in schools (Duflo et al., 2014; Gertler et al., 2008;
Jimenez and Sawada, 2014, 1999) improved teacher effort
(Di Gropello and Marshall, 2009; Duflo et al., 2014), and increased
community-based investments in educational resources, such as
library books (Carnoy et al., 2008; King and Ozler, 2005). These
studies suggest that localized school governance can improve
school quality by strengthening the accountability mechanisms
between parents and schools, incentivizing teacher effort, and
engaging communities in school management.
However, community engagement is not automatic, and is
particularly problematic in rural or lower income contexts where
parents with low levels of education may not feel it is their role to
participate in school management, or may not be financially able to
dedicate the time required to participate (Gunnarsson et al., 2009;
King and Ozler, 2005; Meade and Gershberg, 2008). In this regard,
research from Mexico finds that the positive effects of a pilot
school-based management program largely disappeared when
the program was taken to scale (Santiban˜ez et al., 2014). Despite
positive effects of the pilot program, when implemented at scale
the school-based management program did not substantially
change parents’ involvement in school decision-making, even
though most parents reported being aware of their role in school
management.
Moreover, even when decentralization does increase parental
and community engagement in schools, parents, community
members and local authorities do not always make optimal school
1
By comparing differences in changes in achievement between MoEC and private
schools, rather than differences in absolute achievement levels, I account for time-
invariant differences between these two school types (such as the fact that private
schools are mostly Islamic, while MoEC schools are secular). The assumptions
underlying this difference-in-differences estimate are described in Section 5.
J. Leer / International Journal of Educational Development 49 (2016) 80–90 81
management decisions. In Honduras, for example, Di Gropello and
Marshall (2009) find that school councils are more likely than
central authorities to hire teachers with lower levels of experience
(and lower salary rates), which reduces the positive effect of school
autonomy on achievement.
Likewise, parental and community involvement in schools is
not always welcome. A recent randomized controlled trial
evaluation in Niger finds that school-based management increased
parental monitoring of teacher attendance, but teacher attendance
itself decreased (the program had no effect on student achieve-
ment) (Beasley and Huillery, 2014). The authors find that teachers
resent parental involvement in schools because it undermines
their authority as representatives of the central government. These
findings demonstrate the need to further explore the role of
decentralized school management and parental participation in
contexts where the education sector has historically been tightly
controlled by central authorities, or where parental involvement in
schools has traditionally been minimal (as is the case in Niger, as in
Indonesia) (Bjork, 2003; Parker and Raihani, 2011).
To a certain extent, the lack of consistency across studies of the
effects of decentralization and school-based management on
achievement is not surprising, considering that these policies rely
on local resources, management capacity, culture, and the political
will to self-manage, all of which vary substantially across contexts.
Given the heterogeneous nature of communities’ responses to
decentralization, these reforms have the potential to increase
educational disparities between schools. Conversely, if the
assumptions of decentralization hold, and local authorities are
better able to ensure school quality, then decentralization could
reduce the achievement gap between urban and rural schools, or
high-income and low-income schools, for example. Few studies
have addressed this issue empirically.
Research from Bolivia and Colombia points to the latter
hypothesis—suggesting that decentralization can enable poorer
districts to catch up to their wealthier neighbors. Faguet (2004)
and Faguet and Sa´nchez (2008) find that municipal authorities are
more likely than the central government to invest in education
where the need is greatest (e.g., where enrollment levels are
lowest, or where illiteracy rates are highest). In turn, municipal
education investments under decentralization are associated with
increased enrollment in these more vulnerable localities. Research
from Argentina paints a different picture, however. Galiani et al.
(2008) find that the devolution of school governance to provincial
authorities has a positive effect on test scores on average, but not
among schools located in poor municipalities. Likewise, in an
experimental study from The Gambia, Blimpo et al. (2015) find that
local capacity (as measured by average district level adult literacy)
moderates the effect of school-based management on educational
outcomes. The authors estimate that a minimum of 45 percent
adult literacy is needed for school-based management to affect
learning outcomes (Blimpo et al., 2015).
In sum, existing research suggests that decentralization can
improve educational outcomes, but only when local governments,
communities and schools have the resources and political will to
self-manage. The assumption that autonomy will automatically
improve efficiency and quality is problematic in practice.
However, despite the uneven nature of communities’ responses
to decentralization, few studies outside of Latin America have
assessed the impact of nationwide decentralization policies on
educational quality and equity. My study addresses this gap by
estimating the effects of decentralization on achievement and
teacher effort in Indonesia. In order to further unpack the
mechanisms through which decentralization can affect educa-
tional equity, I explore how these effects vary across urban and
rural locations and according to the degree of community
engagement in school management.
3. Decentralization in Indonesia
Indonesia provides a unique case study for testing the
theoretical assumptions of decentralization, not only because
the Indonesian education system is the fourth largest education
system in the world (World Bank, 2015), but also given the
country’s experience of rapid decentralization coupled with
persistent regional and socioeconomic disparities in both attain-
ment and achievement (Asian Development Bank and OECD,
2015).
Basic education in Indonesia consists of six years of elementary
school and three years of junior secondary school. Responsibility
for basic education falls under the authority of two sectors:
84 percent of schools are governed by the Ministry of Education
and Culture (MoEC); while the remaining 16 percent of schools are
governed by private community foundations (mostly Islamic
foundations), which are overseen at the national level by the
Ministry of Religious Affairs (MORA) (Asian Development Bank and
OECD, 2015). Since the 1970s, the Indonesian government has
made strides toward the unification of these two systems, namely
through the 1976 decree which made Islamic schools responsible
for teaching the national curriculum in addition to the traditional
religious curriculum. In practice, however, private schools,
particularly private Islamic schools, lag behind MoEC schools in
terms of overall school infrastructure quality, teacher qualifica-
tions, school completion, and achievement (Raihani, 2013). MoEC
and private schools also differ in terms of governance. Despite
receiving varying degrees of government funding, private schools,
by definition, operate largely autonomously from the central
government. MoEC school governance, on the other hand, was
highly centralized until 2001 when the decentralization process
began (Raihani, 2013).
Decentralization emerged in response to the political turmoil
and economic crisis of the late 1990s, which put a severe strain on
the legitimacy and fiscal power of the central government. In
2001 the central government transferred administrative and fiscal
responsibility for health and secular education to district govern-
ments. Under these reforms, district governments are responsible
for teacher salaries, general school operational costs, and most
aspects of school management (Raihani, 2007). Districts cover
about 60 percent of school finance, the central government
provides 35 percent, and provinces cover the remaining 5 percent
(Arze del Granado et al., 2007). District spending is primarily
limited to nondiscretionary routine expenditures (e.g., teachers’
salaries), while the central government maintains responsibility
for development expenditures (e.g., school construction) (Arze del
Granado et al., 2007).
School-based management followed decentralization in 2003,
when the government mandated the role of school committees in
educational planning and supervision (Bandur, 2009). In Indone-
sia’s version of school-based management, school governance
responsibility is primarily delegated to principals, who are
expected to work in collaboration with school committees
comprised of teachers, parents, and community members who
are elected by the community. Officially, school committees have
the authority to set the school’s mission and vision, determine
learning standards, raise school funds, develop extra-curricular
activities, contribute to the development of localized curriculum,
encourage linkages between schools and external organizations,
allocate non-salary components of the school budget, and hire
non-contract teachers (Bandur, 2009).
Following decentralization in the MoEC system, the govern-
ment passed a series of sector-wide reforms directed at all schools,
including private schools. First, the Education Act of 2003 officially
declared all citizens’ right to tuition-free basic education. To
facilitate this law, the government launched a massive grant
J. Leer / International Journal of Educational Development 49 (2016) 80–9082
program, the Bantuan Operasional Sekolah (BOS) (Raihani, 2007). As
of 2005, almost all MoEC and private elementary and junior
secondary schools receive annual BOS grants, which are deter-
mined on a per-pupil basis and distributed directly to schools
(Barrera-Osorio et al., 2009). BOS funds are meant to cover routine
expenditures such as student registration, textbooks, extra-
curricular activities, student examination fees, teacher develop-
ment and training, remuneration of honorary (non-permanent)
teachers, and learning materials (Arze del Granado et al., 2007).
Additional legislation passed in 2005 defined national stan-
dards in the following seven areas: content, process, graduate
competency, teacher qualifications, school facilities, funding, and
assessment (Asian Development Bank and OECD, 2015). The
implementation of these national standards has been slow,
however. As of 2009, only 38 percent of primary school teachers
and 73 percent of junior secondary school teachers met the
minimum education requirements of a four-year college degree
(Raihani, 2013). Resource shortage and teacher absenteeism
have also been persistent concerns, particularly in rural areas,
where on any given school day up to 50 percent of teachers are
likely to be absent (Asian Development Bank and OECD, 2015).
Indeed, the educational disparities in Indonesia are well docu-
mented. Junior secondary school enrollment rates among rural and
lower-income communities lag behind urban and wealthier
communities by as much as 50 percent (Arze del Granado et al.,
2007). There are also significant socioeconomic and urban/rural
gaps in achievement (Raihani, 2007), and the difference in the
quality of educational resources between high-income and low-
income schools, and between urban and rural schools, is one of the
largest among all PISA-participating countries (OECD, 2013).
Descriptive studies indicate that there have been significant
challenges to the implementation of decentralization and school-
based management in practice. Efforts to train and support
communities in establishing the necessary accountability mecha-
nisms have been minimal (SMERU, 2006). A nationally represen-
tative survey of primary school communities finds that over
80 percent of parents do not participate in school improvement
activities, such as helping in the classroom or serving on classroom
committees, and 30 percent had never talked to their child’s
teacher (Chen, 2011). Lack of parental awareness about school-
based management policies, lack of clarity in the central
government’s guidelines for decentralization, and low levels of
local capacity impede school leaders’ ability to implement
decentralization (Amirrachman et al., 2008; Bandur, 2012a; Chen,
2011; Kristiansen and Pratikno, 2006; Yeom et al., 2002). Thus,
despite the rhetoric of community engagement, the current system
emphasizes top-down supervision and monitoring, vis-a`-vis
district school inspection visits, for example, rather than
bottom-up pressure from parents and community members
(Amirrachman et al., 2008; Chen, 2011). This is partly explained
by the fact that, parents – particularly those with lower levels of
education – feel it is not their place to intervene in school affairs,
given that this role has historically been limited to authority
figures (Parker and Raihani, 2011). Similarly, participation in
school management is difficult for low-income parents who must
take time away from wage-earning activities to attend school
committee meetings and visit schools (Parker and Raihani, 2011).
Far from stimulating local democracy and shared decision-
making power, in some cases decentralization has empowered
local interest groups to increase their control over community
resources, leading to the perception among rural parents and
teachers that decentralization will result in competition between
wealthy, well-connected, urban schools and their poorer rural
counterparts (Amirrachman et al., 2008; Kristiansen and Pratikno,
2006). Opinions diverge, however. A case study of the Ngada
Educational District, for example, finds that over 90 percent of
teachers, parents and school leaders believe that student
achievement has improved as a result of decentralized manage-
ment (Bandur, 2012b; Bandur and Gamage, 2009).
Several studies suggest that decentralization has played a role
in exacerbating educational disparities in Indonesia. Toi (2010), for
example, finds that school budgets and teacher qualifications
decreased among poor schools following decentralization, but
remained largely stable among wealthier schools. Arze del
Granado et al. (2007) demonstrate that although regional
(between-province) disparities in primary and secondary school
enrollment have decreased since decentralization, between-
district disparities increased from 1998 to 2004, likely linked to
the transfer of educational spending responsibilities from the
central to district level. My research builds on these studies by
empirically testing the effect of decentralization on school
quality—namely, student achievement and teacher effort,
and exploring how these effects are shaped by community
characteristics.
4. Data
My dataset contains information on 2561 MoEC schools and
1251 private schools from the Indonesian Family Life Survey (IFLS),
an ongoing longitudinal panel survey conducted by the RAND
Corporation in collaboration with the University of California, Los
Angeles (UCLA) and Lembaga Demografi, University of Indonesia2
.
I use all available waves of the IFLS survey: the IFLS 1, collected
in 1993/4, the IFLS 2, collected in 1997/8, the IFLS 3, collected in
2000/1, and the IFLS 4, collected in 2007/8. The IFLS data are
representative of about 83 percent of the Indonesian population,
spanning 13 of Indonesia’s 27 provinces (Frankenberg et al.,
1995)3
.
The school level data in the IFLS are representative of the
schools available to the households in the sample communities. In
each wave of the IFLS, three elementary schools and three junior
secondary schools were randomly selected from a list of existing
schools based on information provided by surveyed households
and village leaders in each community. The total number of MoEC
and private schools observed each year is relatively consistent, at
around 1200 MoEC schools and 500 private schools each year
(see Table 1). Although the data are not explicitly intended to be
panel data, about 70 percent of schools are observed more than
once, particularly in smaller communities, where the likelihood of
Table 1
School observations per year.
1993/1994 1998/1999 2000/2001 2007/2008
Ministry of Education
& Culture (MoEC)
1208 1201 1267 1277
Private schools 454 510 547 477
2
Private schools in this analysis are classified as such if the school organizer is
listed as a private foundation or the Ministry of Religious Affairs (MoRA). MoRA
serves as the top authority on the Islamic curriculum and provides varying degrees
of funding to Islamic schools, but the ministry itself plays a limited role in school
governance, as MoRA schools have always operated in a decentralized fashion
(Raihani, 2013; UNESCO, 2010). MoEC schools are classified as such if the school
organizer is listed as the Ministry of Education and Culture (MoEC) or District Office
of Education schools. As a robustness check, I conduct two separate difference-in-
differences analyses, one in which I restrict the comparison group sample to include
only MoRA schools, and one in which I restrict the comparison group sample to
include only private foundation schools. The results of both analyses are consistent
with the reported results.
3
Provinces were selected to maximize population representation and capture
Indonesia’s cultural and socioeconomic diversity. See Frankenberg et al. (1995) for
more information.
J. Leer / International Journal of Educational Development 49 (2016) 80–90 83
being randomly selected from the community roster is greater. I
conduct my analysis on the full sample of 1951 elementary schools
and 1861 junior secondary schools as well as the balanced panel
sample of 365 elementary schools and 414 junior secondary
schools observed at baseline (2000) and post-decentralization
(2007)4
. The final sample is presented in Table 2.
My primary outcome variable is student achievement, defined as
school mean performance on math and Indonesian Bahasa language
test scores from the Indonesian National Exam, Ujan Nacional (UAN).
The UAN (previously called the EBTANAS) is a standardized test that
is mandatory for all students in the last year of primary school, junior
secondary,andseniorsecondaryschool.Althoughthetestitemshave
undergone some changes in the period from 1993 to 2007, UAN
scoring has remained relatively constant (Asian Development Bank
and OECD, 2015). Moreover, these changes affect both MoEC and
private schools equally(the testisthe samefor both sectors).Assuch,
these minor changes do not threaten the internal validity of my
estimate. However, students’eligibility for the next levelof schooling
is determined on the basis of UAN scores, which makes the UAN a
high stakes exam (Asian Development Bank and OECD, 2015). This
poses a potential threat to the validity of this construct as a proxy of
achievement, since students and teachers have an incentive to
manipulate scores.
For each school-by-year observation, I observe the math and
language test scores of a randomly selected sample of 25 students
in grade six for each primary school and grade nine for each junior
secondary school5
. For ease of interpretation, and in order to
account for potential differences in scoring across years and school
levels, I standardize test scores by year and school level6
. I report
both math and language test scores, but the math score is likely a
more reliable estimate of achievement, given Indonesia’s linguistic
diversity (Bahasa is the language of instruction in Indonesia, but a
large percentage of students speak a different language at home)
(Raihani, 2013). The school level IFLS data does not include
information on the percent of students at each school for whom
Bahasa is a second language.
My second outcome of interest is teacher effort, as measured by
the average number of hours per week that teachers spend in the
classroom, standardized within each year. As of 2013, only
44 percent of teachers teach the minimum number of hours
required (Asian Development Bank and OECD, 2015). Thus,
teachers’ hours spent in the classroom are a reasonable proxy of
teacher effort in Indonesia. Likewise, teacher absenteeism is one
aspect of school quality that is expected to improve through
community monitoring under school-based management (Bandur,
2012a). For each school in the first three waves of the IFLS, I have
information on self-reported hours spent teaching for two
randomly selected teachers (one math teacher and one Bahasa
language teacher). The 2007 survey collected information on only
one teacher (math or Bahasa language teacher). Thus, these data
are not necessarily representative of the average teacher at each
school. However, since many schools in my sample have only one
math and language teacher per grade level, most of the teachers
interviewed taught the students for whom I have test scores, which
makes these data a meaningful representation of the quality of
teaching at the schools in my sample.
5. Identification strategy
In order to estimate a causal relationship between decentraliza-
tion and educational outcomes I need to identify what educational
outcomes in MoEC schools would have been in the absence of
decentralization. In an ideal world, my counterfactual would be a
‘‘control’’ group of schools that did not implement decentralization,
but that are otherwise identical to the ‘‘treatment’’ group of schools
that did implement decentralization. This would require an
experimental research design, in which ‘‘treatment’’ and ‘‘control’’
is randomly assigned to a group of schools that have similar
characteristics at baseline. However, decentralization was not
randomly assigned in Indonesia. Rather, these reforms were
implemented universally among MoEC schools. Thus, I rely on a
quasi-experimental method, in which I compare trends in educa-
tional outcomes among MoEC schools to trends in educational
outcomes among a comparison group of schools that were not
affected by the decentralization reforms: private schools.
Specifically, I use a difference-in-differences model to estimate
the effects of decentralization on student achievement and teacher
effort. In this model, I compare changes in educational outcomes
before and after decentralization among MoEC schools to changes
in outcomes before and after decentralization among private
schools. MoEC schools serve as the ‘‘treatment’’ group, and
private schools represent the ‘‘control group.’’ By comparing
changes between these two groups, I control for observed and
unobserved time invariant characteristics as well as time-varying
factors common to both groups that might be correlated with both
decentralization and educational outcomes. The change in the
comparison group of private schools is an estimate of the
counterfactual; or in other words, how outcomes in MoEC schools
would have changed in the absence of decentralization.
The estimation equation is as follows:
yscjt ¼ a þ b1MOECscj þ b2Postt þ b3 MOECscjÂPostt
À Á
þ X0
scjt þ Z0
cjt
þ mt þ vj
where:
 yscjt is the average outcome (student achievement or teacher
effort) for school s in community c, district j and year t;
 MOECscj is an indicator variable that takes the value of 1 if the
school is a MoEC school;
 Postt is an indicator variable equal to 1 for all observations after
decentralization (e.g., all observations in 2007 wave of the IFLS);
 X’scjt is a vector of time variant school characteristics (the
number of recorded test scores and teacher’s education);
 Z’cjt is a vector of time variant community characteristics (the
community’s urban/rural classification and the number of
households in the community)7
;
Table 2
Sample composition.
Elementary schools Junior secondary schools
Full sample Balanced panel Full sample Balanced panel
MoEC Private MoEC Private MoEC Private MoEC Private
1608 343 321 44 953 908 280 134
4
Observations with missing data on achievement and school characteristics,
schools listed as ‘‘other (e.g., not MoRA, foundation or MoEC), and schools with
inconsistent information regarding school type (e.g., schools classified as MoEC in
one year and MoRA in another year) restricts my sample from 7547 school-by-year
observations to 6918 school-by-year observations.
5
20 percent of school-by-year observations include test scores for less than
25 students. I control for the number of tests recorded per school-by-year
observation in all models.
6
Scores are standardized after having restricted my sample to include only
treatment (MoEC) and control (private) observations.
7
Given that the data span 15 years, communities’ urban/rural classification is
time variant. By including schools’ urban/rural classification in my model, I account
for time variant factors that might be associated with both urbanization and
achievement, such as population growth and economic development.
J. Leer / International Journal of Educational Development 49 (2016) 80–9084
mt is pre-treatment year fixed effect (a binary variable equal to
1 for observations in 1993/4 and 1998/9);
 vj are district fixed effects;
 ps represents school fixed effects; and
 escjt is the idiosyncratic error term.
The causal variable of interest is b3, the interaction between the
time period of decentralization and the binary variable indicating
whether or not MoEC administers the school. The coefficient on
this term represents the difference in outcomes before and after
decentralization between MoEC and private schools. b1 represents
the pre-decentralization difference in outcomes between MoEC
and private schools, and b2 represents the difference in outcomes
post-decentralization that is common to all schools.
This model estimates the effect of six years of fiscal and
administrative decentralization and four years of school-based
management in MoEC schools. Since 2005, however, both private
schools and MoEC schools have received annual block grants
through the BOS program, which are contingent on the formation
of a school committee. In practice, this aspect of the BOS program
has been weakly monitored, particularly among private schools,
which are already governed by community level associations
(SMERU, 2006). Regardless, it is possible that the BOS program
encouraged private schools to adopt some aspects of school-based
management. Therefore, the treatment contrast I observe
in 2007 is the effect of switching from centralized management
to decentralized management including four years of exposure
to school-based management among MoEC schools, relative to
always being decentralized plus two years of exposure to school-
based management among private schools. In this way, my study
moves beyond previous studies by isolating the effects of changes
in governance from the provision of additional inputs that
accompany these reforms. Since both private schools and MoEC
schools benefit equally from the BOS funds, any changes I find
among MoEC schools can be attributed to changes in school
governance, rather than increased school inputs8
.
6. Results
In the following sections I compare educational outcomes
between MoEC and private schools before and after decentraliza-
tion. I find no overall effect of decentralization on math and
language achievement and no evidence of heterogeneous effects
according to the school’s urban/rural location. However, I find a
weak negative effect on math achievement among schools with
inactive school committees. I also explore the effect of decentrali-
zation on teacher effort, and I find a negative effect on the number
of hours that teachers spend in the classroom, particularly in
schools located in rural communities and schools with inactive
school committees.
6.1. Achievement
Figs. 1 and 2 present mean standardized math and language
achievement scores from 1993 to 2007. From 1993 to 1999, the
difference in achievement between private and MoEC schools is
relatively consistent. Math achievement among MoEC schools
increased slightly from 1993 to 2000, and then decreased slightly
from 2000 to 2007. In private schools, math achievement
decreased from 1993 to 2000 and increased slightly from
2000 to 2007. Language achievement, meanwhile, remained
relatively constant from 1993 to 2007 in both MoEC and private
schools.
Tables 3 and 4 respectively present the difference-in-differ-
ences estimate of the effect of decentralization on math and
language achievement, for the combined sample and separately for
elementary and junior secondary schools. I report the estimates
conducted with the full sample and the balanced panel sample. The
balanced panel sample is more representative of schools from
small, rural communities, where schools are more likely to be
observed more than once. However, unlike the full sample, the
balanced panel estimate is free from any bias caused by schools
entering and leaving the sample. The coefficient of interest, the
interaction between being a MoEC school in the post-treatment
period, is given in the first row (Post  MoEC). For both math and
language achievement, the overall effect of decentralization is
negative but not statistically significant.
6.2. Teacher effort
Teacher effort, as measured by the number of hours per week
that teachers spend in the classroom, increased from 31 to almost
35 h in MoEC elementary schools from 1993 to 2000 and then
decreased slightly to about 31 h per week in 2007. Teachers at
Fig. 1. Trends in math achievement from 1993 to 2007. Note: Data presented are
from the full sample.
Fig. 2. Trends in language achievement from 1993 to 2007. Note: Data presented are
from the full sample
8
One threat to the validity of my difference-in-differences model is the
possibility that decentralization resulted in selective migration from private
schools to MoEC schools (or vice-a-versa), especially if the per-student funding
nature of the BOS program encouraged schools to compete for students. I discuss
this and other threats to internal validity in Section 6.4.
J. Leer / International Journal of Educational Development 49 (2016) 80–90 85
private elementary schools, meanwhile, spent around 30 h in the
classroom per week consistently from 1993 to 2007. At the junior
secondary level, both MoEC and private school teachers increased
the amount of time spent in the classroom from between 20 and
24 h from 1993 to 2000, to about 28 h in 2007. Table 5 and Fig. 3
present these trends.
The difference-in-differences estimate of the effect of decen-
tralization on teacher effort is presented in Table 6. In the
combined sample of elementary and junior secondary schools, I
find a negative effect on hours spent in the classroom, in the
magnitude of 0.3 standard deviations, only significant in the
balanced panel sample. This represents about two fewer hours per
week spent in MoEC classrooms.
6.3. Heterogeneous effects
I examine heterogeneous effects across two school character-
istics. First, considering the educational disparities between urban
Table 3
Estimated effect of decentralization on math achievement.
Elementary Junior secondary Total
Full sample Balanced panel Full sample Balanced panel Full sample Balanced panel
Post  MoEC 0.096 À0.195 À0.121 À0.163 À0.071 À0.188
(0.401) (0.482) (0.165) (0.186) (0.149) (0.168)
Constant 0.731 1.488 À0.160 0.085 0.466*
1.367**
(0.468) (0.920) (0.428) (1.179) (0.265) (0.600)
Observations 3529 730 3389 828 6918 1558
R-squared 0.722 0.634 0.751 0.713 0.730 0.661
Robust standard errors in parentheses. All models include school and district fixed effects as well as the following time variant school and community covariates: teachers’
education, the number of test scores recorded per school, the community’s urban/rural classification, and the total number of households in the community. Models
conducted with the full sample include pre-treatment year fixed effects.
***
p  0.01, **
p  0.05, *
p  0.1.
Table 4
Estimated effect of decentralization on language achievement.
Elementary Junior secondary Total
Full sample Balanced panel Full sample Balanced panel Full sample Balanced panel
Post  MoEC À0.190 À0.230 0.0179 0.008 À0.075 À0.107
(0.175) (0.271) (0.140) (0.164) (0.102) (0.136)
Constant 0.232 0.796 À0.197 1.399 0.109 1.056*
(0.704) (0.736) (0.418) (0.905) (0.363) (0.570)
Observations 3529 730 3389 828 6918 1558
R-squared 0.744 0.697 0.770 0.742 0.752 0.708
Robust standard errors in parentheses. All models include school and district fixed effects as well as the following time variant school and community covariates: teachers’
education, the number of test scores recorded per school, the community’s urban/rural classification, and the total number of households in the community. Models
conducted with the full sample include pre-treatment year fixed effects.
***
p  0.01, **
p  0.05, *
p  0.1.
Table 5
Teacher effort (hours in the classroom per week), by school type and year.
Elementary schools
1993/1994 1998/1999 2000/2001 2007/2008
MoEC Mean 31.318 33.147 34.485 30.770
SD 5.660 8.002 6.532 6.183
Private Mean 30.679 30.904 30.038 30.507
SD 8.746 9.798 9.778 7.831
Junior secondary schools
1993/1994 1998/1999 2000/2001 2007/2008
MoEC Mean 22.628 22.413 24.229 28.382
SD 5.832 5.931 7.094 8.433
Private Mean 20.429 21.45 21.941 27.068
SD 7.833 8.130 8.581 10.017
Note: Data presented are from the full sample.
Fig. 3. Trends in teacher effort from 1993 to 2007.
J. Leer / International Journal of Educational Development 49 (2016) 80–9086
and rural schools in Indonesia (Asian Development Bank and OECD,
2015), I split the sample according to the baseline urban/rural
classification of the community within which schools are located.
Second, in order to explore the role of school committees in
implementing decentralization and school-based management, I
divide the sample into two groups according to the number of
times per year that school committees meet. This information is
based on principal-reported data from the 2007 IFLS survey. On
average, school committees meet four times per year. I define
school committees as highly active if the committee meets six or
more times per year and inactive if the committee meets two or
fewer times per year. Eighteen percent of MoEC schools observed
in 2007 have highly active school committees and 33 percent have
inactive school committees. To maintain statistical precision, I
conduct both sub-group analyses on the combined sample of
elementary and junior secondary schools.
I find no evidence of a heterogeneous effect on achievement by
school location. In terms of teacher effort, however, I find large a
negative effect on teacher effort in rural schools, in the magnitude
of À0.457 standard deviations, significant at the ten percent level.
This represents almost three fewer hours per week spent in the
classroom. Table 7 presents these results.
I find slight evidence of a negative effect of decentralization on
math achievement among schools with an inactive school
committee (see Table 8). These effects are present in the full
sample and balanced panel sample, but are less robust to the
inclusion of school fixed effects9
. The effects on teacher effort
among schools with inactive school committees, on the other hand,
are large and robust to the inclusion of school fixed effects
(see Table 9). The effect on teacher effort is larger among inactive
school committees than it is among rural schools, representing
around 3 fewer teaching hours per week. There is no effect of
decentralization on achievement or teacher effort among schools
with highly active school committees.
6.4. Robustness checks
The internal validity of these estimates relies on the assumption
that changes in outcomes in private schools provide an unbiased
estimate of how outcomes would have changed in MoEC schools
(Angrist and Pischke, 2009). At face value, the validity of this
assumption seems potentially spurious, given the visual differ-
ences in trends between MoEC and private schools evident in
Figs. 1 and 2. While I cannot directly test this assumption, I perform
several robustness checks to address potential sources of bias.
Table 6
Estimated effect of decentralization on teacher effort.
Elementary Junior secondary Total
Full sample Balanced panel Full sample Balanced panel Full sample Balanced panel
Post  MoEC À0.229 À0.344 0.0833 À0.026 À0.243 À0.316**
(0.187) (0.317) (0.192) (0.205) (0.154) (0.154)
Constant 0.747**
0.820 À1.096*
À2.728**
À0.039 À0.914
(0.321) (0.764) (0.621) (1.170) (0.303) (0.798)
Observations 3506 725 3375 826 6881 1551
R-squared 0.667 0.620 0.681 0.589 0.731 0.594
Robust standard errors in parentheses. All models include school and district fixed effects as well as the following time variant school and community covariates: teachers’
education, the number of test scores recorded per school, the community’s urban/rural classification, and the total number of households in the community. Models
conducted with the full sample include pre-treatment year fixed effects.
***
p  0.01, **
p  0.05, *
p  0.1.
Table 7
Heterogeneous effects of decentralization by school location.
Math achievement Language achievement Teacher effort
Urban Rural Urban Rural Urban Rural
Post  MoEC À0.205 0.0679 À0.122 À0.069 À0.141 À0.457*
(0.172) (0.193) (0.133) (0.168) (0.210) (0.238)
Constant 0.813**
0.158 0.441 À0.311 À0.126 0.0625
(0.380) (0.320) (0.414) (0.436) (0.657) (0.388)
Observations 4335 2583 4335 2583 4317 2564
R-squared 0.777 0.635 0.793 0.676 0.740 0.741
Robust standard errors in parentheses. All models use the full sample and include pre-treatment year fixed effects, school fixed effects and district fixed effects as well as the
following time variant school and community covariates: teachers’ education, the number of test scores recorded per school, and the total number of households in the
community.
***
p  0.01, **
p  0.05, *
p  0.1.
Table 8
Effects of decentralization on math achievement among schools with inactive
school committees.
Full sample Balanced panel
Model 1 Model 2 Model 3 Model 4
Post  MoEC À0.270**
À0.334 À0.297**
À0.367*
(0.113) (0.200) (0.132) (0.212)
Constant À0.789***
0.466 À0.465 0.456
(0.220) (0.505) (0.288) (0.728)
Observations 1302 1302 502 502
R-squared 0.110 0.611 0.156 0.637
School FE No Yes No Yes
Robust standard errors in parentheses. All models include district fixed effects as
well as the following time variant school and community covariates: teachers’
education, the number of test scores recorded per school, the community’s urban/
rural classification, and the total number of households in the community. Models
conducted with the full sample include pre-treatment year fixed effects.
***
p  0.01, **
p  0.05, *
p  0.1
9
School fixed effects account for time-invariant differences between schools that
could confound the treatment estimate. As such, models with school fixed effects
provide the most robust estimate (but also the most conservative estimate).
J. Leer / International Journal of Educational Development 49 (2016) 80–90 87
One way to examine the internal validity of a difference-in-
differences model is to ensure that the treatment effect does not
precede the implementation of treatment. To do so, I set an
artificial ‘‘baseline’’ and ‘‘post-treatment’’ year to 1998 and 2000,
respectively, and conduct the same difference-in-differences
estimate. The presence of a statistically significant ‘‘effect’’ of this
artificial treatment would indicate that any effect I find in 2007 is
confounded by changes in MoEC schools that began prior to
decentralization. Table 10 presents the results of this robustness
check. I find no evidence of an artificial treatment effect prior to
decentralization.
A second potential source of bias stems from the presence of
omitted time variant factors that vary uniquely between MoEC and
private schools at the onset of decentralization. One way this could
happen is if schools were selected for decentralization based on
location-specific, time-varying information. This is unlikely,
however, given that decentralization was implemented universal-
ly in all MoEC schools and my comparison group is a set of schools
that have always been decentralized. A second way in which
omitted time variant factors could bias the difference-in-differ-
ences estimate is through changes in policies or environmental
factors that affect MoEC schools differently than private schools,
such as the 2004 Indian Ocean tsunami and subsequent relief
efforts. This is also unlikely, however, given that both types of
schools are located in the same districts and communities, such
that changes in policies and environmental factors that affect one
group are just as likely to affect the other group. In addition, I
include covariates at the community and school level in order to
address possible bias from time-variant shocks affecting educa-
tional outcomes.
A third threat to internal validity arises from the possibility of
selective migration. If wealthier families responded to decentrali-
zation by switching their children from MoEC schools to private
schools, the difference-in-differences estimate would be under-
estimated by changes in the socioeconomic composition of
students. Likewise, it is possible that decentralization increased
enrollment in MoEC schools among children from lower socioeco-
nomic groups who were previously excluded from the school
system. This would also underestimate the treatment effect. Using
IFLS household survey data from the same communities for which I
have school level data, I test for (but do not report) a difference-in-
differences effect of decentralization on a proxy of students’
socioeconomic status: parents’ mean years of education. The
coefficient of the treatment effect of decentralization on mean
parental years of education in MoEC schools is negative, suggesting
that student migration from MoEC to private schools may partially
explain the jump in achievement observed in private schools. The
coefficient is not statistically significant, however.
In addition, in the years since SBM was launched, the
Indonesian government has received support from the World
Bank and the United States Agency for International Development
(among other donors) to implement pilot programs directed at
strengthening the capacity of school committees to improve the
implementation of SBM (Heyward and Cannon, 2011; Vernez,
2012). If schools in my sample also participated in these donor-
supported pilot programs this would upwardly bias my estimate,
but I cannot identify schools that participated in these programs.
However, given the small size of my sample, as well as the small
size of the donor-funded pilot programs, it is unlikely that more
than a few (if any) schools from my sample received this extra
support.
7. Discussion
Decentralization reforms have figured prominently in the
policy landscape for the last several decades and will likely
continue to do so for years to come. The results of my study
highlight the tenuous link between decentralization and school
quality in contexts where the education sector has historically
been tightly managed by the central government. I find no effect of
decentralization on math and language achievement, although
there is a weak negative effect on math achievement among
schools with inactive school committees. I also explore the effect of
decentralization on teacher effort, and I find a significant negative
effect on the number of hours that teachers spend in the classroom,
particularly in schools located in rural communities and in schools
with inactive school committees.
My findings challenge the assumption that decentralization
improves school quality by making schools more accountable to
local communities. There are several explanations for this discon-
nect. First, it could be that local authorities perform worse (or
at least, no better) than the central government. This interpretation
would suggest that district and school level authorities make poor
Table 9
Heterogeneous effects of decentralization by school committee engagement.
Math achievement Language achievement Teacher effort
Inactive SC Active SC Inactive SC Active SC Inactive SC Active SC
Post  MoEC À0.334 0.322 À0.228 0.308 À0.535**
À0.427
(0.200) (0.477) (0.149) (0.390) (0.237) (0.725)
Constant 0.466 2.231 À0.373 0.201 À0.300 À0.740
(0.505) (1.467) (0.711) (1.429) (0.457) (1.143)
Observations 1302 306 1302 306 1292 305
R-squared 0.611 0.688 0.706 0.723 0.644 0.649
Robust standard errors in parentheses. All models use the full sample and include pre-treatment year fixed effects, school fixed effects and district fixed effects as well as the
following time variant school and community covariates: teachers’ education, the number of test scores recorded per school, the community’s urban/rural classification, and
the total number of households in the community.
***
p  0.01, **
p  0.05, *
p  0.1.
Table 10
Pre-decentralization artificial ‘‘treatment’’ effect.
Full sample
Model 1 Model 2
Post  MoEC 0.021 0.035
(0.067) (0.073)
Constant 0.036 0.537**
(0.155) (0.232)
Observations 4895 4895
R-squared 0.115 0.827
School FE No Yes
Robust standard errors in parentheses. Both models include a pre-treatment year
dummy variable for 1993/4 and control for district effects, the number of completed
tests recorded for each school, the school’s urban/rural location, and the number of
households in the community.
***
p  0.01, **
p  0.05, *
p  0.1.
J. Leer / International Journal of Educational Development 49 (2016) 80–9088
school management decisions or are uninterested in supporting
education.
A more likely explanation is that my findings reflect the result of
incomplete decentralization. In this regard, a null effect of
decentralization on achievement provides empirical evidence to
support the descriptive claims that decentralization has done little
to change what happens in the classroom (Bjork, 2003; Yeom et al.,
2002). This is aligned with what Amirrachman et al. (2008) refer to
as ‘‘centralized decentralization’’, in which educational governance
remains top-town, despite the rhetoric of community participa-
tion. An important question emerges from these findings: what
does it take to achieve complete decentralization in contexts with
low – or heterogeneous – levels of local resources and manage-
ment capacity? Can decentralization ever be complete in these
contexts?
The null effect on achievement may also be explained by the
timing of my analysis. I examine schools six years after the
implementation of fiscal and administrative decentralization and
four years after the implementation of school-based management.
The effects of these major policy reforms on achievement may take
more than several years to identify. However, I do find negative
effects on a potential mediator of the relationship between
decentralization and achievement: the number of hours that
teachers spend in the classroom per week. This indicates that local
communities have not assumed the responsibility for teacher
supervision and support. It may also be the case that school
committees do not have the authority to supervise teacher effort.
Indeed, qualitative evidence suggests that principals and district
education boards maintain all real authority over school gover-
nance, while school committees serve a superficial ‘‘rubber stamp’’
role in signing school budgets once a year (Kristiansen and
Pratikno, 2006; SMERU, 2006).
It is also possible that the negative effect on teachers’ time spent
in the classroom is caused by an increase in the number of teachers
that work in each school. If this is the case, it may be that
decentralization had no effect on the total number of teaching
hours available to students, despite the fact that individual
teachers spend less time in schools. A simple analysis of trends
over time suggests that the number of teachers per school
has indeed grown steadily over time in both MoEC and private
schools (from an average of 18 teachers per school in 1993 to 25 in
2007 in both groups). However, I find no difference-in-differences
effect of decentralization on the number of teachers per school.
Likewise, although my model meets the standard robustness
checks of difference-in-differences models, the IFLS data are not
representative of private schools and MoEC schools nationwide.
Given the jump in achievement that private schools in my sample
experienced from 2000 to 2007, it could be that the provision of
BOS funds affected these schools differently than private schools
and MoEC schools nationwide. Future research should explore how
the utilization of these funds differs between these groups.
Together, my findings contribute to the emerging body of
research illustrating the limits of decentralization in resource-
constrained settings, such as in rural schools in Indonesia. Like
Galiani et al. (2008), I find evidence that decentralization can
further the gap between advantaged and disadvantaged commu-
nities—the negative effect on teachers’ time spent in the classroom
is more than 50 percent greater in rural schools than in urban
schools (and only statistically significant in rural schools). Like
Jimenez and Sawada (2014) and Di Gropello and Marshall (2009),
my findings highlight the importance of engaging communities in
school management—I find a slight negative effect of decentrali-
zation on math achievement and a large negative effect on teacher
effort among schools with inactive school committees. However, I
cannot rule out the possibility that differences between active and
inactive school committees are primarily driven by differences in
parents’ socioeconomic capacity to participate in school manage-
ment. Future research is needed to isolate the effects of engaging
parents in school management in this context.
Rather than ruling out the potential of decentralization to
improve school quality, my findings remind policymakers that
autonomy is not synonymous with knowledge or empowerment.
To be effective, decentralization should be accompanied by efforts
to ensure that local communities know how to assess school
quality and have the resources and political will to do so. This will
require further research about how decisions are made at the
school level, in addition to research that explores how to encourage
communities to collaboratively support school quality, above and
beyond providing operational funds.
A second area for future research has to do with the relationship
between decentralization and other aspects of school quality—
namely, access. My findings apply to students who are enrolled
through junior secondary school, but the most vulnerable children
in Indonesia are those who remain excluded from the education
system. Future studies should explore how localized school
governance affects not just achievement but enrollment, drop
out, and transitions.
Acknowledgements
This research was made possible through grants from the David
and Susan Douglass 1979 Family Fellowship, the International and
Comparative Education Masters of Arts fund (Stanford University),
and the Freedman Spogli Institute for International Studies. I am
grateful to have received invaluable support and guidance from
Martin Carnoy, Christine Min Wotipka, Luana Marotta, Prashant
Loyalka, Nancy Dye Leer and two anonymous reviewers.
References
Asian Development Bank, OECD, 2015. Education in Indonesia. OECD Publishing,
Paris.
Amirrachman, A., Syafi’i, S., Welch, A., 2008. Decentralising Indonesian
education: the promise and the price. World Stud. Educ. 9, 31–53.
Angrist, J.D., Pischke, J.S., 2009. Mostly Harmless Econometrics: An Empiricist’s
Companion. Princeton University Press, Princeton.
Arze del Granado, J., Fengler, W., Ragatz, A., Yavuz, E., 2007. Investing in
Indonesia’s education: allocation, equity, and efficiency of public
expenditures. In: Working Paper No. No. 4372. Munich Personal RePEc
Archive  The World Bank.
Bandur, A., 2012a. School-based management developments: challenges and
impacts. J. Educ. Admin. 50, 845–873, http://dx.doi.org/10.1108/
09578231211264711.
Bandur, A., 2012b. School-based management developments and partnership:
evidence from Indonesia. Int. J. Educ. Dev. 32, 316–328, http://dx.doi.org/
10.1016/j.ijedudev.2011.05.007.
Bandur, A., 2009. The implementation of school-based management in
Indonesia: creating conflicts in regional levels. J. of NTT Stud. 1, 16–27.
Bandur, A., Gamage, D.T., 2009. SBM policies and programs: improving teaching-
learning environments and student achievements in Indonesia. Educ. Soc.
27, 51–75, http://dx.doi.org/10.7459/es/27.1.04.
Bardhan, P., 2002. Decentralization of governance and development. J. Econ.
Perspect. 16, 185–205.
Barrera-Osorio, F., Fasih, T., Patrinos, H.A., Santiban˜ez, L., 2009. Decentralized
Decision-Making in Schools: The Theory and Evidence on School-Based
Management. The World Bank.
Beasley, E., Huillery, E., 2014. Willing but unable: short-term experimental
evidence on parent empowerment and school quality. In: Working
Paper)Abdul Latif Jameel Poverty Action Lab.
Bjork, C., 2003. Local Responses to decentralization policy in Indonesia. Comp.
Educ. Rev. 47, 184–216, http://dx.doi.org/10.1086/376540.
Blimpo, M.P., Evans, D.K., Lahire, N., 2015. Parental human capital and effective
school management: evidence from The Gambia (conference paper). In: RISE
Conference 2015, Research on Improving Systems in Education (RISE).
Carnoy, M., 1999. Globalization and Education Reform: What Planners Need to
Know. International Institute for Educational Planning (IIEP), UNESCO.
Carnoy, M., Gove, A.K., Loeb, S., Marshall, J.H., Socias, M., 2008. How schools and
students respond to school improvement programs: the case of Brazil’s PDE.
Econ. Educ. Rev. 27, 22–38, http://dx.doi.org/10.1016/
j.econedurev.2006.04.005.
J. Leer / International Journal of Educational Development 49 (2016) 80–90 89
Chen, D., 2011. School-based management, school decision-making and
education outcomes in Indonesia primary schools. In: World Bank Policy
Research Working PaperWorld Bank.
De Grauwe, A., 2005. Improving the quality of education through school-based
management: learning from international experiences. Int. Rev. Educ. 51,
269–287, http://dx.doi.org/10.1007/s11159-005-7733-1.
Di Gropello, E., Marshall, J.H., 2009. Decentralization and educational
performance: evidence from the PROHECO Community School Program in
rural Honduras. Educ. Econ. 19, 161–180, http://dx.doi.org/10.1080/
09645290902992816.
Duflo, E., Dupas, P., Kremer, M., 2014. School governance, teacher incentives, and
pupil–teacher ratios: experimental evidence from Kenyan primary schools.
In: No. No. 17939), NBER Working Paper. National Bureau of Economic
Research.
Faguet, J.-P., 2004. Does decentralization increase government responsiveness to
local needs?: evidence from Bolivia. J. Public Econ. 88, 867–893, http://
dx.doi.org/10.1016/S0047-2727(02)00185-8.
Faguet, J.-P., Sa´nchez, F., 2008. Decentralization’s effects on educational
outcomes in Bolivia and Colombia. World Dev. 36, 1294–1316, http://
dx.doi.org/10.1016/j.worlddev.2007.06.021.
Frankenberg, E., Karoly, L.A., Gertler, P., Achmad, S., Agung, L.G.N., Hatmadji, S.H.,
Sudharto, P., 1995. The 1993 Indonesian Family Life Survey: Overview and
Field Report.
Galiani, S., Gertler, P., Schargrodsky, E., 2008. School decentralization: helping
the good get better, but leaving the poor behind. J. Public Econ. 92, 2106–
2120, http://dx.doi.org/10.1016/j.jpubeco.2008.05.004.
Gertler, P., Patrinos, H., Rubio-Codina, M., 2008. Empowering parents to improve
education: evidence from rural Mexico. In: Impact Evaluation Series Number
4. World Bank Policy Research Working Paper 3935. World Bank
Publications, 1818 H Street NW; Washington, DC 20433.
Gunnarsson, V., Orazem, P.F., Sa´nchez, M.A., Verdisco, A., 2009. Does local school
control raise student outcomes? Evidence on the roles of school autonomy
and parental participation. Econ. Devel. Cult. Change 58, 25–52, http://
dx.doi.org/10.1086/604704.
Heyward, M., Cannon, R.A., 2011. Implementing school-based management in
Indonesia. RTI Press, http://dx.doi.org/10.3768/rtipress.2011.op.0006.1109.
Jimenez, E., Psacharopoulos, G., Jee-Peng, T., 1986. Financing education in
developing countries: an exploration of policy options. In: No. 8226. The
World Bank.
Jimenez, E., Sawada, Y., 2014. Does community management help keep children
in schools? Evidence Using Panel Data from El Salvador’s EDUCO Program.
Economic Development and Cultural Change 62, 307–338, http://dx.doi.org/
10.1086/674096.
Jimenez, E., Sawada, Y., 1999. Do community-managed schools work? An
evaluation of El Salvador’s EDUCO Program. World Bank Econ. Rev. 13,
415–441.
King, E., Ozler, B., 2005. What’s decentralization got to do with learning? School
autonomy  student performance. In: Interfaces for Advanced Economic
AnalysisKyoto University.
Kristiansen, S., Pratikno, 2006. Decentralising education in Indonesia. Int. J. Educ.
Dev. 26, 513–531, http://dx.doi.org/10.1016/j.ijedudev.2005.12.003.
McEwan, P.J., Carnoy, M., 2000. The effectiveness and efficiency of private
schools in Chile’s voucher system. Educ. Eval. Policy Anal. 22, 213–239,
http://dx.doi.org/10.3102/01623737022003213.
Meade, B., Gershberg, A.I., 2008. Making education reform work for the poor:
accountability and decentralization in Latin America. J. Educ. Policy 23, 299–
322, http://dx.doi.org/10.1080/02680930801923823.
Mundy, K., 2007. Global governance, educational change. Comp. Educ. 43, 339–
357, http://dx.doi.org/10.1080/03050060701556281.
Mundy, K., 2002. Retrospect and prospect: education in a reforming World Bank.
Int. J. Educ. Dev. 22, 483–508.
OECD, 2013. PISA 2012 Results: Excellence through Equity: Giving Every Student
the Chance to Succeed (Volume II). OECD Publishing, Paris.
Parker, L., Raihani, R., 2011. Democratizing Indonesia through education?
Community participation in Islamic schooling. Educ. Manage. Admin.
Leadersh. 39, 712–732, http://dx.doi.org/10.1177/1741143211416389.
Raihani, 2013. In: Routledge (Eds.), Creating Multicultural Citizens: A Portrayal
of Contemporary Indonesian Education. first ed. Routledge, New York, NY.
Raihani, 2007. Education reforms in Indonesia in the twenty-first century. Int.
Educ. J. 8, 172–183.
Riddell, A., 1998. Reforms of educational efficiency and quality in developing
countries. Compare 28, 277–291.
Santiban˜ez, L., Abreu-Lastra, R., O’Donoghue, J.L., 2014. School based
management effects: resources or governance change? Evidence from
Mexico. Econ. Educ. Rev. 39, 97–109, http://dx.doi.org/10.1016/
j.econedurev.2013.11.008.
SMER. (Eds.), 2006. A Rapid Appraisal of the PKPS-BBM Education Sector:
School Operational Assistance (BOS) Program 2005, SMERU Research Report.
SMERU Research Institute, Jakarta.
Suryadarma, D., 2012. How corruption diminishes the effectiveness of public
spending on education in Indonesia. Bull. Indonesian Econ. Stud. 48, 85–100,
http://dx.doi.org/10.1080/00074918.2012.654485.
Toi, A., 2010. An empirical study of the effects of decentralization in Indonesian
junior secondary education. Educ. Res. Policy Pract. 9, 107–125, http://
dx.doi.org/10.1007/s10671-010-9081-6.
UNESCO, 2010. World Data on Education: Indonesia (No. VII Ed.) UNESCO—
International Bureau of Education.
Vernez, G., 2012. Implementation of school-based management in Indonesia.
RAND, Santa Monica, CA.
World Bank, 2015. World Bank and Education in Indonesia. International Bank
for Reconstruction and Development/The World Bank, Indonesia.
World Bank, 2013. Local Governance and Education Performance: A Survey of
the Quality of Local Education Governance in 50 Indonesian Districts, East
Asia and Pacific Region, Human Development. World Bank, Jakarta,
Indonesia.
World Bank, 2011. Learning for All: Investing in People’s Knowledge and Skills
to Promote Development, Education Strategy 2020. World Bank,
Washington, DC.
Yeom, M., Acedo, C., Utomo, E., 2002. The reform of secondary education in
Indonesia during the 1990s: basic education expansion and quality
improvement through curriculum decentralization. Asia Pac. Educ. Rev. 3,
56–68.
J. Leer / International Journal of Educational Development 49 (2016) 80–9090

Mais conteúdo relacionado

Mais procurados

Urban Student Mobility in Chicago
Urban Student Mobility in ChicagoUrban Student Mobility in Chicago
Urban Student Mobility in ChicagoLara Fordis
 
Salinas roselia_the_national_challenge_of_teacher_quality_and_student_achiev...
Salinas  roselia_the_national_challenge_of_teacher_quality_and_student_achiev...Salinas  roselia_the_national_challenge_of_teacher_quality_and_student_achiev...
Salinas roselia_the_national_challenge_of_teacher_quality_and_student_achiev...William Kritsonis
 
Addressing student variability in educational design
Addressing student variability in educational designAddressing student variability in educational design
Addressing student variability in educational designAlan Bruce
 
Apa style dissertation why does effective leadership make a difference in hig...
Apa style dissertation why does effective leadership make a difference in hig...Apa style dissertation why does effective leadership make a difference in hig...
Apa style dissertation why does effective leadership make a difference in hig...CustomEssayOrder
 
Dr. William Allan Kritsonis & Steven Norfleet
Dr. William Allan Kritsonis & Steven NorfleetDr. William Allan Kritsonis & Steven Norfleet
Dr. William Allan Kritsonis & Steven Norfleetguestfa49ec
 
National Implications: The Impact of Teacher Graduate Degrees on Student Math...
National Implications: The Impact of Teacher Graduate Degrees on Student Math...National Implications: The Impact of Teacher Graduate Degrees on Student Math...
National Implications: The Impact of Teacher Graduate Degrees on Student Math...William Kritsonis
 
Petterway arthur_a_national_perspective___a_mixed_methods_analysis_of_the_im...
Petterway  arthur_a_national_perspective___a_mixed_methods_analysis_of_the_im...Petterway  arthur_a_national_perspective___a_mixed_methods_analysis_of_the_im...
Petterway arthur_a_national_perspective___a_mixed_methods_analysis_of_the_im...William Kritsonis
 
Ej1092658
Ej1092658Ej1092658
Ej1092658ruathai
 
Loretta terry doctoral forum
Loretta terry doctoral forumLoretta terry doctoral forum
Loretta terry doctoral forumWilliam Kritsonis
 
A comparative study of public versus private primary schools,
A comparative study of public versus private primary schools,A comparative study of public versus private primary schools,
A comparative study of public versus private primary schools,Alexander Decker
 
Williams, Monica National Focus On Postmodernism In Higher Education
Williams, Monica National Focus On Postmodernism In Higher EducationWilliams, Monica National Focus On Postmodernism In Higher Education
Williams, Monica National Focus On Postmodernism In Higher EducationWilliam Kritsonis
 

Mais procurados (14)

Urban Student Mobility in Chicago
Urban Student Mobility in ChicagoUrban Student Mobility in Chicago
Urban Student Mobility in Chicago
 
Salinas roselia_the_national_challenge_of_teacher_quality_and_student_achiev...
Salinas  roselia_the_national_challenge_of_teacher_quality_and_student_achiev...Salinas  roselia_the_national_challenge_of_teacher_quality_and_student_achiev...
Salinas roselia_the_national_challenge_of_teacher_quality_and_student_achiev...
 
Addressing student variability in educational design
Addressing student variability in educational designAddressing student variability in educational design
Addressing student variability in educational design
 
Apa style dissertation why does effective leadership make a difference in hig...
Apa style dissertation why does effective leadership make a difference in hig...Apa style dissertation why does effective leadership make a difference in hig...
Apa style dissertation why does effective leadership make a difference in hig...
 
Eunetra Ellison-Simpson
Eunetra Ellison-SimpsonEunetra Ellison-Simpson
Eunetra Ellison-Simpson
 
Ej1080685
Ej1080685Ej1080685
Ej1080685
 
Dr. William Allan Kritsonis & Steven Norfleet
Dr. William Allan Kritsonis & Steven NorfleetDr. William Allan Kritsonis & Steven Norfleet
Dr. William Allan Kritsonis & Steven Norfleet
 
The development of inclusive education management model: Practical guidelines...
The development of inclusive education management model: Practical guidelines...The development of inclusive education management model: Practical guidelines...
The development of inclusive education management model: Practical guidelines...
 
National Implications: The Impact of Teacher Graduate Degrees on Student Math...
National Implications: The Impact of Teacher Graduate Degrees on Student Math...National Implications: The Impact of Teacher Graduate Degrees on Student Math...
National Implications: The Impact of Teacher Graduate Degrees on Student Math...
 
Petterway arthur_a_national_perspective___a_mixed_methods_analysis_of_the_im...
Petterway  arthur_a_national_perspective___a_mixed_methods_analysis_of_the_im...Petterway  arthur_a_national_perspective___a_mixed_methods_analysis_of_the_im...
Petterway arthur_a_national_perspective___a_mixed_methods_analysis_of_the_im...
 
Ej1092658
Ej1092658Ej1092658
Ej1092658
 
Loretta terry doctoral forum
Loretta terry doctoral forumLoretta terry doctoral forum
Loretta terry doctoral forum
 
A comparative study of public versus private primary schools,
A comparative study of public versus private primary schools,A comparative study of public versus private primary schools,
A comparative study of public versus private primary schools,
 
Williams, Monica National Focus On Postmodernism In Higher Education
Williams, Monica National Focus On Postmodernism In Higher EducationWilliams, Monica National Focus On Postmodernism In Higher Education
Williams, Monica National Focus On Postmodernism In Higher Education
 

Destaque (9)

IT strategy for e-learning
IT strategy for e-learning IT strategy for e-learning
IT strategy for e-learning
 
sotc-activity-book-web
sotc-activity-book-websotc-activity-book-web
sotc-activity-book-web
 
Yapi 61 dükkan sunum
Yapi 61 dükkan sunumYapi 61 dükkan sunum
Yapi 61 dükkan sunum
 
Eureka grupo 8 - presentación
Eureka   grupo 8 - presentaciónEureka   grupo 8 - presentación
Eureka grupo 8 - presentación
 
Eureka grupo 8 - presentación
Eureka   grupo 8 - presentaciónEureka   grupo 8 - presentación
Eureka grupo 8 - presentación
 
Question 4
Question 4Question 4
Question 4
 
Eureka grupo 8 - presentación
Eureka   grupo 8 - presentaciónEureka   grupo 8 - presentación
Eureka grupo 8 - presentación
 
Valores espirituales
Valores espiritualesValores espirituales
Valores espirituales
 
Trends Shaping Education 2016
Trends Shaping Education 2016Trends Shaping Education 2016
Trends Shaping Education 2016
 

Semelhante a Leer After the Big Bang 2016

Making Schools Inclusive.pptx
Making Schools Inclusive.pptxMaking Schools Inclusive.pptx
Making Schools Inclusive.pptxjjCalonge1
 
Three dimension of Index-A-UNIFYING-FRAMEWORK.pptx
Three dimension of Index-A-UNIFYING-FRAMEWORK.pptxThree dimension of Index-A-UNIFYING-FRAMEWORK.pptx
Three dimension of Index-A-UNIFYING-FRAMEWORK.pptxJonathanParaisoCruz
 
Jorge Cimentada- Master's thesis
Jorge Cimentada- Master's thesisJorge Cimentada- Master's thesis
Jorge Cimentada- Master's thesisJorge Cimentada
 
Eunetra Ellison Simpson, PhD Proposal Defense, Dr. William Allan Kritsonis, D...
Eunetra Ellison Simpson, PhD Proposal Defense, Dr. William Allan Kritsonis, D...Eunetra Ellison Simpson, PhD Proposal Defense, Dr. William Allan Kritsonis, D...
Eunetra Ellison Simpson, PhD Proposal Defense, Dr. William Allan Kritsonis, D...William Kritsonis
 
Vibrant Schools Project - The Learning Tree
Vibrant Schools Project - The Learning TreeVibrant Schools Project - The Learning Tree
Vibrant Schools Project - The Learning TreeSue Smith
 
comparative education; meaining, defiation, aim, purpose, (TASNEEMKHOKHAR1280...
comparative education; meaining, defiation, aim, purpose, (TASNEEMKHOKHAR1280...comparative education; meaining, defiation, aim, purpose, (TASNEEMKHOKHAR1280...
comparative education; meaining, defiation, aim, purpose, (TASNEEMKHOKHAR1280...Tasneem Ahmad
 
Collaborative leadership in an era of the new normal done (nfeasj)
Collaborative leadership in an era of the new normal done (nfeasj)Collaborative leadership in an era of the new normal done (nfeasj)
Collaborative leadership in an era of the new normal done (nfeasj)William Kritsonis
 
Loretta A. Terry & Dr. William Kritsonis
Loretta A. Terry & Dr. William KritsonisLoretta A. Terry & Dr. William Kritsonis
Loretta A. Terry & Dr. William KritsonisWilliam Kritsonis
 
The Effects Of Parental Involvement On Public Schools
The Effects Of Parental Involvement On Public SchoolsThe Effects Of Parental Involvement On Public Schools
The Effects Of Parental Involvement On Public SchoolsDenise Enriquez
 
EDD614ASSIGNMENTCASE2Trident International University .docx
EDD614ASSIGNMENTCASE2Trident International University .docxEDD614ASSIGNMENTCASE2Trident International University .docx
EDD614ASSIGNMENTCASE2Trident International University .docxbudabrooks46239
 
TextbookInformation Governance Concepts, Strategies and Best P.docx
TextbookInformation Governance Concepts, Strategies and Best P.docxTextbookInformation Governance Concepts, Strategies and Best P.docx
TextbookInformation Governance Concepts, Strategies and Best P.docxarnoldmeredith47041
 
Preparing Your PresentationBobby Franklin, Ph. D. Michele Mo.docx
Preparing Your PresentationBobby Franklin, Ph. D. Michele Mo.docxPreparing Your PresentationBobby Franklin, Ph. D. Michele Mo.docx
Preparing Your PresentationBobby Franklin, Ph. D. Michele Mo.docxharrisonhoward80223
 
Putting a Price on Education - The Cost of Marketisation in Australian Schooling
Putting a Price on Education - The Cost of Marketisation in Australian SchoolingPutting a Price on Education - The Cost of Marketisation in Australian Schooling
Putting a Price on Education - The Cost of Marketisation in Australian SchoolingTravis Robinson
 
Essay On Superintendent
Essay On SuperintendentEssay On Superintendent
Essay On SuperintendentAnn Johnson
 
TURNAROUND SCHOOLS AND ONLINE LEARNING 1 .docx
TURNAROUND SCHOOLS AND ONLINE LEARNING       1 .docxTURNAROUND SCHOOLS AND ONLINE LEARNING       1 .docx
TURNAROUND SCHOOLS AND ONLINE LEARNING 1 .docxturveycharlyn
 
TURNAROUND SCHOOLS AND ONLINE LEARNING 1 .docx
TURNAROUND SCHOOLS AND ONLINE LEARNING       1 .docxTURNAROUND SCHOOLS AND ONLINE LEARNING       1 .docx
TURNAROUND SCHOOLS AND ONLINE LEARNING 1 .docxwillcoxjanay
 

Semelhante a Leer After the Big Bang 2016 (20)

Making Schools Inclusive.pptx
Making Schools Inclusive.pptxMaking Schools Inclusive.pptx
Making Schools Inclusive.pptx
 
CLA assignment
CLA assignmentCLA assignment
CLA assignment
 
Three dimension of Index-A-UNIFYING-FRAMEWORK.pptx
Three dimension of Index-A-UNIFYING-FRAMEWORK.pptxThree dimension of Index-A-UNIFYING-FRAMEWORK.pptx
Three dimension of Index-A-UNIFYING-FRAMEWORK.pptx
 
Jorge Cimentada- Master's thesis
Jorge Cimentada- Master's thesisJorge Cimentada- Master's thesis
Jorge Cimentada- Master's thesis
 
E2102637
E2102637E2102637
E2102637
 
Eunetra Ellison Simpson, PhD Proposal Defense, Dr. William Allan Kritsonis, D...
Eunetra Ellison Simpson, PhD Proposal Defense, Dr. William Allan Kritsonis, D...Eunetra Ellison Simpson, PhD Proposal Defense, Dr. William Allan Kritsonis, D...
Eunetra Ellison Simpson, PhD Proposal Defense, Dr. William Allan Kritsonis, D...
 
Vibrant Schools Project - The Learning Tree
Vibrant Schools Project - The Learning TreeVibrant Schools Project - The Learning Tree
Vibrant Schools Project - The Learning Tree
 
comparative education; meaining, defiation, aim, purpose, (TASNEEMKHOKHAR1280...
comparative education; meaining, defiation, aim, purpose, (TASNEEMKHOKHAR1280...comparative education; meaining, defiation, aim, purpose, (TASNEEMKHOKHAR1280...
comparative education; meaining, defiation, aim, purpose, (TASNEEMKHOKHAR1280...
 
ISLarticle
ISLarticleISLarticle
ISLarticle
 
Collaborative leadership in an era of the new normal done (nfeasj)
Collaborative leadership in an era of the new normal done (nfeasj)Collaborative leadership in an era of the new normal done (nfeasj)
Collaborative leadership in an era of the new normal done (nfeasj)
 
Loretta A. Terry & Dr. William Kritsonis
Loretta A. Terry & Dr. William KritsonisLoretta A. Terry & Dr. William Kritsonis
Loretta A. Terry & Dr. William Kritsonis
 
High school leadership
High school leadershipHigh school leadership
High school leadership
 
The Effects Of Parental Involvement On Public Schools
The Effects Of Parental Involvement On Public SchoolsThe Effects Of Parental Involvement On Public Schools
The Effects Of Parental Involvement On Public Schools
 
EDD614ASSIGNMENTCASE2Trident International University .docx
EDD614ASSIGNMENTCASE2Trident International University .docxEDD614ASSIGNMENTCASE2Trident International University .docx
EDD614ASSIGNMENTCASE2Trident International University .docx
 
TextbookInformation Governance Concepts, Strategies and Best P.docx
TextbookInformation Governance Concepts, Strategies and Best P.docxTextbookInformation Governance Concepts, Strategies and Best P.docx
TextbookInformation Governance Concepts, Strategies and Best P.docx
 
Preparing Your PresentationBobby Franklin, Ph. D. Michele Mo.docx
Preparing Your PresentationBobby Franklin, Ph. D. Michele Mo.docxPreparing Your PresentationBobby Franklin, Ph. D. Michele Mo.docx
Preparing Your PresentationBobby Franklin, Ph. D. Michele Mo.docx
 
Putting a Price on Education - The Cost of Marketisation in Australian Schooling
Putting a Price on Education - The Cost of Marketisation in Australian SchoolingPutting a Price on Education - The Cost of Marketisation in Australian Schooling
Putting a Price on Education - The Cost of Marketisation in Australian Schooling
 
Essay On Superintendent
Essay On SuperintendentEssay On Superintendent
Essay On Superintendent
 
TURNAROUND SCHOOLS AND ONLINE LEARNING 1 .docx
TURNAROUND SCHOOLS AND ONLINE LEARNING       1 .docxTURNAROUND SCHOOLS AND ONLINE LEARNING       1 .docx
TURNAROUND SCHOOLS AND ONLINE LEARNING 1 .docx
 
TURNAROUND SCHOOLS AND ONLINE LEARNING 1 .docx
TURNAROUND SCHOOLS AND ONLINE LEARNING       1 .docxTURNAROUND SCHOOLS AND ONLINE LEARNING       1 .docx
TURNAROUND SCHOOLS AND ONLINE LEARNING 1 .docx
 

Leer After the Big Bang 2016

  • 1. After the Big Bang: Estimating the effects of decentralization on educational outcomes in Indonesia through a difference-in-differences analysis Jane Leer 1, * Stanford Graduate School of Education, Stanford University, 485 Lasuen Mall, Stanford, CA 94305, United States 1. Introduction Education policy makers around the world are faced with the same question: should education be the responsibility of the central government, or should education provision be decentra- lized? Over the last several decades, decentralization has been one of the most hotly debated policy issues affecting countries across the income spectrum. Proponents of decentralization claim that local stakeholders, who are less constrained by state bureaucracy and more in touch with the local context, are better equipped to provide education than central authorities. In this way, it is argued that decentralization reforms have the potential to improve student achievement by increasing schools’ efficiency, ensuring that schools are more aligned with local educational needs and preferences, and empowering local communities to hold schools accountable for providing quality education (Barrera-Osorio et al., 2009; Jimenez et al., 1986; World Bank, 2011). Despite the proliferation of these reforms, the empirical evidence of the capacity of decentralization to improve education- al quality and equity is limited. To a certain extent, the lack of consistency in the literature on decentralization is not surprising, considering that decentralization relies on local resources and institutional capacity, both of which vary significantly across contexts. Despite the uneven nature of communities’ responses to decentralization reforms, however, few studies have explored the role of decentralization in perpetuating or alleviating educational disparities. My study explores the effects of decentralization on educational outcomes in elementary and junior secondary schools in Indonesia. Indonesia makes for an interesting case study of decentralization for several reasons. The Indonesian public education sector has gone from being one of the most highly centralized in the world to one of the most decentralized. These reforms are often referred to as ‘‘Big Bang Decentralization,’’ given the swiftness with which the decentralization policies were enacted and the contrast they pose to the country’s previously tightly centralized governance structure (Chen, 2011). Decentralization occurred at the same time as dramatic growth in primary and secondary enrollment. Despite this expansion, however, regional and socioeconomic disparities persist in both enrollment and achievement, particu- larly at the secondary level (Arze del Granado et al., 2007; World Bank, 2013). My study addresses the role of decentralization in improving school quality and alleviating these disparities. Leveraging school level data spanning fifteen years, I estimate the effects of decentralization on school quality using a difference- in-differences mode. Specifically, I compare before and after International Journal of Educational Development 49 (2016) 80–90 A R T I C L E I N F O Article history: Received 1 November 2015 Received in revised form 15 February 2016 Accepted 19 February 2016 Keywords: Decentralization School-based management Difference-in-differences Teacher effort Student achievement Educational policy A B S T R A C T Proponents of decentralization argue that bringing decisions closer to the people improves school quality and efficiency by ensuring that schools are more responsive to local educational needs. In practice, the effects of decentralization vary substantially, given that the implementation of these reforms relies on local resources and management capacity. In this paper, I estimate the effects of decentralization on educational outcomes in Indonesia using a difference-in-differences model. I find no overall effect on achievement, but a negative effect on teacher effort, particularly in rural areas and among schools with inactive school committees. ß 2016 Elsevier Ltd. All rights reserved. * Corresponding author. Tel.: +1 7074974627. E-mail address: jleer@alumni.stanford.edu 1 Current address: 2000 L St. NW, Suite 500, Washington, DC 20036, United States. Contents lists available at ScienceDirect International Journal of Educational Development journal homepage: www.elsevier.com/locate/ijedudev http://dx.doi.org/10.1016/j.ijedudev.2016.02.005 0738-0593/ß 2016 Elsevier Ltd. All rights reserved.
  • 2. changes in educational outcomes in Ministry of Education and Culture (MoEC) schools to the analogous changes in outcomes in a comparison group of schools that have always been decentra- lized—private school1 . I find no effect of decentralization on math and language achievement, although there is a weak negative effect on math achievement among schools with inactive school committees. I also measure the effects of decentralization on teacher effort, as measured by the number of hours that teachers spend in the classroom per week, and I find a negative effect, particularly in rural areas and among schools with inactive school committees. These findings contribute to the growing body of literature challenging the assumption that decentralization improves school quality. Given the global popularity of decentrali- zation, it is essential that policy makers understand the mecha- nisms through which these reforms can influence achievement, and the resulting implications for educational equity. My findings contribute to this understanding. 2. Theoretical and empirical background At its most basic, decentralization refers to the devolution of fiscal responsibility and decision-making power from the central government to local authorities. In practice, of course, no education system is completely centralized nor completely decentralized, and a great deal of variation exists across school systems in terms of the division of responsibilities between central and local authorities. The policy debate revolves around the degree of fiscal responsibility and decision-making power that should be decen- tralized, and to whom authority should be granted at the local level (e.g., provincial governments, district governments, school com- mittees, or even private firms or individuals). The assumption is that by reducing the role of the central government, and allowing schools to operate in a quasi-market framework, schools will be more flexible, innovative, and responsive to local needs (Barrera-Osorio et al., 2009; Carnoy, 1999; Jimenez et al., 1986). In this sense, decentralization is one of the market-based reforms that have dominated education planning since the 1990s, especially among the development aid community, where decentralization has been a favored policy item on the ‘‘menu’’ of education reforms promoted by the World Bank and other multilateral agencies (Mundy, 2007, 2002; Riddell, 1998). Indeed, the popularity of these reforms is here to stay: local autonomy is one of the World Bank’s primary strategies for strengthening education systems through 2020 (World Bank, 2011). In the following, I describe the theoretical assumptions underlying decentralization and the empirical evidence of the relationship between decentralization and educational outcomes. First, decentralization is based on the assumption that bringing decisions closer to the people improves the efficiency of the education system. In the context of low and middle-income countries, for example, decentralization may ensure that teachers are paid on time via the introduction of a more direct payment model, in which teachers are paid by district governments, rather than central governments (Di Gropello and Marshall, 2009). Similarly, by eliminating the bureaucratic ‘‘middle-man’’ role of the central government, decentralization can ensure that schools adapt more quickly to local educational needs and labor markets. A second mechanism through which decentralization can improve school quality is by strengthening the accountability mechanisms between schools and communities. In countries like Indonesia, where teacher absenteeism is common, increased community monitoring (not to mention the possibility of withholding pay) may serve as an incentive for improved teacher performance (Asian Development Bank and OECD, 2015; Di Gropello and Marshall, 2009). Finally, a third reason for the popularity of decentralization is the notion that these reforms will stimulate a shared sense of responsibility for educational outcomes between teachers, princi- pals, families, and community members (De Grauwe, 2005). It is assumed that decentralization empowers communities to work together to support schools; parents will promote students’ educational efforts at home and in school, families will visit classrooms and help out with academic and extracurricular activities, and community members and local businesses will work together to ensure that schools are adequately supplied, for example. Empirically, the capacity of decentralization to meet these assumptions is contested. Evidence from Chile suggests that decentralization (in the form of state-subsidized privatization) does not improve the overall efficiency of education provision (McEwan and Carnoy, 2000). McEwan and Carnoy (2000) find that the achievement gains in private (Catholic) schools are offset by the higher cost of Catholic school education as compared to public education. Thus, the relative efficiency of private schools and public schools is similar. An additional threat to the assumption that decentralization improves efficiency is the possibility of elite capture of public funds (Bardhan, 2002). This is particularly relevant in the context of Indonesia, widely recognized as one of the most corrupt countries in the world (Suryadarma, 2012). Indeed, Suryadarma (2012) finds that public spending in less corrupt regions of Indonesia has a positive effect on enrollment, while in more corrupt regions the relationship between public education spending and enrollment is negligible. This suggests that a significant portion of public funds in these more corrupt regions never makes it to schools. A growing body of research from Latin America and sub- Saharan Africa focuses on the capacity of decentralization to improve educational outcomes through school-based manage- ment. Studies show that autonomous schools improve school participation and student achievement vis-a`-vis increased paren- tal involvement in schools (Duflo et al., 2014; Gertler et al., 2008; Jimenez and Sawada, 2014, 1999) improved teacher effort (Di Gropello and Marshall, 2009; Duflo et al., 2014), and increased community-based investments in educational resources, such as library books (Carnoy et al., 2008; King and Ozler, 2005). These studies suggest that localized school governance can improve school quality by strengthening the accountability mechanisms between parents and schools, incentivizing teacher effort, and engaging communities in school management. However, community engagement is not automatic, and is particularly problematic in rural or lower income contexts where parents with low levels of education may not feel it is their role to participate in school management, or may not be financially able to dedicate the time required to participate (Gunnarsson et al., 2009; King and Ozler, 2005; Meade and Gershberg, 2008). In this regard, research from Mexico finds that the positive effects of a pilot school-based management program largely disappeared when the program was taken to scale (Santiban˜ez et al., 2014). Despite positive effects of the pilot program, when implemented at scale the school-based management program did not substantially change parents’ involvement in school decision-making, even though most parents reported being aware of their role in school management. Moreover, even when decentralization does increase parental and community engagement in schools, parents, community members and local authorities do not always make optimal school 1 By comparing differences in changes in achievement between MoEC and private schools, rather than differences in absolute achievement levels, I account for time- invariant differences between these two school types (such as the fact that private schools are mostly Islamic, while MoEC schools are secular). The assumptions underlying this difference-in-differences estimate are described in Section 5. J. Leer / International Journal of Educational Development 49 (2016) 80–90 81
  • 3. management decisions. In Honduras, for example, Di Gropello and Marshall (2009) find that school councils are more likely than central authorities to hire teachers with lower levels of experience (and lower salary rates), which reduces the positive effect of school autonomy on achievement. Likewise, parental and community involvement in schools is not always welcome. A recent randomized controlled trial evaluation in Niger finds that school-based management increased parental monitoring of teacher attendance, but teacher attendance itself decreased (the program had no effect on student achieve- ment) (Beasley and Huillery, 2014). The authors find that teachers resent parental involvement in schools because it undermines their authority as representatives of the central government. These findings demonstrate the need to further explore the role of decentralized school management and parental participation in contexts where the education sector has historically been tightly controlled by central authorities, or where parental involvement in schools has traditionally been minimal (as is the case in Niger, as in Indonesia) (Bjork, 2003; Parker and Raihani, 2011). To a certain extent, the lack of consistency across studies of the effects of decentralization and school-based management on achievement is not surprising, considering that these policies rely on local resources, management capacity, culture, and the political will to self-manage, all of which vary substantially across contexts. Given the heterogeneous nature of communities’ responses to decentralization, these reforms have the potential to increase educational disparities between schools. Conversely, if the assumptions of decentralization hold, and local authorities are better able to ensure school quality, then decentralization could reduce the achievement gap between urban and rural schools, or high-income and low-income schools, for example. Few studies have addressed this issue empirically. Research from Bolivia and Colombia points to the latter hypothesis—suggesting that decentralization can enable poorer districts to catch up to their wealthier neighbors. Faguet (2004) and Faguet and Sa´nchez (2008) find that municipal authorities are more likely than the central government to invest in education where the need is greatest (e.g., where enrollment levels are lowest, or where illiteracy rates are highest). In turn, municipal education investments under decentralization are associated with increased enrollment in these more vulnerable localities. Research from Argentina paints a different picture, however. Galiani et al. (2008) find that the devolution of school governance to provincial authorities has a positive effect on test scores on average, but not among schools located in poor municipalities. Likewise, in an experimental study from The Gambia, Blimpo et al. (2015) find that local capacity (as measured by average district level adult literacy) moderates the effect of school-based management on educational outcomes. The authors estimate that a minimum of 45 percent adult literacy is needed for school-based management to affect learning outcomes (Blimpo et al., 2015). In sum, existing research suggests that decentralization can improve educational outcomes, but only when local governments, communities and schools have the resources and political will to self-manage. The assumption that autonomy will automatically improve efficiency and quality is problematic in practice. However, despite the uneven nature of communities’ responses to decentralization, few studies outside of Latin America have assessed the impact of nationwide decentralization policies on educational quality and equity. My study addresses this gap by estimating the effects of decentralization on achievement and teacher effort in Indonesia. In order to further unpack the mechanisms through which decentralization can affect educa- tional equity, I explore how these effects vary across urban and rural locations and according to the degree of community engagement in school management. 3. Decentralization in Indonesia Indonesia provides a unique case study for testing the theoretical assumptions of decentralization, not only because the Indonesian education system is the fourth largest education system in the world (World Bank, 2015), but also given the country’s experience of rapid decentralization coupled with persistent regional and socioeconomic disparities in both attain- ment and achievement (Asian Development Bank and OECD, 2015). Basic education in Indonesia consists of six years of elementary school and three years of junior secondary school. Responsibility for basic education falls under the authority of two sectors: 84 percent of schools are governed by the Ministry of Education and Culture (MoEC); while the remaining 16 percent of schools are governed by private community foundations (mostly Islamic foundations), which are overseen at the national level by the Ministry of Religious Affairs (MORA) (Asian Development Bank and OECD, 2015). Since the 1970s, the Indonesian government has made strides toward the unification of these two systems, namely through the 1976 decree which made Islamic schools responsible for teaching the national curriculum in addition to the traditional religious curriculum. In practice, however, private schools, particularly private Islamic schools, lag behind MoEC schools in terms of overall school infrastructure quality, teacher qualifica- tions, school completion, and achievement (Raihani, 2013). MoEC and private schools also differ in terms of governance. Despite receiving varying degrees of government funding, private schools, by definition, operate largely autonomously from the central government. MoEC school governance, on the other hand, was highly centralized until 2001 when the decentralization process began (Raihani, 2013). Decentralization emerged in response to the political turmoil and economic crisis of the late 1990s, which put a severe strain on the legitimacy and fiscal power of the central government. In 2001 the central government transferred administrative and fiscal responsibility for health and secular education to district govern- ments. Under these reforms, district governments are responsible for teacher salaries, general school operational costs, and most aspects of school management (Raihani, 2007). Districts cover about 60 percent of school finance, the central government provides 35 percent, and provinces cover the remaining 5 percent (Arze del Granado et al., 2007). District spending is primarily limited to nondiscretionary routine expenditures (e.g., teachers’ salaries), while the central government maintains responsibility for development expenditures (e.g., school construction) (Arze del Granado et al., 2007). School-based management followed decentralization in 2003, when the government mandated the role of school committees in educational planning and supervision (Bandur, 2009). In Indone- sia’s version of school-based management, school governance responsibility is primarily delegated to principals, who are expected to work in collaboration with school committees comprised of teachers, parents, and community members who are elected by the community. Officially, school committees have the authority to set the school’s mission and vision, determine learning standards, raise school funds, develop extra-curricular activities, contribute to the development of localized curriculum, encourage linkages between schools and external organizations, allocate non-salary components of the school budget, and hire non-contract teachers (Bandur, 2009). Following decentralization in the MoEC system, the govern- ment passed a series of sector-wide reforms directed at all schools, including private schools. First, the Education Act of 2003 officially declared all citizens’ right to tuition-free basic education. To facilitate this law, the government launched a massive grant J. Leer / International Journal of Educational Development 49 (2016) 80–9082
  • 4. program, the Bantuan Operasional Sekolah (BOS) (Raihani, 2007). As of 2005, almost all MoEC and private elementary and junior secondary schools receive annual BOS grants, which are deter- mined on a per-pupil basis and distributed directly to schools (Barrera-Osorio et al., 2009). BOS funds are meant to cover routine expenditures such as student registration, textbooks, extra- curricular activities, student examination fees, teacher develop- ment and training, remuneration of honorary (non-permanent) teachers, and learning materials (Arze del Granado et al., 2007). Additional legislation passed in 2005 defined national stan- dards in the following seven areas: content, process, graduate competency, teacher qualifications, school facilities, funding, and assessment (Asian Development Bank and OECD, 2015). The implementation of these national standards has been slow, however. As of 2009, only 38 percent of primary school teachers and 73 percent of junior secondary school teachers met the minimum education requirements of a four-year college degree (Raihani, 2013). Resource shortage and teacher absenteeism have also been persistent concerns, particularly in rural areas, where on any given school day up to 50 percent of teachers are likely to be absent (Asian Development Bank and OECD, 2015). Indeed, the educational disparities in Indonesia are well docu- mented. Junior secondary school enrollment rates among rural and lower-income communities lag behind urban and wealthier communities by as much as 50 percent (Arze del Granado et al., 2007). There are also significant socioeconomic and urban/rural gaps in achievement (Raihani, 2007), and the difference in the quality of educational resources between high-income and low- income schools, and between urban and rural schools, is one of the largest among all PISA-participating countries (OECD, 2013). Descriptive studies indicate that there have been significant challenges to the implementation of decentralization and school- based management in practice. Efforts to train and support communities in establishing the necessary accountability mecha- nisms have been minimal (SMERU, 2006). A nationally represen- tative survey of primary school communities finds that over 80 percent of parents do not participate in school improvement activities, such as helping in the classroom or serving on classroom committees, and 30 percent had never talked to their child’s teacher (Chen, 2011). Lack of parental awareness about school- based management policies, lack of clarity in the central government’s guidelines for decentralization, and low levels of local capacity impede school leaders’ ability to implement decentralization (Amirrachman et al., 2008; Bandur, 2012a; Chen, 2011; Kristiansen and Pratikno, 2006; Yeom et al., 2002). Thus, despite the rhetoric of community engagement, the current system emphasizes top-down supervision and monitoring, vis-a`-vis district school inspection visits, for example, rather than bottom-up pressure from parents and community members (Amirrachman et al., 2008; Chen, 2011). This is partly explained by the fact that, parents – particularly those with lower levels of education – feel it is not their place to intervene in school affairs, given that this role has historically been limited to authority figures (Parker and Raihani, 2011). Similarly, participation in school management is difficult for low-income parents who must take time away from wage-earning activities to attend school committee meetings and visit schools (Parker and Raihani, 2011). Far from stimulating local democracy and shared decision- making power, in some cases decentralization has empowered local interest groups to increase their control over community resources, leading to the perception among rural parents and teachers that decentralization will result in competition between wealthy, well-connected, urban schools and their poorer rural counterparts (Amirrachman et al., 2008; Kristiansen and Pratikno, 2006). Opinions diverge, however. A case study of the Ngada Educational District, for example, finds that over 90 percent of teachers, parents and school leaders believe that student achievement has improved as a result of decentralized manage- ment (Bandur, 2012b; Bandur and Gamage, 2009). Several studies suggest that decentralization has played a role in exacerbating educational disparities in Indonesia. Toi (2010), for example, finds that school budgets and teacher qualifications decreased among poor schools following decentralization, but remained largely stable among wealthier schools. Arze del Granado et al. (2007) demonstrate that although regional (between-province) disparities in primary and secondary school enrollment have decreased since decentralization, between- district disparities increased from 1998 to 2004, likely linked to the transfer of educational spending responsibilities from the central to district level. My research builds on these studies by empirically testing the effect of decentralization on school quality—namely, student achievement and teacher effort, and exploring how these effects are shaped by community characteristics. 4. Data My dataset contains information on 2561 MoEC schools and 1251 private schools from the Indonesian Family Life Survey (IFLS), an ongoing longitudinal panel survey conducted by the RAND Corporation in collaboration with the University of California, Los Angeles (UCLA) and Lembaga Demografi, University of Indonesia2 . I use all available waves of the IFLS survey: the IFLS 1, collected in 1993/4, the IFLS 2, collected in 1997/8, the IFLS 3, collected in 2000/1, and the IFLS 4, collected in 2007/8. The IFLS data are representative of about 83 percent of the Indonesian population, spanning 13 of Indonesia’s 27 provinces (Frankenberg et al., 1995)3 . The school level data in the IFLS are representative of the schools available to the households in the sample communities. In each wave of the IFLS, three elementary schools and three junior secondary schools were randomly selected from a list of existing schools based on information provided by surveyed households and village leaders in each community. The total number of MoEC and private schools observed each year is relatively consistent, at around 1200 MoEC schools and 500 private schools each year (see Table 1). Although the data are not explicitly intended to be panel data, about 70 percent of schools are observed more than once, particularly in smaller communities, where the likelihood of Table 1 School observations per year. 1993/1994 1998/1999 2000/2001 2007/2008 Ministry of Education & Culture (MoEC) 1208 1201 1267 1277 Private schools 454 510 547 477 2 Private schools in this analysis are classified as such if the school organizer is listed as a private foundation or the Ministry of Religious Affairs (MoRA). MoRA serves as the top authority on the Islamic curriculum and provides varying degrees of funding to Islamic schools, but the ministry itself plays a limited role in school governance, as MoRA schools have always operated in a decentralized fashion (Raihani, 2013; UNESCO, 2010). MoEC schools are classified as such if the school organizer is listed as the Ministry of Education and Culture (MoEC) or District Office of Education schools. As a robustness check, I conduct two separate difference-in- differences analyses, one in which I restrict the comparison group sample to include only MoRA schools, and one in which I restrict the comparison group sample to include only private foundation schools. The results of both analyses are consistent with the reported results. 3 Provinces were selected to maximize population representation and capture Indonesia’s cultural and socioeconomic diversity. See Frankenberg et al. (1995) for more information. J. Leer / International Journal of Educational Development 49 (2016) 80–90 83
  • 5. being randomly selected from the community roster is greater. I conduct my analysis on the full sample of 1951 elementary schools and 1861 junior secondary schools as well as the balanced panel sample of 365 elementary schools and 414 junior secondary schools observed at baseline (2000) and post-decentralization (2007)4 . The final sample is presented in Table 2. My primary outcome variable is student achievement, defined as school mean performance on math and Indonesian Bahasa language test scores from the Indonesian National Exam, Ujan Nacional (UAN). The UAN (previously called the EBTANAS) is a standardized test that is mandatory for all students in the last year of primary school, junior secondary,andseniorsecondaryschool.Althoughthetestitemshave undergone some changes in the period from 1993 to 2007, UAN scoring has remained relatively constant (Asian Development Bank and OECD, 2015). Moreover, these changes affect both MoEC and private schools equally(the testisthe samefor both sectors).Assuch, these minor changes do not threaten the internal validity of my estimate. However, students’eligibility for the next levelof schooling is determined on the basis of UAN scores, which makes the UAN a high stakes exam (Asian Development Bank and OECD, 2015). This poses a potential threat to the validity of this construct as a proxy of achievement, since students and teachers have an incentive to manipulate scores. For each school-by-year observation, I observe the math and language test scores of a randomly selected sample of 25 students in grade six for each primary school and grade nine for each junior secondary school5 . For ease of interpretation, and in order to account for potential differences in scoring across years and school levels, I standardize test scores by year and school level6 . I report both math and language test scores, but the math score is likely a more reliable estimate of achievement, given Indonesia’s linguistic diversity (Bahasa is the language of instruction in Indonesia, but a large percentage of students speak a different language at home) (Raihani, 2013). The school level IFLS data does not include information on the percent of students at each school for whom Bahasa is a second language. My second outcome of interest is teacher effort, as measured by the average number of hours per week that teachers spend in the classroom, standardized within each year. As of 2013, only 44 percent of teachers teach the minimum number of hours required (Asian Development Bank and OECD, 2015). Thus, teachers’ hours spent in the classroom are a reasonable proxy of teacher effort in Indonesia. Likewise, teacher absenteeism is one aspect of school quality that is expected to improve through community monitoring under school-based management (Bandur, 2012a). For each school in the first three waves of the IFLS, I have information on self-reported hours spent teaching for two randomly selected teachers (one math teacher and one Bahasa language teacher). The 2007 survey collected information on only one teacher (math or Bahasa language teacher). Thus, these data are not necessarily representative of the average teacher at each school. However, since many schools in my sample have only one math and language teacher per grade level, most of the teachers interviewed taught the students for whom I have test scores, which makes these data a meaningful representation of the quality of teaching at the schools in my sample. 5. Identification strategy In order to estimate a causal relationship between decentraliza- tion and educational outcomes I need to identify what educational outcomes in MoEC schools would have been in the absence of decentralization. In an ideal world, my counterfactual would be a ‘‘control’’ group of schools that did not implement decentralization, but that are otherwise identical to the ‘‘treatment’’ group of schools that did implement decentralization. This would require an experimental research design, in which ‘‘treatment’’ and ‘‘control’’ is randomly assigned to a group of schools that have similar characteristics at baseline. However, decentralization was not randomly assigned in Indonesia. Rather, these reforms were implemented universally among MoEC schools. Thus, I rely on a quasi-experimental method, in which I compare trends in educa- tional outcomes among MoEC schools to trends in educational outcomes among a comparison group of schools that were not affected by the decentralization reforms: private schools. Specifically, I use a difference-in-differences model to estimate the effects of decentralization on student achievement and teacher effort. In this model, I compare changes in educational outcomes before and after decentralization among MoEC schools to changes in outcomes before and after decentralization among private schools. MoEC schools serve as the ‘‘treatment’’ group, and private schools represent the ‘‘control group.’’ By comparing changes between these two groups, I control for observed and unobserved time invariant characteristics as well as time-varying factors common to both groups that might be correlated with both decentralization and educational outcomes. The change in the comparison group of private schools is an estimate of the counterfactual; or in other words, how outcomes in MoEC schools would have changed in the absence of decentralization. The estimation equation is as follows: yscjt ¼ a þ b1MOECscj þ b2Postt þ b3 MOECscjÂPostt À Á þ X0 scjt þ Z0 cjt þ mt þ vj where: yscjt is the average outcome (student achievement or teacher effort) for school s in community c, district j and year t; MOECscj is an indicator variable that takes the value of 1 if the school is a MoEC school; Postt is an indicator variable equal to 1 for all observations after decentralization (e.g., all observations in 2007 wave of the IFLS); X’scjt is a vector of time variant school characteristics (the number of recorded test scores and teacher’s education); Z’cjt is a vector of time variant community characteristics (the community’s urban/rural classification and the number of households in the community)7 ; Table 2 Sample composition. Elementary schools Junior secondary schools Full sample Balanced panel Full sample Balanced panel MoEC Private MoEC Private MoEC Private MoEC Private 1608 343 321 44 953 908 280 134 4 Observations with missing data on achievement and school characteristics, schools listed as ‘‘other (e.g., not MoRA, foundation or MoEC), and schools with inconsistent information regarding school type (e.g., schools classified as MoEC in one year and MoRA in another year) restricts my sample from 7547 school-by-year observations to 6918 school-by-year observations. 5 20 percent of school-by-year observations include test scores for less than 25 students. I control for the number of tests recorded per school-by-year observation in all models. 6 Scores are standardized after having restricted my sample to include only treatment (MoEC) and control (private) observations. 7 Given that the data span 15 years, communities’ urban/rural classification is time variant. By including schools’ urban/rural classification in my model, I account for time variant factors that might be associated with both urbanization and achievement, such as population growth and economic development. J. Leer / International Journal of Educational Development 49 (2016) 80–9084
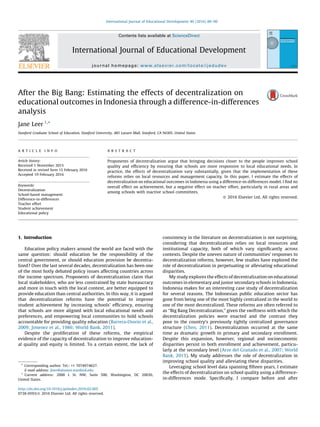
  • 6. mt is pre-treatment year fixed effect (a binary variable equal to 1 for observations in 1993/4 and 1998/9); vj are district fixed effects; ps represents school fixed effects; and escjt is the idiosyncratic error term. The causal variable of interest is b3, the interaction between the time period of decentralization and the binary variable indicating whether or not MoEC administers the school. The coefficient on this term represents the difference in outcomes before and after decentralization between MoEC and private schools. b1 represents the pre-decentralization difference in outcomes between MoEC and private schools, and b2 represents the difference in outcomes post-decentralization that is common to all schools. This model estimates the effect of six years of fiscal and administrative decentralization and four years of school-based management in MoEC schools. Since 2005, however, both private schools and MoEC schools have received annual block grants through the BOS program, which are contingent on the formation of a school committee. In practice, this aspect of the BOS program has been weakly monitored, particularly among private schools, which are already governed by community level associations (SMERU, 2006). Regardless, it is possible that the BOS program encouraged private schools to adopt some aspects of school-based management. Therefore, the treatment contrast I observe in 2007 is the effect of switching from centralized management to decentralized management including four years of exposure to school-based management among MoEC schools, relative to always being decentralized plus two years of exposure to school- based management among private schools. In this way, my study moves beyond previous studies by isolating the effects of changes in governance from the provision of additional inputs that accompany these reforms. Since both private schools and MoEC schools benefit equally from the BOS funds, any changes I find among MoEC schools can be attributed to changes in school governance, rather than increased school inputs8 . 6. Results In the following sections I compare educational outcomes between MoEC and private schools before and after decentraliza- tion. I find no overall effect of decentralization on math and language achievement and no evidence of heterogeneous effects according to the school’s urban/rural location. However, I find a weak negative effect on math achievement among schools with inactive school committees. I also explore the effect of decentrali- zation on teacher effort, and I find a negative effect on the number of hours that teachers spend in the classroom, particularly in schools located in rural communities and schools with inactive school committees. 6.1. Achievement Figs. 1 and 2 present mean standardized math and language achievement scores from 1993 to 2007. From 1993 to 1999, the difference in achievement between private and MoEC schools is relatively consistent. Math achievement among MoEC schools increased slightly from 1993 to 2000, and then decreased slightly from 2000 to 2007. In private schools, math achievement decreased from 1993 to 2000 and increased slightly from 2000 to 2007. Language achievement, meanwhile, remained relatively constant from 1993 to 2007 in both MoEC and private schools. Tables 3 and 4 respectively present the difference-in-differ- ences estimate of the effect of decentralization on math and language achievement, for the combined sample and separately for elementary and junior secondary schools. I report the estimates conducted with the full sample and the balanced panel sample. The balanced panel sample is more representative of schools from small, rural communities, where schools are more likely to be observed more than once. However, unlike the full sample, the balanced panel estimate is free from any bias caused by schools entering and leaving the sample. The coefficient of interest, the interaction between being a MoEC school in the post-treatment period, is given in the first row (Post  MoEC). For both math and language achievement, the overall effect of decentralization is negative but not statistically significant. 6.2. Teacher effort Teacher effort, as measured by the number of hours per week that teachers spend in the classroom, increased from 31 to almost 35 h in MoEC elementary schools from 1993 to 2000 and then decreased slightly to about 31 h per week in 2007. Teachers at Fig. 1. Trends in math achievement from 1993 to 2007. Note: Data presented are from the full sample. Fig. 2. Trends in language achievement from 1993 to 2007. Note: Data presented are from the full sample 8 One threat to the validity of my difference-in-differences model is the possibility that decentralization resulted in selective migration from private schools to MoEC schools (or vice-a-versa), especially if the per-student funding nature of the BOS program encouraged schools to compete for students. I discuss this and other threats to internal validity in Section 6.4. J. Leer / International Journal of Educational Development 49 (2016) 80–90 85
  • 7. private elementary schools, meanwhile, spent around 30 h in the classroom per week consistently from 1993 to 2007. At the junior secondary level, both MoEC and private school teachers increased the amount of time spent in the classroom from between 20 and 24 h from 1993 to 2000, to about 28 h in 2007. Table 5 and Fig. 3 present these trends. The difference-in-differences estimate of the effect of decen- tralization on teacher effort is presented in Table 6. In the combined sample of elementary and junior secondary schools, I find a negative effect on hours spent in the classroom, in the magnitude of 0.3 standard deviations, only significant in the balanced panel sample. This represents about two fewer hours per week spent in MoEC classrooms. 6.3. Heterogeneous effects I examine heterogeneous effects across two school character- istics. First, considering the educational disparities between urban Table 3 Estimated effect of decentralization on math achievement. Elementary Junior secondary Total Full sample Balanced panel Full sample Balanced panel Full sample Balanced panel Post  MoEC 0.096 À0.195 À0.121 À0.163 À0.071 À0.188 (0.401) (0.482) (0.165) (0.186) (0.149) (0.168) Constant 0.731 1.488 À0.160 0.085 0.466* 1.367** (0.468) (0.920) (0.428) (1.179) (0.265) (0.600) Observations 3529 730 3389 828 6918 1558 R-squared 0.722 0.634 0.751 0.713 0.730 0.661 Robust standard errors in parentheses. All models include school and district fixed effects as well as the following time variant school and community covariates: teachers’ education, the number of test scores recorded per school, the community’s urban/rural classification, and the total number of households in the community. Models conducted with the full sample include pre-treatment year fixed effects. *** p 0.01, ** p 0.05, * p 0.1. Table 4 Estimated effect of decentralization on language achievement. Elementary Junior secondary Total Full sample Balanced panel Full sample Balanced panel Full sample Balanced panel Post  MoEC À0.190 À0.230 0.0179 0.008 À0.075 À0.107 (0.175) (0.271) (0.140) (0.164) (0.102) (0.136) Constant 0.232 0.796 À0.197 1.399 0.109 1.056* (0.704) (0.736) (0.418) (0.905) (0.363) (0.570) Observations 3529 730 3389 828 6918 1558 R-squared 0.744 0.697 0.770 0.742 0.752 0.708 Robust standard errors in parentheses. All models include school and district fixed effects as well as the following time variant school and community covariates: teachers’ education, the number of test scores recorded per school, the community’s urban/rural classification, and the total number of households in the community. Models conducted with the full sample include pre-treatment year fixed effects. *** p 0.01, ** p 0.05, * p 0.1. Table 5 Teacher effort (hours in the classroom per week), by school type and year. Elementary schools 1993/1994 1998/1999 2000/2001 2007/2008 MoEC Mean 31.318 33.147 34.485 30.770 SD 5.660 8.002 6.532 6.183 Private Mean 30.679 30.904 30.038 30.507 SD 8.746 9.798 9.778 7.831 Junior secondary schools 1993/1994 1998/1999 2000/2001 2007/2008 MoEC Mean 22.628 22.413 24.229 28.382 SD 5.832 5.931 7.094 8.433 Private Mean 20.429 21.45 21.941 27.068 SD 7.833 8.130 8.581 10.017 Note: Data presented are from the full sample. Fig. 3. Trends in teacher effort from 1993 to 2007. J. Leer / International Journal of Educational Development 49 (2016) 80–9086
  • 8. and rural schools in Indonesia (Asian Development Bank and OECD, 2015), I split the sample according to the baseline urban/rural classification of the community within which schools are located. Second, in order to explore the role of school committees in implementing decentralization and school-based management, I divide the sample into two groups according to the number of times per year that school committees meet. This information is based on principal-reported data from the 2007 IFLS survey. On average, school committees meet four times per year. I define school committees as highly active if the committee meets six or more times per year and inactive if the committee meets two or fewer times per year. Eighteen percent of MoEC schools observed in 2007 have highly active school committees and 33 percent have inactive school committees. To maintain statistical precision, I conduct both sub-group analyses on the combined sample of elementary and junior secondary schools. I find no evidence of a heterogeneous effect on achievement by school location. In terms of teacher effort, however, I find large a negative effect on teacher effort in rural schools, in the magnitude of À0.457 standard deviations, significant at the ten percent level. This represents almost three fewer hours per week spent in the classroom. Table 7 presents these results. I find slight evidence of a negative effect of decentralization on math achievement among schools with an inactive school committee (see Table 8). These effects are present in the full sample and balanced panel sample, but are less robust to the inclusion of school fixed effects9 . The effects on teacher effort among schools with inactive school committees, on the other hand, are large and robust to the inclusion of school fixed effects (see Table 9). The effect on teacher effort is larger among inactive school committees than it is among rural schools, representing around 3 fewer teaching hours per week. There is no effect of decentralization on achievement or teacher effort among schools with highly active school committees. 6.4. Robustness checks The internal validity of these estimates relies on the assumption that changes in outcomes in private schools provide an unbiased estimate of how outcomes would have changed in MoEC schools (Angrist and Pischke, 2009). At face value, the validity of this assumption seems potentially spurious, given the visual differ- ences in trends between MoEC and private schools evident in Figs. 1 and 2. While I cannot directly test this assumption, I perform several robustness checks to address potential sources of bias. Table 6 Estimated effect of decentralization on teacher effort. Elementary Junior secondary Total Full sample Balanced panel Full sample Balanced panel Full sample Balanced panel Post  MoEC À0.229 À0.344 0.0833 À0.026 À0.243 À0.316** (0.187) (0.317) (0.192) (0.205) (0.154) (0.154) Constant 0.747** 0.820 À1.096* À2.728** À0.039 À0.914 (0.321) (0.764) (0.621) (1.170) (0.303) (0.798) Observations 3506 725 3375 826 6881 1551 R-squared 0.667 0.620 0.681 0.589 0.731 0.594 Robust standard errors in parentheses. All models include school and district fixed effects as well as the following time variant school and community covariates: teachers’ education, the number of test scores recorded per school, the community’s urban/rural classification, and the total number of households in the community. Models conducted with the full sample include pre-treatment year fixed effects. *** p 0.01, ** p 0.05, * p 0.1. Table 7 Heterogeneous effects of decentralization by school location. Math achievement Language achievement Teacher effort Urban Rural Urban Rural Urban Rural Post  MoEC À0.205 0.0679 À0.122 À0.069 À0.141 À0.457* (0.172) (0.193) (0.133) (0.168) (0.210) (0.238) Constant 0.813** 0.158 0.441 À0.311 À0.126 0.0625 (0.380) (0.320) (0.414) (0.436) (0.657) (0.388) Observations 4335 2583 4335 2583 4317 2564 R-squared 0.777 0.635 0.793 0.676 0.740 0.741 Robust standard errors in parentheses. All models use the full sample and include pre-treatment year fixed effects, school fixed effects and district fixed effects as well as the following time variant school and community covariates: teachers’ education, the number of test scores recorded per school, and the total number of households in the community. *** p 0.01, ** p 0.05, * p 0.1. Table 8 Effects of decentralization on math achievement among schools with inactive school committees. Full sample Balanced panel Model 1 Model 2 Model 3 Model 4 Post  MoEC À0.270** À0.334 À0.297** À0.367* (0.113) (0.200) (0.132) (0.212) Constant À0.789*** 0.466 À0.465 0.456 (0.220) (0.505) (0.288) (0.728) Observations 1302 1302 502 502 R-squared 0.110 0.611 0.156 0.637 School FE No Yes No Yes Robust standard errors in parentheses. All models include district fixed effects as well as the following time variant school and community covariates: teachers’ education, the number of test scores recorded per school, the community’s urban/ rural classification, and the total number of households in the community. Models conducted with the full sample include pre-treatment year fixed effects. *** p 0.01, ** p 0.05, * p 0.1 9 School fixed effects account for time-invariant differences between schools that could confound the treatment estimate. As such, models with school fixed effects provide the most robust estimate (but also the most conservative estimate). J. Leer / International Journal of Educational Development 49 (2016) 80–90 87
  • 9. One way to examine the internal validity of a difference-in- differences model is to ensure that the treatment effect does not precede the implementation of treatment. To do so, I set an artificial ‘‘baseline’’ and ‘‘post-treatment’’ year to 1998 and 2000, respectively, and conduct the same difference-in-differences estimate. The presence of a statistically significant ‘‘effect’’ of this artificial treatment would indicate that any effect I find in 2007 is confounded by changes in MoEC schools that began prior to decentralization. Table 10 presents the results of this robustness check. I find no evidence of an artificial treatment effect prior to decentralization. A second potential source of bias stems from the presence of omitted time variant factors that vary uniquely between MoEC and private schools at the onset of decentralization. One way this could happen is if schools were selected for decentralization based on location-specific, time-varying information. This is unlikely, however, given that decentralization was implemented universal- ly in all MoEC schools and my comparison group is a set of schools that have always been decentralized. A second way in which omitted time variant factors could bias the difference-in-differ- ences estimate is through changes in policies or environmental factors that affect MoEC schools differently than private schools, such as the 2004 Indian Ocean tsunami and subsequent relief efforts. This is also unlikely, however, given that both types of schools are located in the same districts and communities, such that changes in policies and environmental factors that affect one group are just as likely to affect the other group. In addition, I include covariates at the community and school level in order to address possible bias from time-variant shocks affecting educa- tional outcomes. A third threat to internal validity arises from the possibility of selective migration. If wealthier families responded to decentrali- zation by switching their children from MoEC schools to private schools, the difference-in-differences estimate would be under- estimated by changes in the socioeconomic composition of students. Likewise, it is possible that decentralization increased enrollment in MoEC schools among children from lower socioeco- nomic groups who were previously excluded from the school system. This would also underestimate the treatment effect. Using IFLS household survey data from the same communities for which I have school level data, I test for (but do not report) a difference-in- differences effect of decentralization on a proxy of students’ socioeconomic status: parents’ mean years of education. The coefficient of the treatment effect of decentralization on mean parental years of education in MoEC schools is negative, suggesting that student migration from MoEC to private schools may partially explain the jump in achievement observed in private schools. The coefficient is not statistically significant, however. In addition, in the years since SBM was launched, the Indonesian government has received support from the World Bank and the United States Agency for International Development (among other donors) to implement pilot programs directed at strengthening the capacity of school committees to improve the implementation of SBM (Heyward and Cannon, 2011; Vernez, 2012). If schools in my sample also participated in these donor- supported pilot programs this would upwardly bias my estimate, but I cannot identify schools that participated in these programs. However, given the small size of my sample, as well as the small size of the donor-funded pilot programs, it is unlikely that more than a few (if any) schools from my sample received this extra support. 7. Discussion Decentralization reforms have figured prominently in the policy landscape for the last several decades and will likely continue to do so for years to come. The results of my study highlight the tenuous link between decentralization and school quality in contexts where the education sector has historically been tightly managed by the central government. I find no effect of decentralization on math and language achievement, although there is a weak negative effect on math achievement among schools with inactive school committees. I also explore the effect of decentralization on teacher effort, and I find a significant negative effect on the number of hours that teachers spend in the classroom, particularly in schools located in rural communities and in schools with inactive school committees. My findings challenge the assumption that decentralization improves school quality by making schools more accountable to local communities. There are several explanations for this discon- nect. First, it could be that local authorities perform worse (or at least, no better) than the central government. This interpretation would suggest that district and school level authorities make poor Table 9 Heterogeneous effects of decentralization by school committee engagement. Math achievement Language achievement Teacher effort Inactive SC Active SC Inactive SC Active SC Inactive SC Active SC Post  MoEC À0.334 0.322 À0.228 0.308 À0.535** À0.427 (0.200) (0.477) (0.149) (0.390) (0.237) (0.725) Constant 0.466 2.231 À0.373 0.201 À0.300 À0.740 (0.505) (1.467) (0.711) (1.429) (0.457) (1.143) Observations 1302 306 1302 306 1292 305 R-squared 0.611 0.688 0.706 0.723 0.644 0.649 Robust standard errors in parentheses. All models use the full sample and include pre-treatment year fixed effects, school fixed effects and district fixed effects as well as the following time variant school and community covariates: teachers’ education, the number of test scores recorded per school, the community’s urban/rural classification, and the total number of households in the community. *** p 0.01, ** p 0.05, * p 0.1. Table 10 Pre-decentralization artificial ‘‘treatment’’ effect. Full sample Model 1 Model 2 Post  MoEC 0.021 0.035 (0.067) (0.073) Constant 0.036 0.537** (0.155) (0.232) Observations 4895 4895 R-squared 0.115 0.827 School FE No Yes Robust standard errors in parentheses. Both models include a pre-treatment year dummy variable for 1993/4 and control for district effects, the number of completed tests recorded for each school, the school’s urban/rural location, and the number of households in the community. *** p 0.01, ** p 0.05, * p 0.1. J. Leer / International Journal of Educational Development 49 (2016) 80–9088
  • 10. school management decisions or are uninterested in supporting education. A more likely explanation is that my findings reflect the result of incomplete decentralization. In this regard, a null effect of decentralization on achievement provides empirical evidence to support the descriptive claims that decentralization has done little to change what happens in the classroom (Bjork, 2003; Yeom et al., 2002). This is aligned with what Amirrachman et al. (2008) refer to as ‘‘centralized decentralization’’, in which educational governance remains top-town, despite the rhetoric of community participa- tion. An important question emerges from these findings: what does it take to achieve complete decentralization in contexts with low – or heterogeneous – levels of local resources and manage- ment capacity? Can decentralization ever be complete in these contexts? The null effect on achievement may also be explained by the timing of my analysis. I examine schools six years after the implementation of fiscal and administrative decentralization and four years after the implementation of school-based management. The effects of these major policy reforms on achievement may take more than several years to identify. However, I do find negative effects on a potential mediator of the relationship between decentralization and achievement: the number of hours that teachers spend in the classroom per week. This indicates that local communities have not assumed the responsibility for teacher supervision and support. It may also be the case that school committees do not have the authority to supervise teacher effort. Indeed, qualitative evidence suggests that principals and district education boards maintain all real authority over school gover- nance, while school committees serve a superficial ‘‘rubber stamp’’ role in signing school budgets once a year (Kristiansen and Pratikno, 2006; SMERU, 2006). It is also possible that the negative effect on teachers’ time spent in the classroom is caused by an increase in the number of teachers that work in each school. If this is the case, it may be that decentralization had no effect on the total number of teaching hours available to students, despite the fact that individual teachers spend less time in schools. A simple analysis of trends over time suggests that the number of teachers per school has indeed grown steadily over time in both MoEC and private schools (from an average of 18 teachers per school in 1993 to 25 in 2007 in both groups). However, I find no difference-in-differences effect of decentralization on the number of teachers per school. Likewise, although my model meets the standard robustness checks of difference-in-differences models, the IFLS data are not representative of private schools and MoEC schools nationwide. Given the jump in achievement that private schools in my sample experienced from 2000 to 2007, it could be that the provision of BOS funds affected these schools differently than private schools and MoEC schools nationwide. Future research should explore how the utilization of these funds differs between these groups. Together, my findings contribute to the emerging body of research illustrating the limits of decentralization in resource- constrained settings, such as in rural schools in Indonesia. Like Galiani et al. (2008), I find evidence that decentralization can further the gap between advantaged and disadvantaged commu- nities—the negative effect on teachers’ time spent in the classroom is more than 50 percent greater in rural schools than in urban schools (and only statistically significant in rural schools). Like Jimenez and Sawada (2014) and Di Gropello and Marshall (2009), my findings highlight the importance of engaging communities in school management—I find a slight negative effect of decentrali- zation on math achievement and a large negative effect on teacher effort among schools with inactive school committees. However, I cannot rule out the possibility that differences between active and inactive school committees are primarily driven by differences in parents’ socioeconomic capacity to participate in school manage- ment. Future research is needed to isolate the effects of engaging parents in school management in this context. Rather than ruling out the potential of decentralization to improve school quality, my findings remind policymakers that autonomy is not synonymous with knowledge or empowerment. To be effective, decentralization should be accompanied by efforts to ensure that local communities know how to assess school quality and have the resources and political will to do so. This will require further research about how decisions are made at the school level, in addition to research that explores how to encourage communities to collaboratively support school quality, above and beyond providing operational funds. A second area for future research has to do with the relationship between decentralization and other aspects of school quality— namely, access. My findings apply to students who are enrolled through junior secondary school, but the most vulnerable children in Indonesia are those who remain excluded from the education system. Future studies should explore how localized school governance affects not just achievement but enrollment, drop out, and transitions. Acknowledgements This research was made possible through grants from the David and Susan Douglass 1979 Family Fellowship, the International and Comparative Education Masters of Arts fund (Stanford University), and the Freedman Spogli Institute for International Studies. I am grateful to have received invaluable support and guidance from Martin Carnoy, Christine Min Wotipka, Luana Marotta, Prashant Loyalka, Nancy Dye Leer and two anonymous reviewers. References Asian Development Bank, OECD, 2015. Education in Indonesia. OECD Publishing, Paris. Amirrachman, A., Syafi’i, S., Welch, A., 2008. Decentralising Indonesian education: the promise and the price. World Stud. Educ. 9, 31–53. Angrist, J.D., Pischke, J.S., 2009. Mostly Harmless Econometrics: An Empiricist’s Companion. Princeton University Press, Princeton. Arze del Granado, J., Fengler, W., Ragatz, A., Yavuz, E., 2007. Investing in Indonesia’s education: allocation, equity, and efficiency of public expenditures. In: Working Paper No. No. 4372. Munich Personal RePEc Archive The World Bank. Bandur, A., 2012a. School-based management developments: challenges and impacts. J. Educ. Admin. 50, 845–873, http://dx.doi.org/10.1108/ 09578231211264711. Bandur, A., 2012b. School-based management developments and partnership: evidence from Indonesia. Int. J. Educ. Dev. 32, 316–328, http://dx.doi.org/ 10.1016/j.ijedudev.2011.05.007. Bandur, A., 2009. The implementation of school-based management in Indonesia: creating conflicts in regional levels. J. of NTT Stud. 1, 16–27. Bandur, A., Gamage, D.T., 2009. SBM policies and programs: improving teaching- learning environments and student achievements in Indonesia. Educ. Soc. 27, 51–75, http://dx.doi.org/10.7459/es/27.1.04. Bardhan, P., 2002. Decentralization of governance and development. J. Econ. Perspect. 16, 185–205. Barrera-Osorio, F., Fasih, T., Patrinos, H.A., Santiban˜ez, L., 2009. Decentralized Decision-Making in Schools: The Theory and Evidence on School-Based Management. The World Bank. Beasley, E., Huillery, E., 2014. Willing but unable: short-term experimental evidence on parent empowerment and school quality. In: Working Paper)Abdul Latif Jameel Poverty Action Lab. Bjork, C., 2003. Local Responses to decentralization policy in Indonesia. Comp. Educ. Rev. 47, 184–216, http://dx.doi.org/10.1086/376540. Blimpo, M.P., Evans, D.K., Lahire, N., 2015. Parental human capital and effective school management: evidence from The Gambia (conference paper). In: RISE Conference 2015, Research on Improving Systems in Education (RISE). Carnoy, M., 1999. Globalization and Education Reform: What Planners Need to Know. International Institute for Educational Planning (IIEP), UNESCO. Carnoy, M., Gove, A.K., Loeb, S., Marshall, J.H., Socias, M., 2008. How schools and students respond to school improvement programs: the case of Brazil’s PDE. Econ. Educ. Rev. 27, 22–38, http://dx.doi.org/10.1016/ j.econedurev.2006.04.005. J. Leer / International Journal of Educational Development 49 (2016) 80–90 89
  • 11. Chen, D., 2011. School-based management, school decision-making and education outcomes in Indonesia primary schools. In: World Bank Policy Research Working PaperWorld Bank. De Grauwe, A., 2005. Improving the quality of education through school-based management: learning from international experiences. Int. Rev. Educ. 51, 269–287, http://dx.doi.org/10.1007/s11159-005-7733-1. Di Gropello, E., Marshall, J.H., 2009. Decentralization and educational performance: evidence from the PROHECO Community School Program in rural Honduras. Educ. Econ. 19, 161–180, http://dx.doi.org/10.1080/ 09645290902992816. Duflo, E., Dupas, P., Kremer, M., 2014. School governance, teacher incentives, and pupil–teacher ratios: experimental evidence from Kenyan primary schools. In: No. No. 17939), NBER Working Paper. National Bureau of Economic Research. Faguet, J.-P., 2004. Does decentralization increase government responsiveness to local needs?: evidence from Bolivia. J. Public Econ. 88, 867–893, http:// dx.doi.org/10.1016/S0047-2727(02)00185-8. Faguet, J.-P., Sa´nchez, F., 2008. Decentralization’s effects on educational outcomes in Bolivia and Colombia. World Dev. 36, 1294–1316, http:// dx.doi.org/10.1016/j.worlddev.2007.06.021. Frankenberg, E., Karoly, L.A., Gertler, P., Achmad, S., Agung, L.G.N., Hatmadji, S.H., Sudharto, P., 1995. The 1993 Indonesian Family Life Survey: Overview and Field Report. Galiani, S., Gertler, P., Schargrodsky, E., 2008. School decentralization: helping the good get better, but leaving the poor behind. J. Public Econ. 92, 2106– 2120, http://dx.doi.org/10.1016/j.jpubeco.2008.05.004. Gertler, P., Patrinos, H., Rubio-Codina, M., 2008. Empowering parents to improve education: evidence from rural Mexico. In: Impact Evaluation Series Number 4. World Bank Policy Research Working Paper 3935. World Bank Publications, 1818 H Street NW; Washington, DC 20433. Gunnarsson, V., Orazem, P.F., Sa´nchez, M.A., Verdisco, A., 2009. Does local school control raise student outcomes? Evidence on the roles of school autonomy and parental participation. Econ. Devel. Cult. Change 58, 25–52, http:// dx.doi.org/10.1086/604704. Heyward, M., Cannon, R.A., 2011. Implementing school-based management in Indonesia. RTI Press, http://dx.doi.org/10.3768/rtipress.2011.op.0006.1109. Jimenez, E., Psacharopoulos, G., Jee-Peng, T., 1986. Financing education in developing countries: an exploration of policy options. In: No. 8226. The World Bank. Jimenez, E., Sawada, Y., 2014. Does community management help keep children in schools? Evidence Using Panel Data from El Salvador’s EDUCO Program. Economic Development and Cultural Change 62, 307–338, http://dx.doi.org/ 10.1086/674096. Jimenez, E., Sawada, Y., 1999. Do community-managed schools work? An evaluation of El Salvador’s EDUCO Program. World Bank Econ. Rev. 13, 415–441. King, E., Ozler, B., 2005. What’s decentralization got to do with learning? School autonomy student performance. In: Interfaces for Advanced Economic AnalysisKyoto University. Kristiansen, S., Pratikno, 2006. Decentralising education in Indonesia. Int. J. Educ. Dev. 26, 513–531, http://dx.doi.org/10.1016/j.ijedudev.2005.12.003. McEwan, P.J., Carnoy, M., 2000. The effectiveness and efficiency of private schools in Chile’s voucher system. Educ. Eval. Policy Anal. 22, 213–239, http://dx.doi.org/10.3102/01623737022003213. Meade, B., Gershberg, A.I., 2008. Making education reform work for the poor: accountability and decentralization in Latin America. J. Educ. Policy 23, 299– 322, http://dx.doi.org/10.1080/02680930801923823. Mundy, K., 2007. Global governance, educational change. Comp. Educ. 43, 339– 357, http://dx.doi.org/10.1080/03050060701556281. Mundy, K., 2002. Retrospect and prospect: education in a reforming World Bank. Int. J. Educ. Dev. 22, 483–508. OECD, 2013. PISA 2012 Results: Excellence through Equity: Giving Every Student the Chance to Succeed (Volume II). OECD Publishing, Paris. Parker, L., Raihani, R., 2011. Democratizing Indonesia through education? Community participation in Islamic schooling. Educ. Manage. Admin. Leadersh. 39, 712–732, http://dx.doi.org/10.1177/1741143211416389. Raihani, 2013. In: Routledge (Eds.), Creating Multicultural Citizens: A Portrayal of Contemporary Indonesian Education. first ed. Routledge, New York, NY. Raihani, 2007. Education reforms in Indonesia in the twenty-first century. Int. Educ. J. 8, 172–183. Riddell, A., 1998. Reforms of educational efficiency and quality in developing countries. Compare 28, 277–291. Santiban˜ez, L., Abreu-Lastra, R., O’Donoghue, J.L., 2014. School based management effects: resources or governance change? Evidence from Mexico. Econ. Educ. Rev. 39, 97–109, http://dx.doi.org/10.1016/ j.econedurev.2013.11.008. SMER. (Eds.), 2006. A Rapid Appraisal of the PKPS-BBM Education Sector: School Operational Assistance (BOS) Program 2005, SMERU Research Report. SMERU Research Institute, Jakarta. Suryadarma, D., 2012. How corruption diminishes the effectiveness of public spending on education in Indonesia. Bull. Indonesian Econ. Stud. 48, 85–100, http://dx.doi.org/10.1080/00074918.2012.654485. Toi, A., 2010. An empirical study of the effects of decentralization in Indonesian junior secondary education. Educ. Res. Policy Pract. 9, 107–125, http:// dx.doi.org/10.1007/s10671-010-9081-6. UNESCO, 2010. World Data on Education: Indonesia (No. VII Ed.) UNESCO— International Bureau of Education. Vernez, G., 2012. Implementation of school-based management in Indonesia. RAND, Santa Monica, CA. World Bank, 2015. World Bank and Education in Indonesia. International Bank for Reconstruction and Development/The World Bank, Indonesia. World Bank, 2013. Local Governance and Education Performance: A Survey of the Quality of Local Education Governance in 50 Indonesian Districts, East Asia and Pacific Region, Human Development. World Bank, Jakarta, Indonesia. World Bank, 2011. Learning for All: Investing in People’s Knowledge and Skills to Promote Development, Education Strategy 2020. World Bank, Washington, DC. Yeom, M., Acedo, C., Utomo, E., 2002. The reform of secondary education in Indonesia during the 1990s: basic education expansion and quality improvement through curriculum decentralization. Asia Pac. Educ. Rev. 3, 56–68. J. Leer / International Journal of Educational Development 49 (2016) 80–9090