The Metrics of Project Management Performance and PMBOK
TES for AG
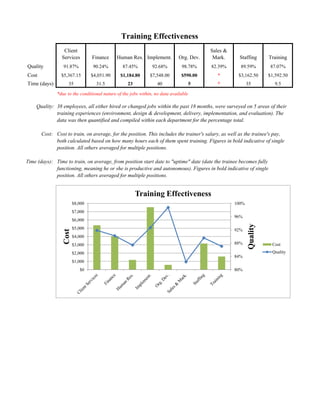
1. Client
Services Finance Human Res. Implement. Org. Dev.
Sales &
Mark. Staffing Training
Quality 91.87% 90.24% 87.45% 92.68% 98.78% 82.39% 89.59% 87.07%
Cost $5,367.15 $4,051.90 $1,184.80 $7,548.00 $590.00 * $3,162.50 $1,592.50
Time (days) 35 31.5 23 40 5 * 35 9.5
*due to the conditional nature of the jobs within, no data available
Quality: 38 employees, all either hired or changed jobs within the past 18 months, were surveyed on 5 areas of their
training experiences (environment, design & development, delivery, implementation, and evaluation). The
data was then quantified and compiled within each department for the percentage total.
Cost: Cost to train, on average, for the position. This includes the trainer's salary, as well as the trainee's pay,
both calculated based on how many hours each of them spent training. Figures in bold indicative of single
position. All others averaged for multiple positions.
Time (days): Time to train, on average, from position start date to "uptime" date (date the trainee becomes fully
functioning, meaning he or she is productive and autonomous). Figures in bold indicative of single
position. All others averaged for multiple positions.
Training Effectiveness
80%
84%
88%
92%
96%
100%
$0
$1,000
$2,000
$3,000
$4,000
$5,000
$6,000
$7,000
$8,000
Quality
Cost
Training Effectiveness
Cost
Quality