
Recomendados
Recomendados
Mais conteúdo relacionado
Semelhante a InfoGraphic - Sun View Progress Final.pptx
Semelhante a InfoGraphic - Sun View Progress Final.pptx (20)
Último
Último (20)
InfoGraphic - Sun View Progress Final.pptx
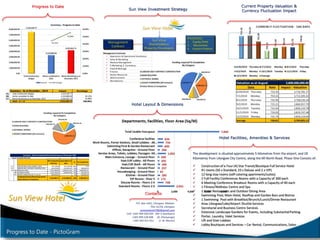
- 1. Progress to Date - PictoGram Summary - As at November , 2019 Amount Percentage (A) Total Construction Budget 7,524,930.77 (B) Works completed to Date 3,319,868.06 44.12% (C.) Works Remaining as at November 2019 4,205,062.71 55.88% Total - A + B 7,524,930.77 100.00% Current Property Valuation & Currency Fluctuation Impact Valuation as at August 2,800,000,000.00 Date Rate Impact - Valuation 6/20/2019 Thursday 753.34 3,716,781.27 7/1/2019 Monday 754.23 3,712,395.42 8/1/2019 Thursday 742.99 3,768,536.34 9/2/2019 Monday 725.21 3,860,937.79 10/1/2019 Tuesday 731.04 3,830,134.78 11/1/2019 Friday 733.03 3,819,747.48 12/2/2019 Monday 731.79 3,826,218.04 Average 738.81 3,789,895.12 Currency Fluctuation Spread - Impact on Valuation Hotel Layout & Dimensions Progress to Date Sun View Investment Strategy % To Completion 1.1 PRELIMINARIES AND GENERAL ITEMS 497,200.00 497,200.00 100% 0.00 1.2 LABOUR ONLY CONTRACT-CONSTRUCTION 623,434.89 243,385.44 39% 380,049.45 1.3 (A) MAIN BUILDING 4,617,096.69 1,928,613.53 42% 2,688,483.16 (B) EXTERNAL WORKS 1,187,199.19 650,669.09 55% 536,530.10 ( C) ROOM FURNISHING (All Inclusive) 600,000.00 - 0% 600,000.00 Completed Works/Remaining Works Value Works to Completion 7,524,930.77 3,319,868.06 44% 4,205,062.71 Summary - Works Completed/Works Remaining as at November 2019 VALUE OF WORK EXECUTED Bill of Quantity Estimate Expenditure to date Hotel Facilities, Amenities & Services Management Contract- Operations & Operational Excellence Sales & Marketing Revenue Management E-Marketing, E- Commerce, Food & Beverage Finance Human Resources Administration Maintenance Contacts
- 2. Progress to Date – Projected Financials Statement of Financial Position Statement of Financial Performance Nov-21 Nov-22 Nov-23 Nov-24 Nov--2025 USD USD USD USD USD SALES 6,021,591.00 6,623,750.10 7,286,125.11 8,014,737.62 8,976,506.14 COST OF SALES Total Cost of Sales 1,007,401.53 1,039,638.38 1,072,906.81 1,107,239.82 1,142,671.50 GROSS PROFIT 5,014,189.47 5,584,111.72 6,213,218.30 6,907,497.80 7,833,834.64 ADMINISTRATIVE & FIXED COSTS Total Admin & Fixed Cost 2,634,542.33 2,706,898.58 2,781,570.24 2,858,631.39 2,938,158.49 Tourism Levy (1%) 60,215.91 66,237.50 72,861.25 80,147.38 89,765.06 EARNINGS BEFORE INTEREST & TAX (EBIT) 2,319,431.23 2,810,975.64 3,358,786.81 3,968,719.03 4,805,911.09 Management Fees (Operations & Marketing) Total Management Fees 222,724.40 412,204.90 567,147.30 1,071,297.84 1,232,338.69 Income After Management Fees 2,096,706.84 2,398,770.74 2,791,639.51 2,897,421.20 3,573,572.39 Loan Interest 389,794.25 318,343.53 239,411.00 152,213.19 55,884.64 NET INCOME AFTER INTEREST 1,706,912.59 2,080,427.20 2,552,228.51 2,745,208.00 3,517,687.75 TAXATION 30% 512,073.78 624,128.16 765,668.55 823,562.40 1,055,306.32 NET INCOME 1,194,838.81 1,456,299.04 1,786,559.96 1,921,645.60 2,462,381.42 less Loan-Principal Repayment 682,347.62 753,798.33 832,730.87 919,928.67 1,015,518.83 SURPLUS/DEFICIT 512,491.19 702,500.71 953,829.09 1,001,716.93 1,446,862.59 STATEMENT OF FINANCIAL PERFORMANCE - Projected Assets Nov--2021 Nov--2022 Nov--2023 Nov--2024 Nov--2025 Current Assets Cash in bank - 1,677,365.47 1,919,016.59 2,233,311.61 2,858,857.91 Accounts receivable - 419,341.37 479,754.15 558,327.90 714,714.48 Inventory - Prepaid expenses - - - - - Total Current Assets - 2,096,706.84 2,398,770.74 2,791,639.51 3,573,572.39 Fixed Assets Land 480,000.00 480,000.00 480,000.00 480,000.00 480,000.00 Buildings 7,612,841.01 7,612,841.01 7,612,841.01 7,612,841.01 7,612,841.01 Furniture & fixtures 600,000.00 600,000.00 600,000.00 600,000.00 600,000.00 Vehicles 180,000.00 180,000.00 180,000.00 180,000.00 180,000.00 Other fixed assets - (LESS accumulated depreciation - (415,513.64) (831,027.28) (1,246,540.92) (2,077,568.20) Total Fixed Assets (net of depreciation) 8,872,841.01 8,457,327.37 8,041,813.73 7,626,300.09 6,795,272.81 Other Assets Goodwill - 1,055,403.42 1,252,870.14 1,354,332.15 1,555,326.78 Other - - - - - Total Other Assets - 1,055,403.42 1,252,870.14 1,354,332.15 1,555,326.78 TOTAL Assets 8,872,841.01 11,609,437.63 11,693,454.60 11,772,271.75 11,924,171.98 Liabilities and Equity Current Liabilities Accounts payable - - - - - Interest payable - 389,794.25 318,343.53 239,411.00 55,884.64 Current part, long-term debt - 682,347.62 753,798.33 832,730.87 1,015,518.83 Other current liabilities - - - - - Total Current Liabilities - 1,072,141.86 1,072,141.86 1,072,141.86 1,071,403.48 Long-term Debt Long term debt 4,205,062.71 3,522,715.09 2,768,916.76 1,936,185.89 920,667.06 Total Long-term Debt 4,205,062.71 3,522,715.09 2,768,916.76 1,936,185.89 920,667.06 Total Liabilities 4,205,062.71 4,594,856.96 3,841,058.62 3,008,327.76 1,992,070.54 Owners' Equity Invested capital 4,667,778.30 5,990,015.70 6,525,767.11 7,044,446.34 7,429,932.53 Retained earnings - beginning - - - - - Retained earnings - current - 1,024,564.97 1,326,628.87 1,719,497.65 2,502,168.92 Total Owners' Equity 4,667,778.30 7,014,580.67 7,852,395.98 8,763,943.99 9,932,101.44 Total Liabilities & Equity 8,872,841.01 11,609,437.63 11,693,454.60 11,772,271.75 11,924,171.98 STATEMENT OF FINANCIAL POSITION Nov--2021 Nov--2022 Nov--2023 Nov--2024 Nov--2025 RECEIPTS Balance B/F (5,843,884.41) (3,833,562.45) (687,336.11) 3,210,170.69 9,324,077.13 ACCOMODATION 2,745,207 3,468,405.60 3,815,246.16 2,601,304.20 4,308,684.66 CONFERENCE & FUNCTIONS 1,395,744 1,995,840.00 2,195,424.00 3,179,371.80 2,861,434.62 FOOD & BEVERAGES 1,695,150 2,550,240.00 2,805,264.00 3,847,039.88 1,646,568.00 OTHER SOURCES 185,490 224,532.00 246,985.20 2,213,719.20 2,103,948.00 Total Receipts 177,707 4,405,455.15 8,375,583.25 15,051,605.77 20,244,712.41 PAYMENT Capital TOTAL PAYMENTS 4,011,269 5,092,791.27 5,165,412.55 5,727,528.65 5,944,659.67 Net cash Flow (3,833,562) (687,336.11) 3,210,170.69 9,324,077.13 14,300,052.74 Principal Loan Payment - - - - - Balance B/F (3,833,562) (687,336.11) 3,210,170.69 9,324,077.13 14,300,052.74 STATEMENT OF Cash Flows Statement of Financial CASH FLOWS NPV 4,584,350.66 $ IRR 27% MIRR 20% ROI 210% Key Ratios Key RATIOS
- 3. Progress to Date – Photo Montage Architectural Renderings - Hotel Architectural Renderings - Apartments Rooms – Supplier’s Catalogue Photo Montage – Progress on Site as at August, 2019
- 4. Progress to Date – Summary – To Completion/To Date in USD in % of TOTAL FUNDING Total Funding Required to Completion 4,205,062.71 55.88% Sources Of Funds - Required To Completion - Nov 2019 Labour only Contract - Construction 380,049.45 5.05% Completion Construction - Main Hotel 2,688,483.16 35.73% Completion -External Works 536,530.10 7.13% Hotel Furnishings & Fittings 600,000.00 7.97% Preliminaries & General Items 497,200.00 14.98% Labour Only Contract 243,385.44 7.33% Substructure 461,418.93 13.90% Prefab Super Steel Structure 1,467,194.60 44.19% External Works 650,669.09 19.60% Sources of Funds in USD in % of TOTAL COST Expenditure to Date - Private Equity 3,319,868.06 44.12% Sources Of Funds Total Project Development Costs - Excluding Cost of Land in USD in % of TOTAL COST Bill of Quanties 7,524,930.77 100.00% Sources Of Funds Preliminaries & General Items 497,200.00 6.61% Labour Only Contract 623,434.89 8.28% Hotel Construction 4,617,096.69 61.36% External Works 1,187,199.19 15.78% Furnishing, Fittings & Equipmet (FF&E) 600,000.00 7.97% Sources Of Funds Investment to Date, Including Land in USD in % of TOTAL COST Total Investment to Date, incl Land 3,799,868.06 50.50% Land Acquisition 480,000.00 12.63% Expenditure to Date - Private Equity 3,319,868.06 87.37% 1 Total Investmnt tp Date (November 2019 3,799,868.06 50.50% 2 Development Valuation - as at August 2019 3,789,895.12 50.36% Comments 1 2 Percentage of Total Cost - As per Bill of Quanties Percentage of Total Cost - As per Bill of Quanties Estimated Investment – Total Bill of Quantites (BoQ) Funding Required to Completion Total Investment Incl Land Acquisition Expenditure to Date – Private Equity
- 5. Progress to Date – Risk Mitigation Management Contract- Full Service Boutique and Transit Hotel Operations & Operational Excellence Sales & Marketing - Local,Regional & International) Revenue Management E-Marketing, E- Commerce, Food & Beverage Finance Human Resources Administration Maintenance Risk Mitigation Operational, Sales & Marketing Risks Insurance - All Risk Workers Compensation Insurance Professional Liability Insurance Delay in completion or delay in start-up insurance Subcontractor default insurance Supply chain risks for contractors and contingent business interruption (CBI) insurance Construction, Sub-Contractor Risks Sub-Contractor Surety/Performance Bonds Electrical/Solar Contractor Road Works Contractor Tiling, Plumbing & Sanitation Fittings & Furnishings Landscaping Heating & Cooling Construction Loan Risks Land acquisition and titling risks - Title Deed Performance risks (by statutory and approving authorities. Service providers Statutory Compliance with Stakeholders Funding risks Marketing Risks. Quality and safety performance risks: Construction OrganoGram Hotel Staffing OrganoGram Finance & Admin Management Structure