1 pollen morphology and pollen elemental composition of selected philippine n...
16,Sapna et al2014, Ulmus RAPD
1. ESTIMATION OF GENETIC DIVERSITY IN PROGENIES OF SELECTED GENOTYPES OF
ULMUS VILLOSA BRANDIS USING RAPD MARKERS
SAPNA THAKUR, I. K. THAKUR, N. B. SINGH, J. P. SHARMA AND M. SANKANUR
Department of Tree Improvement and Genetic Resources, College of Forestry
Dr. Y.S. Parmar University of Horticulture and Forestry, Nauni, Solan- 173 230 Himachal Pradesh, INDIA
email: ikuhf@rediffmail.com
ABSTRACT
Molecular diversity among 23 promising progenies of Ulmus villosa, which were raised from the seeds collected from
various seed sources in Himachal Pradesh (India), was estimated using 10 RAPD primers. A total of 57 markers were
generated, all of the 10 primers showed 100 per cent polymorphism. The similarity coefficient among 23 progenies of
U. villosa ranged from 0.00 to 0.70. In which, progeny Jugahan-T was found to be the most divergent which separated3
itselffromrestof theprogeniesatsimilarityvalue(0.04)andcouldbeusedasaparentinhybridizationprogrammeand
furtherimprovementprogrammes.Theprogeniesweregroupedinto4clusters.TheclusterIIconsistedmaximumof12
progenies followed by cluster III (5 progenies), cluster IV (4 progenies) whereas cluster I consisted of single progeny.
RAPDanalysisprovedhelpfulforestimatingthemagnitudeofgeneticdiversityatmolecularlevel.
Keywords: RAPD,Ulmusvillosa,Progenies,Geneticdiversity.
Studies on molecular diversity among 23 promising progenies ofUlmusvillosarevealedJugahan–T3
tobethemostdivergentandcouldbeusedasaparent inhybridizationprogramme.
Introduction considered as one of the most important agro-forestry
trees in the Kashmir region. It also has a great potentialThe elms (Ulmus L.) are represented by
outside its natural range for use on degraded land (Singh,approximately 35 species distributed throughout the
1982; Bhardwaj and Mishra, 2005). However, the Dutchtemperate regions of the Northern Hemisphere and into
elm disease (Kalas et al., 2006), caused by certain fungithe subtropics of Central America and Southeast Asia,
(Ophiostoma spp), is one of the most serious diseasesincluding six species in eastern North America (Pooler
known to trees, has ravaged elm populations all overand Townsend, 2005). There are five species of Ulmus
Europe. This poses a challenge for future conservation offound in India, four namely U. wallichiana, U. villosa, U.
elm, which in turn necessitates more knowledge aboutpumila and U. chumlia from N.W Himalaya and U.
the distribution of variation in adaptive traits in thelanceifolia from north-eastern regions of the country.
species. ApartfromthisthespeciesbeingoneofthecoldHimalayan elms are the source of best fodder and quality
hardy and disease resistant species of elm, has beentimber. U. wallichiana is lopped for fodder which causes
introduced in Europe and North America as anthe depletion of regeneration. It is already categorized as
ornamental tree and for breeding purposes. Some clonesv u l n e r a b l e s p e c i e s i n R e d D a t a B o o k
of this species have proved resistant against Dutch elm(www.iucnredlist.org). Ulmus villosa Brandis, commonly
disease (DED) that can be used in breeding programmesknown as marinoo in India, is a small or medium sized
for the development of disease resistant hybridsdeciduous tree belonging to family Ulmaceae (Melville
(Santamour,1979).and Heybroek, 1971). It is one of the more distinctive
Asiatic elms and a species capable of remarkable Molecular techniques have been found to be more
longevity (Singh, 1991). It grows up to 20-30 m in height useful and accurate for determination of both
at elevations from 1200 m to 2500 m with a scattered interspecific and intraspecific genetic variation in plants.
distributioninthenorthwesternHimalayas. DNA markers can be used early in tree growth and
development to predict dissimilar genetic backgroundsThe seed viability is high but seed longevity is low.
and to determine which traits a particular individual isIt finds greater favour on account of its multiplicity of
carryingbyexaminingthesesmallsegments.Markerscanuses and fast growth habit. It is a multipurpose
discern between single or multi-locus modifications asagroforestry tree species producing fodder, fuel and
well as dominant or co-dominant alterations in a singletimber. Inspite of its immense popularity and multiplicity
individual. When applied to the conservation andof its uses less attention has been paid on improvement
breeding of fine hardwoods many diverse DNA markerof this species (Melville and Heybroek, 1971). It is
Indian Forester, 140 (12) : 1221-1229, 2014
http://www.indianforester.co.in
ISSN No. 0019-4816 (Print)
ISSN No. 2321-094X (Online)
2. system types have been utilized. DNA markers allow for Ulmusamericanaclones.
more accurate determination of the region of origin for a There is no evidence regarding molecular
particulartreeanddetectionofspecificgeneflowevents. characterization of the species. Thus the aim of this work
The many DNA marker techniques are similar in that was to study genetic diversity in progenies of selected
these canbe used even where there is a single nucleotide genotypes in Ulmus villosa Brandis using RAPD markers
change in a gene or tandem DNA repeat. Unlike and to assess conservation strategies for the species. In
morphological markers these changes are not apparent the present investigation RAPD markers has been used
in the phenotype of the individual and are often for assay in genetic variation at molecular level of 23
insignificant in its physiological development. Molecular progenies to select the best genotypes on the basis of
markers has been used to understand hybridization and their progeny performance. This may be perhaps the first
species differentiation in forest trees such as Acer (Joung scientific paper to deal with the study of genetic diversity
et al., 2001; Skepner and Krane, 1998), Betula (Palme et in progenies of selected genotypes in U. villosa which
al., 2004; Anamthawat-Jonsson and Thorsson, 2003), were collected from various seed sources of the state of
Liriodendrone (Li and Wang, 2002), Platanus (Vigouroux HimachalPradeshinIndia.
et al., 1997), Fagus (Ohyama et al., 1999; Gailing and Von
MaterialandMethods
Wuelisch, 2004), Tilia (Fineschi et al., 2003), Olea (Claros
Plantmaterialet al., 2000; Fabri et al., 1995), Ficus (Hadia et al., 2008).
Mylett et al. (2007) reported that RAPDs were used to Well matured seeds were collected from five
indicate genetic variability between individual Tilia mother trees (15-25cm DBH) each at six sites viz., S -Jadh1
cordata Mill. clusters within the same woodland and (800m), S -Jugahan (800m), S -Jhidi (1089m) forest area2 3
surrounding areas. In F. excelsior (Pvingila et al., 2005) it in Mandi district and S -Jagoti (1824m), S -Katouch4 5
was noted thatthe unique RAPD phenotype, the basis for (1900m) and S -Andhra (2200m) area from Pabbar valley6
individual tree identification, indicated that RAPD in Shimla district of Himachal Pradesh. The progenies
markers can indeed confirm origin of a given forest tree. were then raised under nursery conditions in the
A simple, efficient and genetically stable method for P. experimental field. Twenty three best performing
occidentalis was recently presented using RAPDs by Sun progenies(Table1)wereselectedforthestudies.
etal. (2009) and only with RAPD in Dalbergia sissoo (Rout
CollectionofplantmaterialandgenomicDNAextractionet al., 2003) was done. Variation in Melientha suavis was
Fresh and disease free young leaves weredetected with RAPD (Prathepha, 2000). It is also used as
collected from these selected progenies for moleculara Randomly Amplified Polymorphic DNA (RAPD)
markers, in particular, have been successfully employed
for determination of intraspecies genetic diversity in
several plants (Li et al., 2008; Goodall-Copestake et al.,
2005; Nanda etal., 2004; Amri and Mamboya, 2012), sex
determination in dioceous tree Salix viminalis (Alstrom-
Rapaport et al., 1998). Random amplified polymorphic
DNA (RAPD) analysis has proved useful for estimating
genetic diversity particularly to assist in the conservation
of rare species and plant genetic resources (Anderson
and Fairbanks, 1990). The use of dominant markers to
assess genetic variability between individuals and
populations is promising because many polymorphic loci
can be obtained fairly easily, in a relatively short time and
at low cost, without any prior knowledge of the genome
of the species under study (Nybom and Bartish, 2000;
Nybom, 2004). RAPD analysis in particular has proven to
be a rapid and efficient means of genome mapping
(Williams et al., 1990) and have been successfully used
for differentiating species of a genus based on their
similarities and geographical proximities (Thomas et al.,
2001). Pooler and Townsend (2005) indicated success
with AFLP in determining geographic origins and genetic
distances between selections of Ulmus laevis Palli and
Table 1: Details of Ulmus villosa 23 progenies used in RAPD studies
S. no. Progenies code Seed source District
1. Jh-T2 Jhidi, Tree no. 2 Mandi
2. Jh-T3 Jhidi, Tree no. 3
3. Jh-T5 Jhidi, Tree no. 5
4. Ju-T1 Jugahan, Tree no. 1
5. Ju-T2 Jugahan, Tree no. 2
6. Ju-T3 Jugahan, Tree no. 3
7. Ju-T4 Jugahan, Tree no. 4
8. Ju-T5 Jugahan, Tree no. 5
9. Ja-T1 Jadh, Tree no. 1
10. Ja-T2 Jadh, Tree no. 2
11. Ja-T3 Jadh, Tree no. 3
12. Ja-T1 Jadh, Tree no. 4
13. Ja-T1 Jadh, Tree no. 5
14. Ka-T1 Katouch, Tree no.1 Shimla
15. Ka-T2 Katouch, Tree no.2
16. Ka-T3 Katouch, Tree no.3
17. Ka-T4 Katouch, Tree no.4
18. Ka-T5 Katouch, Tree no.5
19. Jag-T1 Jagoti, Tree no.1
20. Jag-T2 Jagoti, Tree no.2
21. Jag-T3 Jagoti, Tree no.3
22. Jag-T4 Jagoti, Tree no.4
23. Jag-T5 Jagoti, Tree no.5
1222 The Indian Forester [December
3. Estimation of genetic diversity in progenies of selected genotypes of Ulmus villosa Brandis .... 12232014]
variability studies and carried to the laboratory in brown
paper bags within 2-3 hours of collection and kept in
deep freezer (- 20°C) for further DNA extraction. Fresh
leaf tissue (~ 0.5 g) was crushed in 7 ml extraction buffer
(10 per cent (w/v) CTAB (N-cetyle, N, N-trimethyle-
ammonium bromide), 0.5M EDTA (pH 8.0), 5M NaCl and
0
1M Tris pH 8.0. The powder was either stored at -40 C or
used for DNA isolation immediately. Total genomic DNA
was isolated using the Doyle and Doyle (1987) method
with slight modification made in buffer concentrations.
The quality of DNA was tested on 0.8% agarose gel and
quantification was done using Perkin Elmer UV/VIS
spectrophotometer and diluted to 5ng/µl for further PCR
(Polymerase chain reaction) amplification using CR
Corbettthermocycler.
PCRamplificationandelectrophoresis
Ten decamer primers were used for the current
study (Table 2). DNA was amplified by PCR amplification Results
reaction. The 25µl of reaction mixture contained 20ng of RAPDbandingpattern
DNA, 0.75 units of Taq DNA polymerase, 2.5µl of 10X Taq
Each primer generated a unique set of
buffer (50mM MgCl , 10mM Tris-Cl), 1.25µl of pooled2
amplification products revealing polymorphism and high
dNTP's (2.5mM each) and 10ng of primer. PCR conditions
levelsof geneticdiversityamong differentprogenies. The
used for RAPD amplification included initial denaturation
number of bands recognized by the software, Alpha0
for 3 min at 94 C followed by 45 cycles of amplification
Imagerfor each primer rangedfrom 3 (OPA-04) to 8 (0PA-0
(denaturationat92 Cfor45seconds,annealingofprimer
07) (Table 2). All the ten primers used in this analysis0 0
at 36 C for 1min and primer amplification at 72 C for 2 yielded a total of 57 scorable bands with an average of0
min)andfinalextensionat72 Cfor10min. 5.70 bands per primer. All the scorable bands showed
Amplification products stained in ethidium polymorphism resulting in 100 % polymorphism among
bromide were separated on 2 per cent agarose gel using 23 progenies (Tables 2 and 3). The banding pattern
1X TBE buffer (Tris HCI pH 8.0, Boric Acid, Ethylene generated by each RAPD primer for 23 progenies is
diamine-tetra acetic acid) on horizontal gel presented in Table 4. The mean coefficient value of any
electrophoresis apparatus and photographed in Alpha progenygaveanideaaboutitsoverallrelatednesswithall
Imager gel documentation system. 1kb and 100bp DNA other progenies in the study. The coefficient values
mass ladder were used as molecular weight markers in ranged from 0.04 to 0.70 (Table 6). This indicated a fair
first and last well of respective gel. Data analysis and range of variability in the similarity coefficient values
clustering was done by UPGMA using SAHN module of suggesting a broad genetic base of 23 progenies included
NTSYSpc.Version2.02e(Rohlf,1998). in the experiment. Maximum similarity (70%) was
S. No Parameters Remarks
1 Total number of primers examined 10
2 Total number of polymorphic primers 10
3 Total number of bands amplified from
polymorphic primers
57
4 Total number of polymorphic bands
identified
57
5 Total number of monomorphic bands 0
6 Average number of polymorphic bands
per primer
5.70
7 Per cent of total polymorphic bands 100%
8 Number of primers exhibited 100 %
polymorphism
10
9 Size range of RAPD markers 147.10 bp to
2901.97 bp
10 Number of amplification products per
primer
3 (OPA - 04) to
8 (OPA - 07)
Table 2: Summary of RAPD amplified products obtained from 23
progeny of Ulmus villosa
Table 3: Total numbers of amplified and polymorphic fragments generated by PCR using RAPD primers
S. No Primer
name
Total no. of
scorable
bands
Total no. of
polymorphic
bands
Total no. of
monomorphic
bands
Polymorphism (%)
100X
y
x
Size range of
amplified products
(bp)
1 OPA-01 6 6 0 100 147.10 - 1082.65
2 OPA- 04 3 3 0 100 151.83 - 246.77
3 0PA- 05 5 5 0 100 593.75 - 2901.97
4 OPA- 07 8 8 0 100 156.91 - 2050.97
5 OPA- 09 6 6 0 100 187.72 - 957.76
6 OPC- 08 7 7 0 100 226.70 - 874.90
7 OPC- 11 4 4 0 100 203.07 - 584.67
8 OPB-11 6 6 0 100 182.11 - 2086.89
9 OPL- 06 6 6 0 100 278.63 - 814.73
10 OPS- 15 6 6 0 100 183.98 - 2027.10
TOTAL 57 57 0 100 147.10 - 2901.97
4. 1224 The Indian Forester [December
observed between Jag-T and Jag-T . However, the Jhidi-T , Jadh-T , Jhidi-T and Katouch-T and showing 432 3 1 5 5 4
minimum similarity coefficient values (0.00) were percentsimilaritywiththerestoftheprogenies.
observed in few progenies. The inference of Table 5 Discussion
shows the informative RAPD markers specific for a
Molecular techniques have been found to be more
particular progeny. Primer OPA-05 and OPA-07 produced
useful and accurate for determination of both
unique bands of size approximately 708.20 bp and
interspecific and intraspecific genetic variation in plants.
156.91 bp for the JuT (Jugahan), respectively. These1
Randomly amplified polymorphic DNA (RAPD) markers,
informative primers producing unique bands for a
in particular, have been successfully employed for
particular progeny can be specifically used for the study
determination of intraspecies genetic diversity in several
ofparticulargenotype.
plants. RAPD analysis has been successfully used for
Clusteranalysis differentiating species of a genus based on their
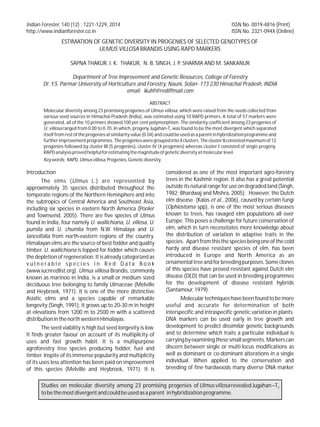
similarities and geographical proximities (Thomas et al.,Dendrogram was created using the similarity
2001). In the present investigation RAPD markers usedcoefficient and un-weighted pair group method with
for assay in genetic variation at molecular level showedarithmetic average (UPGMA) (Fig. 1). A critical perusal of
that RAPDs were informative for revealing relationshipdendrogram reveals that the distribution of various
baseduponsimilaritywithinreferencesetofprogenies.progenies into clusters and within cluster was random.
The dendrogram exhibited 4 clear clusters. According to A perusal of the data given in Table 2 revealed that
dendrogram atsimilarity index value 0.04 Jugahan-T was3 all ten primers used were found to be polymorphic and
separated from the rest of all progenies giving amplified the genomic DNA of 23 progenies of Ulmus
information about its most diverse nature, which is villosa successfully. From the results of RAPD profiling
categorized as cluster I. The remaining progenies number of RAPD markers generated per primer varied
exhibited in 3 clear clusters. Overall cluster I was found to from 3 to 8 because of primer sequence and due to
be 4 per cent similar with cluster II, III and IV. Cluster II is individual progeny (Table 2). All 10 primers produced
the major cluster having 12 progenies viz., Jhidi - T ,3 distinct banding pattern for all the 23 progenies. 57
Jugahan-T and T , Jadh-T , T and T , Jugahan-T amplified products were detected and all were found to1 5 1 4 2 4,
KatouchT , T and T , Jugahan-T and Jadh-T , which be polymorphic. Such a high level of polymorphism2 3 5 2 3
exhibited 31 and 43 per cent similarity with cluster III and reflects the outcrossing nature of the species. Presently
IV. Cluster III comprises of 6 progenies viz., Katouch-T , there seem to be no such studies conducted in U. villosa.1
However, these findings receive support from highJagoti- T , T , T , T and T , having 43 per cent similarity1 2 3 4 5
frequencies of polymorphism of 78.30% in Melienthawith cluster IV Cluster IV comprised of 4 progenies viz..
JhT1
JaT5
JhT5
KaT4
JhT3
JuT1
JuT5
JaT1
JaT4
JaT2
JuT4
KaT2
KaT3
KaT5
JuT2
JaT3
KaT1
JagT2
JagT3
JagT1
JagT4
JuT3
0.04 0.20 0.37 0.53 0.70
Coefficient
4
2
3
1
Fig. 1: Dendrogram based on UPGMA analysis 23 progenies of Ulmus villosa using RAPD markers
5. Estimation of genetic diversity in progenies of selected genotypes of Ulmus villosa Brandis .... 12252014]
suavis (Prathepha, 2000). Fourteen random RAPD
primersamplified118loci,averageofeachprimersis8.4,
83 fragments (at a proportion of 70.34%) were
polymorphic at the individual level in Ulmus pumila (Li et
al., 2008). In Pterocarpus angolensis 75.3%
polymorphismwasdetected(AmriandMamboya,2012).
Similarly, Pharmawati et al. (2004) reported a high level
of polymorphism, 99.39% for RAPD and 99.51% for ISSR,
between Grevillea species. Twenty-eight per cent of
genetic variations were found within populations in
Melientha suavis (Prathepha, 2000). Goodall-Copestake
et al. (2005) studied molecular markers and ex-situ
conservation of the European elms (Ulmus spp.) using
the 5 RAPD and 3 ISSR markers which yielded a total of
102 distinguishable bands and out of these 60 scored
bands gave clear, reproducible, polymorphic characters
which were scored as present or absent. Similarly Claros
et al. (2000) observed 60 markers in olive-tree (Olea
europaea L.) and 62 markers in Ficus polymorphic loci
withRAPDmarkerstodifferentiatethevarieties(Hadiaet
al., 2008). These findings also find support from Ma et al.
(2012) in Elymus sibiricus where they detected 291 RAPD
polymorphic loci in 93 samples. The percentage of
polymorphicbandswas79%.
Jaccard's similarly correlation coefficient value
ranged from 0.00 to 0.70. This suggested a fair range of
variability in the similarity coefficient values indicating a
broad genetic base of Ulmus villosa progenies. The
highest value (0.70) was observed between Jag-T and3
Jag-T which shows that they almost have the same2
genetic constituents. Lowest similarity (0.00) was
exhibited between some progenies. It may be attributed
to the fact that all of those belong to different areas with
different origin. Earlier studies by Weiguo and Yile (2004)
while studying the genetic diversity in genus Morus using
Table 4: Banding pattern of 10 RAPD markers in 23 progenies of Ulmus villosa
JhT2 JhT3 JhT5 JuT1 JuT2 JuT3 JuT4 JuT5 JaT1 JaT2 JaT3 JaT4 JaT5 KaT1 KaT2 KaT3 KaT4 KaT5 JagT1 JagT2 JagT3 JagT4 JagT5
A P A P A P A P A P A P A P A P A P A P A P A P A P A P A P A P A P A P A P A P A P A P A P
OPA-01 6 0 6 6 6 0 6 6 6 0 6 0 6 6 6 6 6 6 6 6 6 1 6 6 6 0 6 3 6 3 6 3 6 0 6 3 6 0 6 3 6 3 6 0 6 3
OPA- 04 3 0 3 0 3 0 3 3 3 0 3 1 3 3 3 3 3 3 3 3 3 0 3 0 3 3 3 1 3 2 3 2 3 0 3 3 3 3 3 2 3 1 3 2 3 3
0PA- 05 5 0 5 3 5 0 5 5 5 0 5 0 5 2 5 0 5 1 5 0 5 0 5 0 5 0 5 2 5 3 5 0 5 0 5 3 5 2 5 3 5 3 5 4 5 4
OPA- 07 8 0 8 1 8 0 8 5 8 1 8 0 8 1 8 2 8 0 8 2 8 0 8 0 8 0 8 1 8 4 8 3 8 0 8 4 8 2 8 2 8 1 8 3 8 1
OPA- 09 6 0 6 2 0 0 6 4 6 2 6 0 6 4 6 4 6 0 6 2 6 3 6 2 6 0 6 2 6 0 6 0 6 1 6 2 6 1 6 0 6 2 6 2 6 2
OPC- 08 7 0 7 1 7 0 7 0 7 1 7 0 7 3 7 2 7 0 7 0 7 1 7 1 7 0 7 0 7 0 7 1 7 0 7 2 7 2 7 2 7 2 7 2 7 0
OPC- 11 4 0 4 2 4 0 4 2 4 2 4 0 4 1 4 4 4 3 4 3 4 2 4 3 4 0 4 0 4 2 4 2 4 0 4 1 4 1 4 1 4 1 4 0 4 1
OPB-11 6 0 6 5 6 0 6 5 6 2 6 0 6 0 6 6 6 5 6 4 6 4 6 4 6 0 6 0 6 6 6 5 6 0 6 3 6 1 6 1 6 1 6 1 6 1
OPL- 06 6 4 6 0 6 3 6 5 6 0 6 0 6 6 6 6 6 5 6 5 6 0 6 5 6 5 6 0 6 5 6 0 6 4 6 0 6 1 6 2 6 2 6 2 6 0
OPS- 15 6 0 6 5 6 6 5 6 4 6 0 6 0 6 6 6 5 6 3 6 4 6 5 6 0 6 0 6 6 6 4 6 0 6 3 6 1 6 1 6 1 6 1 6 1
Total 4 25 3 40 12 1 26 39 28 28 15 26 8 9 31 20 5 24 14 17 17 17 16
A= Amplified P= Polymorphic
Table 5: Informative RAPD markers specific for a particular progeny
Primer Approximate size of DNA band Progeny
OPA-05 708.20 bp Jugahan, tree number 1
(Ju-T1)OPA-07 156.91bp
Fig. 2: RAPD fingerprints of 23 progenies revealed by OPA-09
Fig. 3: RAPD fingerprints of 23 progenies revealed by OPB-11
Fig. 4: RAPD fingerprints of 23 progenies revealed by OPS-15
Fig. 5: RAPD fingerprints of 23 progenies revealed by OPA-05
6. 1226 The Indian Forester [December
RAPD markers, revealed the highest similarity (0.9912) closely related to the north American species than to the
between T and T (Thailand). The result indicated that southAmericanP.pallidaorP.chilensis.11 12
they almost have the same genetic constituents. The The dendrogram exhibited four clear clusters and
least similarity between Broussonetia papyrifera and according to it Jugahan-T (at similarity index value 0.04)3
Yaan 3 was ascribed to their genome difference because was separated from the rest of all progenies giving
B. papyrifera and Yaan 3 were from differentgenusbased information about its most diverse nature, which is
on the molecular Jaccard matrix in molecular categorized as cluster I. The remaining progenies
characterization of mulberry germplasm using RAPD exhibited in 3 clear clusters. Overall cluster I was found to
primers. Similarly Ozrenk et al. (2010) reported that the be 4 per cent similar with cluster II, III and IV. Cluster II is
most similar genotypes (0.93) were D5 (a genotype from the major cluster having 12 progenies viz., Jhidi - T ,3
Erzincan) and DE5 (a genotype from Elazig) followed by Jugahan-T and T , Jadh-T , T and T , Jugahan-T1 5 1 4 2 4,
D6 and D7 (twogenotypesfrom Erzincan)(0.90) and they KatouchT , T and T , Jugahan-T and Jadh-T , which2 3 5 2 3
concluded that the genetic similarities among the
exhibited 31 and 43 per cent similarity with cluster III and
genotypes grown in the same region were generally
IV. Cluster III comprises of 6 progenies viz., Katouch-T ,1
found close because they had been reproduced from the
Jagoti- T , T , T , T and T , having 43 per cent similarity1 2 3 4 5
similar genotypes. On the other hand different adapted
with cluster IV Cluster IV comprised of 4 progenies viz..
genotypes from the same region could be the
Jhidi-T , Jadh-T , Jhidi-T and Katouch-T and showing 431 5 5 4
introductions from various other regions. Jaccard
percentsimilaritywiththerestoftheprogenies.similarity coefficient ranged from 0.66 to 0.95 showing a
These results are in conformity with the findings ofwide range of variability among the clones of Dalbergia
Nanda et al. (2004). They also reported similar studies insissoo as analysed by RAPD markers. One more similar
Acacia. Genetic similarity matrix coefficient indicatedstudy was carried out by Sherry et al. (2011) in Prosopis
that Acacia catechu had about 11%, 29% and 31%spp. and reported that highest similarity was shown
similarity with A. mollissima, A. arabica and A.between the north American species, P. articulata, P.
farensiana, respectively. The cluster analysis indicatedvelutina, P. glandulosa and P. laevigata with an index of
that six species of Acacia formed two major clusters. The0.67 between them. Similarly, the index between all the
first major cluster represented by only one species eachnorth American species selected in the study was
i.e. A. arabica. Second major cluster was represented byrelatively high showing a strong relation in terms of
five species i.e. A. catechu, A. farnesiana, A.geographical proximity. The distance between P. pallida
auriculiformis, A. concinna and A. mollissima. A.andP.juliforawasonly0.27comparedwith0.46between
farnesiana and A. catechu representing a minor clusterP. juliflora and P. velutina. P. julifora appeared to be more
Table 6: Similarity coefficient values of RAPD data using Jaccard's Similarity correlation coefficient
Site JhT2 JhT3 JhT5 JuT1 JuT2 JuT3 JuT4 JuT5 JaT1 JaT2 JaT3 JaT4 JaT5 KaT1 KaT2 KaT3 KaT4 KaT5 JagT1 JagT2 JagT3 JagT4 JagT5
JhT2 1.00
JhT3 0.00 1.00
JhT5 0.40 0.00 1.00
JuT1 0.10 0.54 0.07 1.00
JuT2 0.00 0.23 0.00 0.18 1.00
JuT3 0.00 0.00 0.00 0.02 0.00 1.00
JuT4 0.15 0.34 0.11 0.50 0.11 0.03 1.00
JuT5 0.10 0.52 0.07 0.68 0.27 0.02 0.54 1.00
JaT1 0.14 0.47 0.10 0.58 0.25 0.03 0.42 0.67 1.00
JaT2 0.14 0.33 0.11 0.52 0.30 0.03 0.47 0.65 0.66 1.00
JaT3 0.00 0.29 0.00 0.25 0.42 0.00 0.13 0.31 0.34 0.35 1.00
JaT4 0.15 0.45 0.11 0.46 0.26 0.00 0.36 0.58 0.68 0.65 0.51 1.00
JaT5 0.50 0.00 0.37 0.20 0.00 0.12 0.30 0.20 0.28 0.29 0.00 0.17 1.00
KaT1 0.00 0.25 0.00 0.19 0.05 0.11 0.29 0.14 0.15 0.16 0.09 0.12 0.06 1.00
KaT2 0.09 0.47 0.09 0.57 0.26 0.03 0.32 0.55 0.59 0.45 0.31 0.46 0.18 0.21 1.00
KaT3 0.00 0.36 0.00 0.36 0.33 0.05 0.17 0.40 0.41 0.34 0.29 0.31 0.07 0.20 0.59 1.00
KaT4 0.50 0.03 0.60 0.12 0.00 0.00 0.19 0.12 0.13 0.14 0.00 0.14 0.44 0.07 0.12 0.00 1.00
KaT5 0.00 O.41 0.00 0.43 0.22 0.03 0.33 0.38 0.38 0.39 0.24 0.30 0.09 0.29 0.54 0.48 0.03 1.00
JagT1 0.05 0.14 0.00 0.22 0.13 0.07 0.29 0.17 0.23 0.20 0.16 0.14 0.22 0.21 0.28 0.25 0.05 0.37 1.00
JagT2 0.10 0.27 0.00 0.29 0.11 0.05 0.34 0.21 0.32 0.29 0.18 0.26 0.19 0.36 0.41 0.37 0.04 0.43 0.63 1.00
JagT3 0.10 0.31 0.00 0.32 0.11 0.05 0.38 0.24 0.28 0.25 0.18 0.26 0.13 0.44 0.33 0.27 0.10 0.43 0.47 0.70 1.00
JagT4 0.10 0.20 0.00 0.29 0.11 0.05 0.30 0.19 0.18 0.18 0.10 0.13 0.19 0.23 0.29 0.19 0.10 0.38 0.63 0.61 0.54 1.00
JagT5 0.00 0.32 0.00 0.36 0.12 0.06 0.35 0.25 0.29 0.26 0.14 0.16 0.14 0.38 0.30 0.28 0.05 0.50 0.42 0.50 0.57 0.43 1.00
7. Acknowledgments
The authors are thankful to the Professor and Head, Department of Tree Improvement and Genetic Resources for
providingallthenecessaryfacilitiestocarryoutthepresentstudies.ThehelprenderedbytheStateDepartmentofForest,
HimachalPradeshisalsodulyacknowledged.
jsIMekdZlZ dkmi;ksxdjrs gq;s vYelfoykslkds p;furoa'kfdLeksa dhlarfrds
vkuqoa'kh;oSfoè;dkvkdyu
liukBkdqj]vkbZ-ds-Bkdqj],u-ch-flag]ts-ih-'kekZ rFkkladkuqj
Lkkjka'k
nlvkj,ihMhizkbZelZ dkiz;ksxdjrs gq;s vYelfoykslkdh23eq[;larfr;ksa ds vk.kfodoSfoè;dkvkdyufd;kx;kftUgsa fg0iz0
(Hkkjr)dsfofHkUuchtlzksrksalscht,d=kdjdsmxk;kx;kFkkAdqy57ekdkZmRiUufd;sx;sftuesals10izkbZelZus100izfr'kr
ikWyhekfiQZTeiznf'kZrfd;kA;w-foykslkdk23larfr;ksa esa 0-00ls 0-70rdl{kelekurkikbZ xbZAbuesa ls tqxkgu&VhdhlarfrvR;kf/d3
oSfoè;iw.kZ ikbZ xbZ tks lekurk(0-04)esa 'ks"klarfr;ksa ls i`FkdFkhvkSjftldkiz;ksxladjdk;ZØedks fodflrdjus fir`Rods :iesa fd;k
x;kAlarfr;ksa dks 4lewgksa esa ckaVkx;klewg&II esa vf/dre12larfr;ksa dhftlds cknlewg&III esa ikap]lewg&IV esa pkjvkSjlewg&I ds
dsoy,dlarfrFkhAvk.kfodLrjijvkj,ihMhfo'ys"k.k]vkuqoa'kh;oSfoè;dh{kerkdkvkdyudjus esa mi;ksxhfln~/gqvkA
References
AlstromRapaportC.,LascouxM.,WangY.C.,RobertsG.andTuskanG.A. (1998).IdentificationofaRAPDMarkerLinkedtoSexDetermination
intheBasketWillow(SalixviminalisL.).JournalofHeredity,89:44–49.
Amri E. and Mamboya F. (2012). Genetic diversity in Pterocarpus angolensis populations detected by Random Amplified Polymorphic DNA
markers.InternationalJournalofPlantBreedingandGenetics,6(2):105-114.
Anamthawat Jonsson. K. Thorsson A.T. (2003) Natural hybridization in birch: triploid hybrids between Betula nana and B. pubescens.
PlantCellTissueOrganCult.,75:99–107.
and
with about 30% similarity. A. auriculiformis shared about clusters. The sub-cluster II consisted maximum of twelve
28% similarity with A. farnesiana and A. catechu. A. clones followed by cluster I (11 clones) and cluster VI (7
mollissima shared about 18% similarity with A. arabica. clones) whereas clusters IV, VII and VIII consisted single
One minor cluster comprises A. farensiana and A. clone each. Ambri and Mamboya (2012) got three major
catechu which were about 30% similarity because of the clusters while studying within and between population
close association with regards to growth habit and diversity of Pterocarpus amgolensis in Tanzania. They
taxonomicalclassification. observed high genetic variations within populations
(77.13%)andlowamongpopulations(22.86%).Normally dispersal of seeds which makes
partitioning and distribution of variability complex has Conclusion
beencitedasreasonforthegroupingofgenotypestoone Molecular techniques have been found to be more
cluster collected from different places. It may be true in useful and accurate for determination of both
this study also. study did not show the separation of interspecific and intraspecific genetic variation in plants.
individuals from different agro-climatic sub-zones of the Randomly amplified polymorphic DNA (RAPD) markers,
same geographic origin. Conversely, in several other in particular, have been successfully employed for
studies which involved various species/accessions per determination of intraspecies genetic diversity in several
geographicorigin,geneticvariationswereobservedtobe plants. Besides this, the RAPD technology has received a
conserved with geographic origin as revealed byJosiah et great deal of attention for genetic diversity studies
al. (2008) in Acacia senegal. studied the genetic diversity because of its simplicity and rapidity. The RAPD profile
using RAPD markers in Butea monosperma and clustered usually represent available portion of the genome. The
genotypes into three groups. The cluster one was present result thus highlights the utility of RAPD marker
represented by seven samples. All samples of this group in providing great information on the genetic structure of
belonged to semi-arid agro-ecological major zone and U. villosa progenies. Markers were also helpful in
three agro-climatic sub- zones. Similarly Kumar et al., characterizing U. villosa progenies. The clustering
(2011) in the assessment of genetic diversity in different pattern exhibited that the geographic distribution
Dalbergia sissoo clones by RAPD markers grouped clones provides true index of genetic diversity in progenies of U.
into two clusters which were further divided into sub- villosa.
Estimation of genetic diversity in progenies of selected genotypes of Ulmus villosa Brandis .... 12272014]
8. 1228 The Indian Forester [December
Anderson W.R. and Fairbanks D.J. (1990). Molecular markers: Important tools for plant genetic resource characterization. Diversity, 6:
51–53.
Bhardwaj D.R. and Mishra V.K., (2005). Vegetative propagation of Ulmus villosa: effects ofplant growth regulators, collection time, type of
donorandpositionofshootonadventitiousrootformationinstemcuttings.NewForest,29:105-116.
Claros Gonzalo. M., Remedios Crespillo., Maria L. Aguilar. and Canovas Francisco. M. (2000). DNA fingerprinting and classification of
geographicallyrelatedgenotypesofolive-tree(OleaeuropaeaL.).Euphytica,116:131–142.
Doyle J.J. and Doyle J.J., (1987). A rapid DNA isolation procedure from small quantities of fresh leaf tissue. Phytochemistry Bulletin, 19: 11-
15.
Fabbri A., Hormaza J. I. and Polito V. S. (1995). Random amplified polymorphic DNA analysis of olive (Olea europaea L.) cultivars. Amer. Soc.
Hort.Sci.,120(3):538-542.
FineschiS.,SalviniD.,TaurchiniD.,CarnevaleS. VendraminG.G.(2003).ChloroplastDNAvariationofTiliacordata(Tiliaceae).Can.J.For.
Res.,33:2503–2508.
Gailing O. Von Wuelisch G. (2004). Nuclear markers (AFLPs) and chloroplast microsatellites differ between Fagus sylvatica and F.
orientalis.SilvaeGenet.,53:105–110.
Goodall Copestake, W.P., Hollingsworth, M.L., Hollingsworth, P.M., Jenkins, G.I. and Collin, E., (2005). Molecular markers and ex situ
conservationoftheEuropeanelms(Ulmusspp.).BiologicalConservation,122:537–546.
Hadia Heikal. A., Hoda E., El-Mokadem. and El-Tayeb H. F. (2008). Phylogenetic Relationship of Four Ficus Species Using Random Amplified
PolymorphicDNA(RAPD)andInter-simpleSequenceRepeat(ISSR)Markers.JournalofAppliedSciencesResearch,4(5):507-514.
Josiah C. C., GeorgeD. O., Michael E. O. and Nyamu W. F. (2008). Genetic diversity in Kenyan populations of Acacia Senegal (L.) wild revealed
bycombinedRAPDandISSRmarkers.AfricanJournalofBiotechnology,7(14):2333-2340.
JoungY.H.,RohM.S.andBarilC.(2001).CharacterizationofAcergriseumanditsputativeinterspecifichybrids.ActaHortic.,546:217–220.
KalasJ.A.,VikenA.andBakkenT.,(2006).Norskredlist2006[Norwegianredlist].Norway:Artsdatabanken.
Kumar A., Dobhal S. and Sharma S., (2011). Assessment of genetic diversity in different clones of Dalbergia sissoo Roxb. by RAPD markers.
AfricanJournalofBiotechnology,10(35):6686-6694.
LI, Fang zhen., Wan Tao., Yi Wei-dong., Cai Ping., (2008). RAPD Analysis on Genetic Diversity of Ulmus pumila L. var. sabulosa, Journal of
ScienceandTechnology,10(3):71-76.
LiZ.andWangZ.(2002).RAPDmarkersusedforthehybrididentificationandparentschoiceinLiriodendron.Sci.Silv.Sinic.,38:169–174.
Ma X., Chen S.Y., Bai S.Q., Zhang X.Q., Li D.X., Zhang C.B. and Yan J.J., (2012). RAPD analysis of genetic diversity and population structure of
Elymussibiricus(Poaceae)nativetothesoutheasternQinghai-TibetPlateau,China.GeneticsandMolecularResearch,15:45-58.
MelvilleR.andHeybroekH.M.(1971).TheElmsoftheHimalaya.RoyalBotanicGarden,Kew,London.KewBulletin,26(1):52-58.
Mylett,A.,BrownS.andCaseyC.(2007).UseofRAPDinassessinggeneticvariabilityinTiliacordatatofacilitateappropriatereestablishment
ofnativetrees.CompBiochemPhysiolPartA146S267-S280P6.24;2007.
Nanda R.M., Nayak S. and Rout G.R. (2004). Studies on genetic relatedness of Acacia tree species using RAPD markers. Biologia Bratislava,
59:115-120.
Nybom H. and Bartish V., (2000). Effects of life history traits and sampling strategies on genetic diversity estimates obtained with RAPD
markersinplants.PlantEcol.Evol.Syst.,3:93-114.
Nybom,H.,(2004).ComparisonofdifferentnuclearDNAmarkersforestimatingintraspecificgeneticdiversityinplants.Mol.Ecol.,13:1143-
1155.
Ohyama, M., Baba K., Itoh T. and Shiraishi S. (1999). Polymorphism analysis of Fagaceae and DNA-based identification of Fagus species
growninJapanbasedontherbclgene.J.WoodSci.,45:183–187.
Ozrenk K., Gazioglu Sensoy R.I., Erdinc C., Guleryuz M. and Aykanat A. (2010). Molecular characterization of mulberry germplasm from
EasternAnatolia.AfricanJournalofBiotechnology,9(1):001-006.
Palme A.E., Su Q., Palsson S. and Lascoux M. (2004). Extensive sharing of chloroplast haplotypes among European birches indicates
hybridizationamongBetulapendula,B.pubescensandB.nana.Mol.Ecol.,13:167–178.
Pharmawati M., Yan G., Mc Farlane I.J., (2004). Application of RAPD and ISSR markers to analyse molecular relationships in Grevillea
(Proteaceae).AustralSyst.Bot.,17:49-61.
Pooler M.R. and Townsend A.M., (2005). DNA Fingerprinting of Clones and Hybrids of AmericanElm and Other Elm Species with AFLP
Markers.J.Environ.Hort.,23(3):113–117.
Prathepha P. (2000). Detection of RAPD variation in a forest tree species, Melientha suavis Pierre (Opiliaceae) from Thailand. Science Asia.,
26:213-218.
Pvingila D., Verbylaite R., Baliuckas V., Pliura A. and Kuusiene S. (2005). Genetic diversity (RAPD) in natural Lithuanian populations of
commonash(FraxinusexcelsiorL.).Biologia,3:46–53.
Rohlf,F.J.(1998).NTSYS-PCNumericalTaxonomyandMultivariateSystemVersion2.02.AppliedBiostatisInc.,NewYork
and
and
9. Estimation of genetic diversity in progenies of selected genotypes of Ulmus villosa Brandis .... 12292014]
Rout G.R., Bhatacharya N.R.M., Nayak S. and Das P. (2003). Evaluation of genetic relationships in Dalbergia species using RAPD markers.
BiodiversityandConservation,12:197-206.
SantamourF.S.,(1979).ResistanceofHimalayansmall-leavedelmtoDutchelmdisease.JournalofArboriculture,5:110-112.
Sherry M., Smith S., Patel A., Harris P., Hand P., Trenchard L. and Henderson J., (2011). RAPD and microsatellite transferability studies in
selectedspeciesofProsopis(sectionAlgarobia)withemphasisonProsopisjulifloraandP.pallid.JournalofGenetics,90(2):251-264.
Singh K.B., (1991). Study on the propagation techniques of Ulmus laevigata Royle (Vern. Marinoo) M.Sc. Thesis, Dr. Y.S. Parmar, UHF, Nauni,
Solan(H.P).2p.
SinghR.V.,(1982).FoddertreesofIndia.OxfordandIBHPublishingCo.Ptv.Ltd.NewDelhi,India,663p.
SkepnerA.P.andKraneD.E.(1998).RAPDrevealsgeneticsimilarityofAcersaccharumandAcernigrum.Heredity,80:422–428.
Sun Y., Zhao Y., Wang X., Qiao G., Chen G., Yang Y., Zhou J., Jin L. and Zhou R. (2009). Adventitious bud regeneration from leaf explants of
PlatanusoccidentalisL.andgeneticstabilityassessment.ActaPhysiolPlant.,31:33–41.
Thomas G., Sreejayan J.L., and Kuriachen P., (2001). Genetic variation and population structure in Oryza malampuzhaensis endemic to
WesternGhats,South.IndianJournalofGenetics,80:141-148.
Vigouroux A., Besnard G., Sossey-Alaoui K., Tersac M. and Berville A. (1997). Hybrid origin of Platanus acerifolia confirmed and that of P.
densicomarevealedusingmolecularmarkers.ActaBot.Gall.,144:243–252.
Weiguo Zhao and Yile Pan., (2004). Geneticdiversity of genusMorus revealed by RAPD markers. Indian. Journal of Agricultural Biology, 6(6):
950-955.
Williams J.G.K., Kubelik A.R., Levak K.J., Rafaski J.A. and Tingey S.V. (1990). DNA polymorphism amplified by arbitrary primer are useful as
geneticmarker.NucleicAcidResearch,18:6531-6535.
www.iucnredlist.org:InternationalUnionforConservationofNatureandNaturalResources.
INDIAN MEDICINAL AND AROMATIC PLANTS - PART I AND II
Few copies of special issues of the Indian Forester on Medicinal and Aromatic Plants –I & II are available for sale on 40%
discount for our readers, subscribers and those interested. (The original price of each issue is ` 200=00 only, forwarding
chargesextra). TheabovespecialissueshavecoveredallaspectsofMedicinalandAromaticPlantsaslistedbelow:
1. INDIAN MEDICINAL AND AROMATIC PLANTS - PART I (January, 2003)
Focusing on: MEDICINAL PLANT RAW MATERIALS FOR INDIAN DRUG AND PHARMACEUTICAL INDUSTRY; MEDICINAL
PLANTS BASED FOREST MANAGEMENT; THREATENED HERBAL HERITIAGE; THREATENED MEDICINAL PLANTS;
COMMERCIAL EXPLOITATION AND CONSERVATION; MARKET INFORMATION SYSTEM; NATIONAL MEDICINAL PLANTS
BOARD (INTRODUCTION AND SCHEMES); UTILIZATION OF WASTELANDS FOR GROWING MEDICINAL PLANTS; ORGANIC
CONVERSIONANDCERTIFICATION.
2. INDIANMEDICINALANDAROMATICPLANTS- PARTII (February,2003)
Focusing on: MEDICINAL PLANT RAW MATERIALS FOR INDIAN DRUG AND PHARMACEUTICAL INDUSTRY; DEVELOPMENT
OF MARKETING; MEDICINAL PLANTS CONSERVATION AND SUSTAINABLE USE THROUGH FOREST GENE BANKS;
COMMUNITY BASED CONSERVATION AND MANAGEMENT OF MEDICINAL PLANTS IN INDIA.; SATUS OF MEDICINAL PLANTS
CONSUMPTION BY THE PHARMACEUTICAL INDUSTRIES IN GUJARAT STATE; MEDICINAL TREES OF UTTARANCHAL STATE :
DISTRIBUTION,USEPATTERN ANDPROSPECTSFORCONSERVATION; STANDARDIZATIONANDQUALITYCONTROL;
KindlycontactourBusinessManagerwithyourvaluedorders:
Business Manager,
INDIAN FORESTER
P.O. NEW FOREST, DEHRADUN –248006 (Uttarakhand)