SlideShare uma empresa Scribd logo
1 de 43
Baixar para ler offline
November 2015
Vol. 101, No. 4
The 2014 Home Mortgage Disclosure Act Data
Neil Bhutta, Jack Popper, and Daniel R. Ringo, of the Division of Research and Statistics,
prepared this article. Jimmy Kelliher provided research assistance.
This article provides an overview of residential mortgage lending in 2014 and discusses a
number of changes in mortgage market activity over time based on data reported under the
Home Mortgage Disclosure Act of 1975 (HMDA). HMDA requires most mortgage lend-
ing institutions with offices in metropolitan areas to disclose to the public detailed informa-
tion about their home-lending activity each year. The HMDA data include the disposition
of each application for mortgage credit; the type, purpose, and characteristics of each
home mortgage that lenders originate or purchase during the calendar year; the census-
tract designations of the properties related to those loans; loan pricing information; per-
sonal demographic and other information about loan applicants, including their race or
ethnicity and income; and information about loan sales (see appendix A for a full list
of items reported under HMDA).1
HMDA was enacted to help members of the public determine whether financial institu-
tions are serving the housing needs of their local communities and treating borrowers and
loan applicants fairly, provide information that could facilitate the efforts of public entities
to distribute funds to local communities for the purpose of attracting private investment,
and help households decide where they may want to deposit their savings.2
The data have
proven to be valuable for research and are often used in public policy deliberations related
to the mortgage market.3
Mortgage debt is by far the largest component of household debt in the United States, and
mortgage transactions can have important implications for households’ financial well-
being. The HMDA data are the most comprehensive source of publicly available informa-
tion on the U.S. mortgage market, providing unique details on how much mortgage credit
gets extended each year, who obtains such credit, and which institutions provide such
credit.
1
The 2014 HMDA data reflect property locations using the census-tract geographic boundaries created for the
2010 decennial census as well as recent updates to the list of metropolitan statistical areas (MSAs) published by
the Office of Management and Budget. The first year for which the HMDA data use this most recent list of
MSAs is 2014. For further information, see Federal Financial Institutions Examination Council (2013), “OMB
Announcement—Revised Delineations of MSAs,” press release, February 28, www.ffiec.gov/hmda/OMB_MSA
.htm.
2
A brief history of HMDA is available at Federal Financial Institutions Examination Council, “History of
HMDA,” webpage, www.ffiec.gov/hmda/history2.htm.
3
On July 21, 2011, rulemaking responsibility for HMDA was transferred from the Federal Reserve Board to the
newly established Consumer Financial Protection Bureau. The Federal Financial Institutions Examination Coun-
cil (FFIEC; www.ffiec.gov/hmda/history2.htm) continues to be responsible for collecting the HMDA data from
reporting institutions and facilitating public access to the information. In September of each year, the FFIEC
releases to the public summary disclosure tables pertaining to lending activity from the previous calendar year for
each reporting lender as well as aggregations of home-lending activity for each metropolitan statistical area and
for the nation as a whole. The FFIEC also makes available to the public a data file containing virtually all of the
reported information for each lending institution as well as a file that includes key demographic and housing-
related data for each census tract drawn from census sources.
In 2014, house prices continued their upward trend evident since 2012, and mortgage inter-
est rates declined throughout the year, although rates remained slightly higher than the
historical lows reached in late 2012 and early 2013. While mortgage credit stayed generally
tight, conditions appeared to ease somewhat over the course of the year as the fraction of
mortgage lending to lower-credit borrowers increased, and reports from the Senior Loan
Officer Opinion Survey on Bank Lending Practices indicate that several large banks relaxed
their credit requirements for prime loans. However, growth in new housing construction
was slow throughout the year, suggesting some persistent softness in new housing demand.4
Significant regulatory changes occurred in 2014 that may have influenced lending patterns.
In January 2014, the new ability-to-repay (ATR) and qualified mortgage (QM) rules, issued
by the Consumer Financial Protection Bureau (CFPB), went into effect. As discussed in
more detail in a later section, the new rules generally require lenders originating closed-end
loans to make a reasonable, good faith determination of whether mortgage borrowers will
be able to repay their loans. This ATR determination includes consideration and verifica-
tion of mortgage applicants’ incomes, other debts, and credit histories. The rules also
define categories of QM loans that are presumed to meet the ATR requirement and receive
certain protections from liability. The QM requirements generally include a limit on the
borrower’s ratio of total debt service payments to income (DTI), limits on points and fees,
and various other restrictions on loan terms and features.5
Also in January 2014, revised rules implementing the Home Ownership and Equity Protec-
tion Act (HOEPA), which provides special consumer protections (such as additional disclo-
sures) for borrowers considering certain mortgage loans that are priced well above prime
rates, went into effect. Most notably, the new rules extend HOEPA coverage from refinance
and home equity loans to also include home-purchase loans and home equity lines of
credit, as well as adding new borrower protections, including a requirement that consumers
receive homeownership counseling before obtaining a high-cost mortgage.6
This article presents findings from the HMDA data describing mortgage market activity
and lending patterns over time, including the incidence of higher-priced or nonprime lend-
ing and rates of denial on mortgage applications, across different demographic groups and
lender types.7
Some of the key findings are as follows:
1. The number of mortgage originations in 2014 declined 31 percent, to 6.0 million from
8.7 million in 2013. This decrease was due to a drop in refinance mortgages for one- to
four-family properties, which fell by over 2.8 million, or 55 percent, from 2013, as
mortgage interest rates in 2014 remained above the low levels experienced in early 2013.
In contrast to refinancing, one- to four-family home-purchase originations increased
by 123,000, or 4 percent, from 2013, continuing an upward trend since 2011.
2. The nonconventional share of first-lien home-purchase loans for one- to four-family,
owner-occupied, site-built properties (that is, loans with mortgage insurance from the
4
For more information on credit and economic conditions during 2014, see Board of Governors of the Federal
Reserve System (2015), Monetary Policy Report (Washington: Board of Governors, February 24), www
.federalreserve.gov/monetarypolicy/mpr_default.htm.
5
For more information, see Consumer Financial Protection Bureau, “Ability to Repay and Qualified Mortgage
Standards under the Truth in Lending Act (Regulation Z),” webpage, www.consumerfinance.gov/regulations/
ability-to-repay-and-qualified-mortgage-standards-under-the-truth-in-lending-act-regulation-z.
6
For more information, see Consumer Financial Protection Bureau (2014), 2013 Home Ownership and Equity
Protection Act (HOEPA) Rule: Small Entity Compliance Guide (Washington: CFPB, January 9), http://files
.consumerfinance.gov/f/201401_cfpb_hoepa-compliance-guide.pdf.
7
Some lenders file amended HMDA reports, which are not reflected in the initial public data release. A final
HMDA data set reflecting these changes is created two years following the initial data release. The data used to
prepare this article are drawn from the initial public release for 2013–14 and from the final HMDA data set for
years prior to that. Consequently, numbers in this article for the years 2012 and earlier may differ somewhat
from numbers calculated from the initial public release files.
2 Federal Reserve Bulletin | November 2015
Federal Housing Administration (FHA) or guarantees from the Department of Veter-
ans Affairs (VA), the Farm Service Agency (FSA), or the Rural Housing Service
(RHS)) stood at about 36 percent in 2014, down from 38 percent in 2013 and from a
peak of 54 percent in 2009. The decline since 2009 reflects a decrease in the FHA share
of loans, possibly due to a series of increases, starting in 2010, in the mortgage insur-
ance premium (MIP) that the FHA charges borrowers.
3. Black and Hispanic white borrowers increased their share of home-purchase loans for
one- to four-family, owner-occupied, site-built properties in 2014. The HMDA data
indicate that 5.2 percent of such loans went to black borrowers, up from 4.8 percent in
2013, while 7.9 percent went to Hispanic white borrowers, up from 7.3 percent in 2013,
reversing a declining trend for both groups. The share of home-purchase loans to high-
income borrowers increased to 46.1 percent from 44.8 percent in 2013.
4. The HMDA data provide little indication that the new ATR and QM rules signifi-
cantly curtailed mortgage credit availability in 2014 relative to 2013. For example,
despite the QM rule that caps borrowers’ DTI ratio for many loans, the fraction of
high-DTI loans does not appear to have declined in 2014 from 2013. However, as dis-
cussed in more detail later, there are significant challenges in determining the extent to
which the new rules have influenced the mortgage market, and the results here do not
necessarily rule out significant effects or the possibility that effects may arise in the
future.
5. The HMDA loan pricing data indicate that, in 2014, lending activity dropped sharply
at the pricing thresholds where HOEPA protections kick in. As discussed later, there
are several potential interpretations and implications of this finding.
6. In 2014, only about 3 percent of conventional home-purchase loans and 2 percent of
conventional refinance loans were higher priced. However, small banks and credit
unions were much more likely to originate conventional higher-priced loans than large
banks and mortgage companies and thus accounted for a highly disproportionate
share of conventional higher-priced loans in 2014. For example, while small banks and
credit unions originated about 18 percent of conventional home-purchase loans, they
accounted for about 59 percent of higher-priced conventional home-purchase loans.
7. The share of mortgages originated by nondepository, independent mortgage compa-
nies has increased sharply in recent years. In 2014, this group of lenders accounted for
47 percent of first-lien owner-occupant home-purchase loans and 42 percent of such
refinance loans, higher levels than at any point since at least 1995. This recent rise has
been widespread, occurring across a range of demographic groups and for both con-
ventional and nonconventional lending. Small banks and credit unions have also
increased their market shares over the past decade, while the fraction of originations
attributable to large banks and their nonbank subsidiaries has diminished significantly.
8. Due to this shifting landscape, a historically high share of loans is now originated out-
side the federally insured banking system by institutions—independent mortgage com-
panies and credit unions—that are not subject to the Community Reinvestment Act
(CRA). In addition, small banks have steadily increased the fraction of their lending
done outside of their CRA assessment areas. However, assessment-area lending by
large banks has held steady in recent years at levels well above those reached during the
housing boom.
Mortgage Applications and Originations
In 2014, 7,062 institutions reported data on nearly 10 million home mortgage applications
(including about 1.5 million applications that were closed by the lender for incompleteness
or were withdrawn by the applicant before a decision was made) that resulted in about
6 million originations. The number of originations in 2014 was down from 8.7 million
originations in 2013 (table 1).
The 2014 Home Mortgage Disclosure Act Data 3
Table 1. Applications and originations, 2004–14
Numbers of loans, in thousands, except as noted
Characteristic of loan
and of property 2004 2005 2006 2007 2008 2009 2010 2011 2012 2013 2014
1–4 Family
Home purchase
Applications 9,804 11,685 10,929 7,609 5,060 4,217 3,848 3,650 4,023 4,554 4,662
Originations 6,437 7,391 6,740 4,663 3,139 2,793 2,547 2,430 2,742 3,112 3,235
First lien, owner occupied 4,789 4,964 4,429 3,454 2,628 2,455 2,218 2,073 2,343 2,680 2,804
Site-built, conventional 4,107 4,425 3,912 2,937 1,581 1,089 1,005 999 1,251 1,622 1,736
Site-built, nonconventional 553 411 386 394 951 1,302 1,151 1,019 1,033 993 1,001
FHA share (percent) 74.6 68.6 66.0 65.8 78.9 77.0 77.4 70.9 68.0 62.7 58.3
VA share (percent) 21.6 26.7 29.0 27.1 15.2 13.9 15.2 18.2 19.9 24.3 28.4
FSA/RHS share (percent) 3.9 4.7 5.0 7.1 5.9 9.0 7.4 10.9 12.0 13.0 13.3
Manufactured, conventional 106 100 101 95 68 43 44 40 44 51 51
Manufactured,
nonconventional 24 27 30 29 28 21 17 15 14 14 16
First lien, non-owner occupied 857 1,053 880 607 412 292 285 314 355 385 377
Junior lien, owner occupied 738 1,224 1,269 552 93 44 42 41 43 45 53
Junior lien, non-owner occupied 53 150 162 50 6 2 2 1 1 1 2
Refinance
Applications 16,085 15,907 14,046 11,566 7,805 9,983 8,433 7,422 10,526 8,549 4,386
Originations 7,591 7,107 6,091 4,818 3,491 5,772 4,969 4,330 6,668 5,131 2,301
First lien, owner occupied 6,497 5,770 4,469 3,659 2,934 5,301 4,516 3,856 5,930 4,385 1,950
Site-built, conventional 6,115 5,541 4,287 3,407 2,363 4,264 3,835 3,315 4,971 3,628 1,561
Site-built, nonconventional 297 151 110 180 506 979 646 508 917 713 360
FHA share (percent) 68.3 77.3 87.5 91.5 92.2 83.7 79.3 63.2 61.2 61.1 47.3
VA share (percent) 31.4 22.4 12.3 8.3 7.6 15.9 20.3 35.9 37.8 37.7 52.2
FSA/RHS share (percent) .2 .3 .2 .1 .2 .4 .4 .9 .9 1.2 0.5
Manufactured, conventional 77 70 60 56 42 36 25 25 31 32 20
Manufactured,
nonconventional 7 8 12 16 22 22 10 9 11 12 8
First lien, non-owner occupied 618 582 547 474 330 350 359 394 660 671 292
Junior lien, owner occupied 464 729 1,036 661 219 115 88 74 73 70 55
Junior lien, non-owner occupied 13 25 39 23 9 7 6 5 5 5 4
Home improvement
Applications 2,200 2,544 2,481 2,218 1,413 832 670 675 779 833 840
Originations 964 1,096 1,140 958 573 390 341 335 382 425 408
Multifamily1
Applications 61 58 52 54 43 26 26 35 47 51 45
Originations 48 45 40 41 31 19 19 27 37 40 35
Total applications 28,151 30,193 27,508 21,448 14,320 15,057 12,977 11,782 15,375 13,987 9,933
Total originations 15,040 15,638 14,011 10,480 7,234 8,974 7,876 7,122 9,828 8,707 5,980
Memo
Purchased loans 5,142 5,868 6,236 4,821 2,935 4,301 3,229 2,939 3,163 2,794 1,752
Requests for preapproval2
1,068 1,260 1,175 1,065 735 559 445 429 474 516 501
Requests for preapproval that
were approved but not acted on 167 166 189 197 99 61 53 55 64 72 64
Requests for preapproval that
were denied 171 231 222 235 177 155 117 130 149 163 126
Note: Components may not sum to totals because of rounding. Applications include those withdrawn and those closed for incompleteness. FHA
is Federal Housing Administration; VA is U.S. Department of Veterans Affairs; FSA is Farm Service Agency; RHS is Rural Housing Service.
1
A multifamily property consists of five or more units.
2
Consists of all requests for preapproval. Preapprovals are not related to a specific property and thus are distinct from applications.
Source: Here and in subsequent tables and figures, except as noted, Federal Financial Institutions Examination Council, data reported under the
Home Mortgage Disclosure Act (www.ffiec.gov/hmda).
4 Federal Reserve Bulletin | November 2015
Refinance mortgages for one- to
four-family properties dropped by
over 2.8 million, or 55 percent,
from 2013 to 2014, as mortgage
interest rates remained above the
historic lows reached in the early
months of 2013 (figure 1).
While the number of refinancings
fell for the second consecutive year,
one- to four-family home-purchase
originations grew by almost
123,000, or 4 percent, from 2013.
Most one- to four-family home-
purchase loans are first liens for
owner-occupied properties. In the
past three years, such loans have
grown over 35 percent, from nearly
2.1 million in 2011 to over 2.8 mil-
lion in 2014. However, the volume
of such home-purchase origina-
tions has not yet climbed back to
the levels observed from 1994 to
2007 (figure 2).8
The number of
first-lien home-purchase loans for
non-owner-occupied properties—
that is, purchases of rental proper-
ties, vacation properties, and sec-
ond homes—decreased slightly in
2014, from 385,000 in 2013 to
377,000 in 2014.
The annual home-purchase loan
volumes presented in figure 2 give
the impression that the upward
trend that began in 2011 slowed in
2014. This impression is mostly an
artifact of a decline in lending in
the second half of 2013. Figure 3
plots the monthly volume of first-
lien home-purchase loans starting
in 2011, with and without seasonal
8
The HMDA data prior to 2004 did not provide lien status for loans, and thus the number of loans prior to 2004
includes both first- and junior-lien loans. That said, including junior-lien home-purchase loans in 2014 does
not change the conclusion that home-purchase lending in 2014 was below that in 1994. It should also be noted
that, because HMDA coverage has expanded over time, in part as a result of significantly more counties being
included in metropolitan statistical areas now than in the early 1990s, the lower loan volume in 2014 relative to
1994 is understated.
Figure 1. Volume of refinance originations and prime rate,
2012–14
0
100
200
300
400
500
600
700
800
3.0
3.2
3.4
3.6
3.8
4.0
4.2
4.4
4.6
Thousands of loansPercentage points
Prime rate (left scale) Refinance originations (right scale)
201420132012
Note: The data are monthly. Loans are first-lien mortgages excluding those for
multifamily housing. The prime rate is the average interest rate on 30-year fixed-
rate mortgages being offered to high-quality prime borrowers reported by Fred-
die Mac in its Primary Mortgage Market Survey.
Figure 2. Number of home-purchase and refinance
mortgage originations reported under the Home Mortgage
Disclosure Act, 1994–2014
1.0
2.0
3.0
4.0
5.0
6.0
Millions of loans
A. Home purchase
0.0
3.0
6.0
9.0
12.0
15.0
Millions of loans
B. Refinance
1994 1998 2002 2006 2010 2014
1994 1998 2002 2006 2010 2014
Note: The data are annual. Mortgage originations for one- to four-family owner-
occupied properties, with junior-lien loans excluded in 2004 and later.
The 2014 Home Mortgage Disclosure Act Data 5
adjustment.9
The figure shows that,
in fact, the seasonally adjusted
growth rate of home-purchase
originations during the course of
2014 was fairly similar to that seen
from 2011 through the first half of
2013.
In table 1, the volume of first-lien
lending for owner-occupied proper-
ties is further disaggregated by loan
and property type. (A larger,
supplementary version of table 1,
with the data broken down by
month, is available in the Excel file
posted with this article, as are all of
the other tables referenced in the
article.) In addition to lien and
occupancy status, the HMDA data provide details on the type of property securing the
loan (site-built or manufactured home) and on the type of loan (conventional or not).10
As
noted earlier, nonconventional lending involves loans with mortgage insurance or guaran-
tees from federal government agencies, including the FHA, the VA, the RHS, and the FSA.
Conventional lending encompasses all other loans, including those sold to the government-
sponsored enterprises (GSEs) Fannie Mae and Freddie Mac.
Nonconventional loans are more common for home purchases than refinancings and usu-
ally involve high loan-to-value (LTV) ratios—that is, the borrowers provide relatively small
down payments. For site-built properties, nonconventional home-purchase loans increased
less than 1 percent in 2014, while conventional loans increased about 7 percent. The non-
conventional share of first-lien home-purchase loans for one- to four-family, owner-occu-
pied, site-built properties stood at about 36 percent in 2014, down slightly from 38 percent
in 2013 and down significantly from its peak of 54 percent in 2009 in the wake of the finan-
cial crisis.11
That said, last year, the nonconventional share remained above historical aver-
ages (figure 4).
Figure 4 shows that the marked decline in the nonconventional share since 2009 reflects a
decrease in the FHA share of loans, while the VA and FSA/RHS shares have held steady
over this period. One factor that may help explain the reduction in the FHA share is a
series of increases in the annual MIP that the FHA charges to borrowers. Between Octo-
9
The data series was adjusted for seasonality using the Census Bureau’s X-12 package. For a description of X-12
and seasonal adjustment in general, see the Census Bureau’s “FAQs on Seasonal Adjustment” at www.census
.gov/const/www/faq2.html. The date used to compile data at the monthly level is the “action date,” which is the
date on which the lending institution took action on an application. For approved applications, this date is usu-
ally the closing date or origination date of the loan. The action date is not released in the public HMDA data
files.
10
Manufactured-home lending differs from lending on site-built homes, in part because most of the homes are
sold without land and are treated as chattel-secured lending, which typically carries higher interest rates and
shorter terms to maturity than those on loans to purchase site-built homes (for pricing information on manu-
factured home loans, see table 8). This article focuses almost entirely on site-built mortgage originations, which
constitute the vast majority of originations (as shown in table 1). That said, it is important to keep in mind
that, because manufactured homes typically are less expensive than site-built homes, they provide a low-cost
housing option for households with more moderate incomes.
11
For a more detailed discussion of the post-crisis rise in nonconventional lending, see Robert B. Avery, Neil
Bhutta, Kenneth P. Brevoort, and Glenn B. Canner (2010), “The 2009 HMDA Data: The Mortgage Market in
a Time of Low Interest Rates and Economic Distress,” Federal Reserve Bulletin, vol. 96 (December), pp. A39–
A77, www.federalreserve.gov/pubs/bulletin/2010/default.htm.
Figure 3. Volume of home-purchase originations, 2011–14
100
150
200
250
300
350
Thousands of loans
Seasonally adjusted
Not seasonally adjusted
2011 2012 2013 2014
Note: The data are monthly. Loans are first-lien home-purchase mortgage
originations.
6 Federal Reserve Bulletin | November 2015
ber 2010 and April 2013, the
annual MIP for a typical home-
purchase loan more than doubled,
from 0.55 percent of the loan
amount to 1.35 percent.12
Also in
2013, the FHA extended the period
over which the annual MIP is
required to be paid. For a typical
home-purchase loan, the annual
premium must now be paid over
the life of the loan rather than until
the LTV ratio falls below 78 per-
cent. Although this extension has
no effect on the initial cost of the
mortgage, it would change the
potential longer-term cost if bor-
rowers continued to hold the mort-
gage after the LTV ratio fell below
78 percent.13
The remainder of table 1 provides
additional details on the break-
down of one- to four-family home-
purchase and refinance loans by lien and occupancy status and by property and loan
type.14
Table 1 also provides the number of applications for and originations of home-im-
provement loans for one- to four-family properties, many of which are junior liens or unse-
cured, and loans for the purchase of multifamily properties (consisting of five or more
units). Finally, the HMDA data include details about preapproval requests for home-pur-
chase loans and loans purchased by reporting institutions during the reporting year,
although the purchased loans may have been originated at any point in time. Lenders also
reported roughly 501,000 preapproval requests; roughly 62 percent of these requests turned
into an actual loan application for a specific property in 2014.15
Table 1 also shows that, for
2014, lenders purchased 1.8 million loans from other institutions.
12
Changes to the FHA’s upfront and annual MIPs over time have been documented in Urban Institute, Housing
Finance Policy Center (2014), Housing Finance at a Glance: A Monthly Chartbook (Washington: Urban Insti-
tute, March), www.urban.org/publications/413061.html. A typical FHA home-purchase loan has an LTV of
over 95 percent and a loan term in excess of 15 years. The upfront premium, on net, was unchanged between
2010 and 2013; it was briefly increased from 1.75 percent to 2.25 percent and lowered back to 1.00 percent
in 2010, and then it was raised back to 1.75 percent in 2012.
13
For 2015, the FHA reduced the annual premium by 50 basis points on new forward mortgages beginning on
January 26. See U.S. Department of Housing and Urban Development (2015), “Reduction of Federal Housing
Administration (FHA) Annual Mortgage Insurance Premium (MIP) Rates and Temporary Case Cancellation
Authority,” Mortgagee Letter 2015-01 (January 9), https://portal.hud.gov/hudportal/documents/huddoc?id=15-
01ml.pdf.
14
Note that under the regulations that govern HMDA reporting, many standalone junior-lien loans are not
reported because either the lender does not know the purpose of the loan or the reasons cited for the loan are
not ones that trigger a reporting requirement. Unless a junior lien is used for home purchase or explicitly for
home improvements, or to refinance an existing lien, it is not reported under HMDA. Further, home equity
lines of credit, many of which are junior liens and could also be used to help purchase a home, do not have to
be reported in the HMDA data regardless of the purpose of the loan.
15
Reporters can, but are not required to, report preapproval requests that they approve but are not acted on by
the potential borrower.
Figure 4. Nonconventional share of home-purchase
mortgage originations, 1994–2014
0
20
40
60
80
100
Percent
FSA/RHS VA FHA Conventional
1994 1998 2002 2006 2010 2014
Note: The data are annual. Home-purchase mortgage originations for one- to
four-family owner-occupied properties, with junior-lien loans excluded in 2004
and later. Nonconventional loans are those insured by the Federal Housing
Administration (FHA) or backed by guarantees from the U.S. Department of Veter-
ans Affairs (VA), the Farm Service Agency (FSA), or the Rural Housing Service
(RHS).
The 2014 Home Mortgage Disclosure Act Data 7
Mortgage Outcomes by Income and by Race and Ethnicity
A key attribute of the HMDA data is that they help policymakers and the broader public
better understand the distribution of mortgage credit across different demographic groups.
The next set of tables provides information on loan shares, product usage, denial rates and
reasons, and mortgage pricing for population groups defined by applicant income, neigh-
borhood income, and applicant race and ethnicity (tables 2–8). With the exception of
table 8, which includes loans for manufactured homes, these tables focus on first-lien home-
purchase and refinance loans for one- to four-family, owner-occupied, site-built properties.
As can be seen from table 1, such loans accounted for about 78 percent of all HMDA origi-
nations in 2014.
The Distribution of Home Loans across Demographic Groups
Table 2 shows different groups’ shares of home-purchase and refinance loans and how
these shares have changed over time. For example, black borrowers’ share of home-pur-
chase loans (conventional and nonconventional loans combined) was 5.2 percent in 2014,
up from 4.8 percent in 2013 but still lower than its peak of 8.7 percent in 2006. Similarly,
the Hispanic white share of home-purchase loans was 7.9 percent in 2014, up from 7.3 per-
cent in 2013, although well below the 11.7 percent share seen in 2006. Shares of refinance
loans to minorities other than Asians have generally increased since 2010. The bottom of
the table provides the total loan counts for each year, and thus the number of loans to a
given group in a given year can be easily derived.16
In terms of borrower income, the share of home-purchase loans to low- or moderate-
income (LMI) borrowers declined, from 28.4 percent in 2013 to 27.0 percent in 2014.17
Fol-
lowing definitions used by the federal bank supervisory agencies in enforcement of the
CRA, LMI borrowers are defined as those with incomes of less than 80 percent of esti-
mated current area median family income (AMFI); AMFI is calculated based on the
incomes of residents of the metropolitan area or nonmetropolitan portion of the state in
which the loan-securing property is located.18
For 2014, the Office of Management and
Budget published new metropolitan area delineations, so caution should be exercised in
comparing relative income measures between 2013 and 2014.19
From 2013 to 2014, the home-purchase loan share directed to high-income neighborhoods
(defined as census tracts) decreased from 43.2 percent to 41.8 percent.20
LMI and middle-
income tracts both saw small gains. In addition to the difficulties in comparison induced by
the changing metropolitan area definitions, it is important to note that shares by neighbor-
hood income in 2012 and thereafter are not perfectly comparable with those in 2011 and
earlier because census-tract definitions and census-tract median family income esti-
mates were revised in 2012. The current tract demographic measures are based on 2010
16
For example, the number of home-purchase loans to Asians in 2014 was about 148,000, derived by multiplying
2.737 million loans by 5.4 and then dividing by 100.
17
Note that the sum of refinance shares across borrower-income groups is significantly less than 100 percent
because income is not always relied on in underwriting decisions, particularly in recent years, which appears to
reflect increased usage of nonconventional streamline refinance programs. Indeed, in 2014, about 75 percent of
refinance loans for which borrower income was not reported were nonconventional.
18
Middle-income borrowers have incomes of at least 80 percent and less than 120 percent of AMFI, and high-in-
come borrowers have incomes of at least 120 percent of AMFI.
19
A similar redefinition of metropolitan areas affects comparisons between the 2003 and 2004 HMDA data.
20
Definitions for LMI, middle-income, and high-income neighborhoods are identical to those for LMI, middle-
income, and high-income borrowers but are based on the ratio of census-tract median family income to AMFI
measured from the 2006–10 American Community Survey data.
8 Federal Reserve Bulletin | November 2015
Table 2. Distribution of home loans, by purpose of loan, 2004–14
Percent except as noted
Characteristic of borrower
and of neighborhood 2004 2005 2006 2007 2008 2009 2010 2011 2012 2013 2014
A. Home purchase
Borrower race and ethnicity1
Asian 4.8 5.0 4.5 4.5 4.9 5.3 5.5 5.2 5.3 5.7 5.4
Black or African American 7.1 7.7 8.7 7.6 6.3 5.7 6.0 5.5 5.1 4.8 5.2
Hispanic white 7.6 10.5 11.7 9.0 7.9 8.0 8.1 8.3 7.7 7.3 7.9
Non-Hispanic white 57.1 61.7 61.2 65.4 67.5 67.9 67.6 68.7 70.0 70.2 69.1
Other minority2
1.4 1.3 1.1 1.0 .9 .9 .9 .8 .8 .7 .8
Joint 2.3 2.3 2.3 2.5 2.8 2.8 2.7 2.8 2.9 3.1 3.3
Missing 19.8 11.5 10.5 10.1 9.6 9.3 9.1 8.6 8.2 8.2 8.3
All 100 100 100 100 100 100 100 100 100 100 100
Borrower income3
Low or moderate 27.7 24.6 23.6 24.7 28.1 36.7 35.5 34.4 33.3 28.4 27.0
Middle 26.9 25.7 24.7 25.2 27.1 26.7 25.6 25.2 25.2 25.2 25.6
High 41.4 45.5 46.7 47.0 43.1 34.7 37.4 38.8 40.0 44.8 46.1
Income not used or not applicable 4.0 4.2 5.0 3.1 1.7 1.9 1.5 1.6 1.5 1.6 1.3
All 100 100 100 100 100 100 100 100 100 100 100
Neighborhood income4
Low or moderate 14.5 15.1 15.7 14.4 13.1 12.6 12.1 11.0 12.8 12.7 13.3
Middle 48.7 49.2 49.5 49.6 49.8 50.2 49.4 49.4 43.6 43.7 44.6
High 35.8 34.7 33.7 35.1 35.9 35.8 37.7 39.1 43.2 43.2 41.8
All 100 100 100 100 100 100 100 100 100 100 100
B. Refinance
Borrower race and ethnicity1
Asian 3.5 2.9 3.0 3.1 3.1 4.1 5.2 5.4 5.5 4.7 4.4
Black or African American 7.4 8.3 9.6 8.4 6.0 3.5 2.9 3.1 3.3 4.4 5.3
Hispanic white 6.2 8.6 10.1 8.7 5.3 3.2 3.0 3.3 3.9 5.0 6.2
Non-Hispanic white 57.2 60.9 59.6 62.7 70.7 74.6 74.3 73.5 72.5 70.5 67.8
Other minority2
1.4 1.4 1.3 1.1 .8 .6 .5 .6 .6 .7 .9
Joint 2.1 2.1 1.9 2.0 2.2 2.6 2.7 2.8 3.1 3.1 3.3
Missing 22.1 15.7 14.6 14.1 11.9 11.4 11.4 11.3 11.1 11.6 12.2
All 100 100 100 100 100 100 100 100 100 100 100
Borrower income3
Low or moderate 26.2 25.5 24.7 23.3 23.5 19.6 19.0 19.2 19.6 21.1 22.2
Middle 26.3 26.8 26.1 25.6 25.5 22.5 22.5 21.3 21.8 21.7 22.2
High 38.8 40.8 43.7 46.1 44.8 45.8 49.6 48.1 47.7 46.3 45.6
Income not used or not applicable 8.7 6.9 5.5 5.0 6.2 12.1 8.9 11.4 10.9 10.9 10.0
All 100 100 100 100 100 100 100 100 100 100 100
Neighborhood income4
Low or moderate 15.3 16.5 17.9 16.1 11.9 7.7 7.2 7.4 10.1 12.1 13.1
Middle 50.0 51.3 52.0 52.2 51.9 47.5 46.1 46.1 41.9 43.8 45.2
High 33.9 31.6 29.4 31.0 35.2 43.5 46.0 46.0 47.6 43.9 41.4
All 100 100 100 100 100 100 100 100 100 100 100
Memo
Number of home-purchase loans
(thousands) 4,660 4,836 4,298 3,331 2,533 2,391 2,157 2,018 2,284 2,615 2,737
Number of refinance loans (thousands) 6,412 5,692 4,397 3,588 2,869 5,243 4,481 3,823 5,888 4,341 1,921
Note: First-lien mortgages for one- to four-family family, owner-occupied, site-built homes. Rows may not sum to 100 because of rounding or,
for the distribution by neighborhood income, because property location is missing.
1
Applications are placed in one category for race and ethnicity. The application is designated as joint if one applicant was reported as white
and the other was reported as one or more minority races or if the application is designated as white with one Hispanic applicant and one
non-Hispanic applicant. If there are two applicants and each reports a different minority race, the application is designated as two or more
minority races. If an applicant reports two races and one is white, that applicant is categorized under the minority race. Otherwise, the
applicant is categorized under the first race reported. “Missing” refers to applications in which the race of the applicant(s) has not been
reported or is not applicable or the application is categorized as white but ethnicity has not been reported.
2
Consists of applications by American Indians or Alaska Natives, Native Hawaiians or other Pacific Islanders, and borrowers reporting two or
more minority races.
3
The categories for the borrower-income group are as follows: Low- or moderate-income (or LMI) borrowers have income that is less than
80 percent of estimated current area median family income (AMFI), middle-income borrowers have income that is at least 80 percent and
less than 120 percent of AMFI, and high-income borrowers have income that is at least 120 percent of AMFI.
4
The categories for the neighborhood-income group are based on the ratio of census-tract median family income to area median family
income from the 2006–10 American Community Survey data for 2012 and 2013 and from the 2000 census for 2004–11, and the three
categories have the same cutoffs as the borrower-income groups (see note 3).
The 2014 Home Mortgage Disclosure Act Data 9
census data and 2006–10 American Community Survey data, whereas the 2004–11 data
relied on 2000 census income and population data.21
One way to examine how lending to LMI borrowers and neighborhoods changed between
2013 and 2014 in the absence of changes to metropolitan statistical area (MSA) definitions
is to focus exclusively on lending in MSAs whose boundaries remained the same across the
two years. There are 282 such MSAs, and they accounted for about half of all HMDA-re-
ported mortgage originations in 2013 and 2014 combined. In these MSAs, changes in the
share of loans to different income groups largely mirror the nationwide patterns shown in
table 2 (numbers for the 282 MSAs not shown in tables).
Table 3 shows the average dollar value of home-purchase and refinance loans by different
groups and how these averages have changed over time. All dollar amounts are reported in
nominal terms. Overall, home-purchase dollar values follow the historical trend of home
prices, rising during the mid-2000s, falling sharply through 2008 and 2009, then beginning
to recover in the past few years. The trends differ substantially by race and ethnicity, how-
ever. The average home-purchase loan to a Hispanic white borrower in 2014 was for
$198,000, up from $190,000 in 2013 but well below the peak of $238,000 in 2006. In con-
trast, the average home-purchase loan amount for a non-Hispanic white borrower was
about $231,000 in 2014, higher than the pre-crisis peak in 2007 of about $222,000. Asian
borrowers took out the largest loans, averaging $344,000 for home purchases and $343,000
for refinancings in 2014, whereas loans to black borrowers averaged $199,000 for home
purchases and $175,000 for refinancings.22
In terms of borrower income, for LMI borrowers, the average home-purchase loan edged
down from $133,000 in 2013 to $132,000 in 2014; it also edged down for middle-income
borrowers. High-income borrowers saw their average home-purchase loan value rise to
$328,000 in 2014 from $323,000 in 2013. The average refinance loan value declined for LMI
borrowers but rose for middle- and high-income borrowers, while the average loan value for
both home-purchase and refinance loans rose in LMI, middle-income, and high-income
neighborhoods. Refinance loans in high-income neighborhoods increased the most in aver-
age value, to $293,000 in 2014 from $270,000 in 2013.
Variation across Demographic Groups in Nonconventional Loan Use
Table 4 shows that black and Hispanic white borrowers are much more likely to use non-
conventional loans (FHA, VA, RHS, and FSA loans) than conventional loans compared
with other racial and ethnic groups. In 2014, 68 percent of black home-purchase borrowers
and 60 percent of Hispanic white home-purchase borrowers took out a nonconventional
loan, compared with about 33 percent of non-Hispanic white home-purchase borrowers
and just 15 percent of Asian home-purchase borrowers. These numbers have declined from
their peaks in 2009 and 2010, when over three-fourths of black and Hispanic white home-
purchase borrowers, and over one-half of non-Hispanic white home-purchase borrowers,
took out nonconventional loans.
Nonconventional usage is also more prevalent for borrowers with lower incomes and in
neighborhoods with lower incomes. In 2014, about one-half of LMI home-purchase bor-
rowers and 48 percent of those borrowing to purchase homes in LMI neighborhoods used
21
For more information on the transition to the new census-tract data, see Robert B. Avery, Neil Bhutta, Kenneth
P. Brevoort, and Glenn B. Canner (2012), “The Mortgage Market in 2011: Highlights from the Data Reported
under the Home Mortgage Disclosure Act,” Federal Reserve Bulletin, vol. 98 (December), pp. 1–46, www
.federalreserve.gov/pubs/bulletin/2012/default.htm.
22
Median loan amounts (not shown in tables) followed similar trends as average loan amounts.
10 Federal Reserve Bulletin | November 2015
nonconventional loans, compared with 24 percent of high-income borrowers and 26 per-
cent of borrowers in high-income neighborhoods. With respect to refinance loans, minority
and lower-income borrowers are again more likely to use nonconventional than conven-
tional loans. In general, however, nonconventional loans are less prevalent in refinance
lending.23
23
The reported nonconventional share of refinance loans is lower than the true share for the groups categorized
Table 3. Average value of home loans, by purpose of loan, 2004–14
Thousands of dollars, nominal
Characteristic of borrower and of
neighborhood 2004 2005 2006 2007 2008 2009 2010 2011 2012 2013 2014
A. Home purchase
Borrower race and ethnicity1
Asian 280 316 326 334 299 276 293 291 304 328 344
Black or African American 166 183 197 197 184 172 174 174 179 193 199
Hispanic white 189 224 238 220 186 168 168 168 176 190 198
Non-Hispanic white 193 211 216 222 209 195 204 204 213 226 231
Other minority2
206 240 257 245 216 196 201 198 206 219 229
Joint 233 255 261 269 255 248 263 261 274 289 293
Missing 216 248 261 280 265 242 256 262 279 298 293
Borrower income3
Low or moderate 114 116 117 123 128 129 128 125 131 133 132
Middle 165 170 170 176 182 187 189 184 192 194 193
High 281 306 313 317 297 291 303 302 313 323 328
Income not used or not applicable 208 235 254 266 218 195 214 225 233 262 272
Neighborhood income4
Low or moderate 159 180 189 188 175 160 164 163 158 171 178
Middle 172 190 197 196 186 174 177 173 178 191 196
High 258 284 294 301 277 257 270 271 282 300 307
Memo: All home-purchase loans 201 221 228 232 217 202 210 210 221 235 240
B. Refinance
Borrower race and ethnicity1
Asian 274 325 370 368 321 298 313 309 308 304 343
Black or African American 151 180 199 192 173 184 180 174 181 171 175
Hispanic white 178 219 252 244 193 190 191 183 190 180 190
Non-Hispanic white 180 205 221 222 205 209 210 208 212 205 217
Other minority2
190 229 269 258 211 217 218 207 213 201 215
Joint 210 246 265 262 243 247 254 249 254 248 267
Missing 194 226 246 250 242 243 248 253 253 244 247
Borrower income3
Low or moderate 114 124 124 126 129 138 133 128 135 128 124
Middle 162 181 183 181 180 185 179 174 182 171 175
High 256 294 320 311 275 268 274 280 277 276 302
Income not used or not applicable 150 178 240 240 194 204 203 185 212 192 202
Neighborhood income4
Low or moderate 142 169 188 185 164 172 172 167 163 153 158
Middle 158 184 201 198 182 184 182 175 181 173 181
High 245 282 313 311 272 259 265 269 269 270 293
Memo: All refinance loans 185 212 232 231 212 216 220 218 221 213 224
Note: First-lien mortgages for one- to four-family, owner-occupied, site-built homes.
1
See table 2, note 1.
2
See table 2, note 2.
3
See table 2, note 3.
4
See table 2, note 4.
The 2014 Home Mortgage Disclosure Act Data 11
Black and Hispanic white borrowers tend to have lower incomes, on average, than non-His-
panic white borrowers. Still, racial and ethnic differences in nonconventional loan use per-
sist within income groups. Figure 5 displays the nonconventional share of home-purchase
and refinance loans for Asian, black, Hispanic white, and non-Hispanic white borrowers
split into LMI, middle-income, and high-income groups. For home-purchase loans, black
by borrower income because, in most nonconventional refinance loans, income is not reported. Thus, when
income is reported on a refinance loan, the loan is likely to be conventional.
Table 4. Nonconventional share of home loans, by purpose of loan, 2004–14
Percent except as noted
Characteristic of borrower and
of neighborhood
of borrower
2004 2005 2006 2007 2008 2009 2010 2011 2012 2013 2014
A. Home purchase
Borrower race and ethnicity1
Asian 2.9 1.8 2.1 2.6 13.4 26.1 26.6 25.8 21.9 16.0 14.7
Black or African American 21.7 14.3 13.6 21.7 64.1 82.0 82.9 80.3 77.2 70.6 68.0
Hispanic white 13.7 7.5 7.0 12.4 51.4 75.4 77.0 74.1 70.7 62.8 59.5
Non-Hispanic white 11.1 8.9 9.5 11.5 35.4 52.0 50.3 47.4 42.2 35.3 33.4
Other minority2
14.0 9.3 9.4 14.8 48.4 67.6 68.8 65.9 62.2 55.3 53.9
Joint 16.9 12.8 14.4 17.2 46.4 59.4 56.3 53.6 48.9 41.8 41.3
Missing 11.3 5.1 5.7 8.8 32.7 50.6 49.4 45.9 39.4 31.9 32.2
Borrower income3
Low or moderate 20.3 15.2 14.9 16.0 46.1 65.3 66.6 64.5 59.7 52.3 50.2
Middle 14.3 11.0 12.6 16.8 46.1 60.4 59.3 57.0 51.5 45.5 44.7
High 5.3 3.9 4.9 7.5 26.7 38.5 37.2 34.3 29.5 25.0 24.2
Neighborhood income4
Low or moderate 15.8 9.7 9.6 13.8 45.5 64.4 65.1 61.2 57.9 49.6 48.0
Middle 14.1 10.2 10.8 14.2 42.7 59.8 59.4 56.9 52.0 44.5 43.0
High 7.1 5.4 6.1 7.6 27.4 43.4 42.0 39.5 34.6 28.0 26.1
Memo: All borrowers 11.9 8.5 9.0 11.8 37.6 54.4 53.4 50.5 45.2 38.0 36.6
B. Refinance
Borrower race and ethnicity1
Asian 1.2 .7 .6 1.0 4.6 5.7 4.7 4.3 5.9 6.7 6.9
Black or African American 11.1 5.8 4.4 10.2 39.2 53.8 42.0 37.8 38.6 37.0 40.3
Hispanic white 5.6 2.6 1.9 3.9 20.5 36.2 28.1 22.9 26.9 25.7 21.4
Non-Hispanic white 4.0 2.4 2.6 4.9 15.9 16.8 13.6 12.2 14.2 14.8 16.5
Other minority2
5.5 3.4 2.4 4.9 20.0 28.3 23.3 21.9 25.5 24.9 25.7
Joint 7.5 3.7 3.4 6.2 19.5 21.1 16.6 16.3 20.1 20.4 26.6
Missing 4.2 1.9 1.7 4.1 18.7 19.0 12.5 13.6 16.5 16.8 21.8
Borrower income3
Low or moderate 2.3 1.6 2.9 5.7 18.3 16.6 14.0 11.5 9.3 9.4 13.0
Middle 1.7 1.3 2.7 6.2 19.6 13.2 12.2 10.9 8.9 9.6 13.3
High .8 .6 1.1 2.7 10.5 7.2 6.7 6.3 5.5 6.2 8.8
Neighborhood income4
Low or moderate 5.9 3.2 2.9 6.3 24.6 31.3 23.1 19.7 22.2 22.1 23.0
Middle 5.2 3.0 2.9 5.8 20.2 22.3 17.5 16.1 18.4 18.9 21.3
High 2.9 1.7 1.6 3.0 11.3 12.1 10.0 9.3 11.7 12.4 14.6
Memo: All borrowers 4.6 2.6 2.5 5.0 17.6 18.7 14.4 13.3 15.6 16.4 18.7
Note: First-lien mortgages for one- to four-family, owner-occupied, site-built homes. Nonconventional loans are those insured by the Federal
Housing Administration or backed by guarantees from the U.S. Department of Veterans Affairs, the Farm Service Agency, or the Rural Housing
Service.
1
See table 2, note 1.
2
See table 2, note 2.
3
See table 2, note 3.
4
See table 2, note 4.
12 Federal Reserve Bulletin | November 2015
and Hispanic white borrowers were much more likely than non-Hispanic white borrowers
to get nonconventional loans within each income grouping. For refinance loans, a substan-
tial black–white gap persists across income groups, but LMI and middle-income Hispanic
white borrowers use nonconventional loans at approximately the same rate as their non-
Hispanic white counterparts.
Greater reliance on nonconventional loans may reflect the relatively low down-payment
requirements of the FHA and VA lending programs, which serve the needs of borrowers
who have few assets to meet down-payment and closing-cost requirements.24
The patterns
of product incidence could also reflect the behavior of lenders to some extent; for example,
concerns have been raised about the possibility that lenders steer borrowers in certain
neighborhoods toward nonconventional loans.25
24
Findings of the Federal Reserve Board’s Survey of Consumer Finances for 2010 indicate that liquid asset levels
and financial wealth holdings for minorities and lower-income groups are substantially smaller than they are for
non-Hispanic white borrowers or higher-income populations. See Board of Governors of the Federal Reserve
System, “2010 Survey of Consumer Finances,” webpage, www.federalreserve.gov/econresdata/scf/scf_2010.htm.
25
See, for example, Glenn B. Canner, Stuart A. Gabriel, and J. Michael Woolley (1991), “Race, Default Risk and
Figure 5. Nonconventional share of originations, by borrower race, ethnicity, and income, 2014
A. Home purchase
0
20
40
60
80
0
10
20
30
Percent of originations
B. Refinance
Low or moderate income Middle income High income
Asian Black or African American Hispanic white Non-Hispanic white
Note: The data are annual. Mortgage originations for first-lien, one- to four-family, owner-occupied properties. For definition of borrower race
and ethnicity, see table 2, note 1. For explanation of borrower income, see table 2, note 3. For definition of nonconventional loans, see table 5,
note 1.
The 2014 Home Mortgage Disclosure Act Data 13
Denial Rates and Denial Reasons
In 2014, the overall denial rate on applications for home-purchase loans of 13.2 percent
was somewhat lower than in 2013, while the denial rate for refinance loan applications of
30.6 percent was substantially higher than in 2013 (table 5).26
Over longer horizons, denial
rates have exhibited significant variation, and these changes differ by type of loan. For
example, for conventional home-purchase loan applications, the denial rate of 11.7 percent
in 2014 was 6.8 percentage points lower than in 2006, while for nonconventional home-pur-
chase loan applications, the denial rate of 15.6 percent in 2014 was 3.5 percentage points
higher than in 2006. Changes in raw denial rates over time reflect not only changes in credit
standards, but also changes in the demand for credit and in the composition of borrowers
applying for mortgages. For example, the denial rate on applications for conventional
home-purchase loans was lower in 2014 than during the housing boom years, even though
most measures of credit availability suggest that credit standards are tighter today.27
This
result may stem from a relatively large drop in applications from riskier applicants.
As in past years, black, Hispanic white, and “other minority” borrowers had notably higher
denial rates in 2014 than non-Hispanic white borrowers, while denial rates for Asian bor-
rowers were more similar to those for non-Hispanic white borrowers. For example, the
denial rates for conventional home-purchase loans were about 25 percent for black borrow-
ers, 19 percent for Hispanic white borrowers, 20 percent for other minority borrowers,
12 percent for Asian borrowers, and 10 percent for non-Hispanic white borrowers.
Previous research and experience gained in the fair lending enforcement process show that
differences in denial rates and in the incidence of higher-priced lending (the topic of the
next subsection) among racial or ethnic groups stem, at least in part, from factors related to
credit risk that are not available in the HMDA data, such as credit history (including credit
scores) and LTV ratios. Differential costs of loan origination and the competitive environ-
ment also may bear on the differences in pricing, as may differences across populations in
credit-shopping activities.
Despite these limitations, the HMDA data play an important role in fair lending enforce-
ment. The data are regularly used by bank examiners to facilitate the fair lending examina-
tion and enforcement processes. When examiners for the federal banking agencies evaluate
an institution’s fair lending risk, they analyze HMDA price data and loan application
outcomes in conjunction with other information and risk factors that can be drawn directly
from loan files or electronic records maintained by lenders, as directed by the Interagency
Fair Lending Examination Procedures.28
The availability of broader information allows the
examiners to draw stronger conclusions about institution compliance with the fair lending
laws.
Lenders can, but are not required to, report up to three reasons for denying a mortgage
application, selecting from nine potential denial reasons (table 6). Among denied first-lien
applications for one- to four-family, owner-occupied, site-built properties in 2014, about
Mortgage Lending: A Study of the FHA and Conventional Loan Markets,” Southern Economic Journal,
vol. 58 (July), pp. 249–62.
26
Denial rates are calculated as the number of denied loan applications divided by the total number of applica-
tions, excluding withdrawn applications and application files closed for incompleteness.
27
Both the Mortgage Bankers Association and the Urban Institute publish indexes of mortgage credit availability
suggesting that standards have been much tighter since the crisis. See Wei Li, Laurie Goodman, Ellen Seidman,
Jim Parrott, Jun Zhu, and Bing Bai (2014), “Measuring Mortgage Credit Accessibility,” working paper (Wash-
ington: Urban Institute, November), www.urban.org/research/publication/measuring-mortgage-credit-
accessibility.
28
The Interagency Fair Lending Examination Procedures are available at www.ffiec.gov/PDF/fairlend.pdf.
14 Federal Reserve Bulletin | November 2015
75 percent of denied home-purchase applications and about 63 percent of denied refinance
applications had at least one reported denial reason. The two most frequently cited denial
reasons for both home-purchase and refinance loans were the applicant’s credit history and
DTI ratio (note that the columns in table 6 can add up to more than 100 percent because
lenders can cite more than one denial reason). For both home-purchase and refinance
Table 5. Denial rates, by purpose of loan, 2004–14
Percent
Type of loan and
race and ethnicity
of borrower
2004 2005 2006 2007 2008 2009 2010 2011 2012 2013 2014
A. Home purchase
Conventional and nonconventional1
All applicants 14.4 16.0 18.0 18.7 18.0 15.5 15.6 15.8 14.9 14.5 13.2
Asian 13.7 15.9 16.9 17.5 19.2 16.3 15.8 16.5 15.8 15.1 13.9
Black or African American 23.6 26.5 30.3 33.5 30.6 25.5 24.8 26.0 26.0 25.5 22.7
Hispanic white 18.3 21.1 25.1 29.5 28.3 22.2 21.8 21.1 20.2 20.5 18.1
Non-Hispanic white 11.1 12.2 12.9 13.3 14.0 12.8 12.9 13.1 12.5 12.2 11.0
Other minority2
19.4 20.8 24.0 26.7 25.5 21.2 21.9 20.9 20.8 21.5 18.8
Conventional only
All applicants 14.6 16.3 18.5 19.0 18.3 15.8 15.2 15.1 13.6 12.9 11.7
Asian 13.7 16.0 17.1 17.5 19.1 15.8 14.8 15.5 14.4 13.9 13.0
Black or African American 25.0 27.8 31.9 35.7 37.6 35.8 33.6 33.2 32.0 28.5 24.6
Hispanic white 18.6 21.4 25.7 30.5 32.5 26.9 24.9 24.2 22.4 21.5 18.7
Non-Hispanic white 11.2 12.3 13.2 13.3 14.1 13.3 12.9 12.7 11.6 10.9 9.8
Other minority2
19.7 21.2 24.8 27.8 29.0 25.9 28.0 24.6 23.6 22.6 20.1
Nonconventional only1
All applicants 13.3 12.5 12.1 16.2 17.4 15.3 16.0 16.5 16.3 17.0 15.6
Asian 12.6 11.6 10.6 15.5 20.2 17.7 18.6 19.3 20.2 20.7 18.6
Black or African American 17.7 16.8 16.2 22.8 25.3 22.6 22.7 23.9 24.0 24.2 21.7
Hispanic white 16.3 17.2 15.7 20.5 23.1 20.4 20.7 19.9 19.3 20.0 17.7
Non-Hispanic white 10.7 10.2 10.0 13.1 13.9 12.5 13.0 13.6 13.7 14.4 13.2
Other minority2
16.8 16.3 15.2 18.6 20.9 18.7 18.7 18.8 18.9 20.5 17.7
B. Refinance
Conventional and nonconventional1
All applicants 29.5 32.6 35.4 39.6 37.7 24.0 23.3 23.8 19.9 22.7 30.6
Asian 18.8 23.5 27.5 32.6 32.5 21.4 19.5 20.1 17.3 20.5 27.5
Black or African American 39.9 42.2 44.1 52.0 56.0 42.2 41.7 40.0 32.8 33.9 45.4
Hispanic white 28.7 30.1 33.2 43.0 49.1 36.4 33.4 33.2 27.5 28.7 36.0
Non-Hispanic white 24.1 26.9 30.1 33.7 32.2 20.7 20.6 21.3 17.8 20.0 27.1
Other minority2
33.7 35.5 40.6 52.0 57.4 37.3 35.3 34.4 30.0 30.5 41.3
Conventional only
All applicants 30.1 32.9 35.6 39.9 37.0 22.1 21.3 22.3 19.4 22.0 29.0
Asian 18.8 23.5 27.5 32.5 31.5 20.2 18.5 19.4 17.0 20.0 26.6
Black or African American 41.7 43.0 44.7 53.3 60.9 48.6 41.4 40.6 34.8 35.1 46.5
Hispanic white 29.3 30.2 33.3 43.2 50.2 38.9 33.6 33.5 28.9 29.8 36.5
Non-Hispanic white 24.6 27.1 30.4 33.9 31.5 19.1 18.9 20.1 17.4 19.4 25.7
Other minority2
34.5 35.7 40.9 52.6 59.4 38.4 34.8 34.4 31.1 31.0 40.3
Nonconventional only1
All applicants 15.0 20.1 21.9 31.6 40.9 31.1 33.3 32.2 22.2 25.9 36.5
Asian 15.0 20.0 22.0 38.5 48.9 37.2 34.2 32.7 22.2 26.1 37.5
Black or African American 17.5 23.6 24.6 33.7 43.5 35.1 42.2 39.1 29.5 31.6 43.8
Hispanic white 15.7 23.6 26.3 34.6 43.4 31.4 33.0 32.3 23.3 25.4 34.4
Non-Hispanic white 12.0 17.6 19.7 28.3 36.1 27.4 29.3 29.0 19.7 23.0 33.7
Other minority2
15.2 25.8 22.2 34.8 45.4 34.1 37.0 34.4 26.6 28.9 43.9
Note: First-lien mortgages for one- to four-family, owner-occupied, site-built homes. Excludes applications where no credit decision was made.
For a description of how borrowers are categorized by race and ethnicity, see table 2, note 1.
1
Nonconventional loans are those insured by the Federal Housing Administration or backed by guarantees from the U.S. Department of
Veterans Affairs, the Farm Service Agency, or the Rural Housing Service.
2
See table 2, note 2.
The 2014 Home Mortgage Disclosure Act Data 15
applications, collateral is more likely to be cited as a denial reason on conventional than
nonconventional applications. For refinance applications, the DTI ratio is more likely to be
cited as a denial reason on conventional than nonconventional applications.
Table 6. Reasons for denial, by purpose of loan, 2014
Percent
Type of loan and
race and ethnicity
of borrower
Debt-to-
income
ratio
Employ-
ment
history
Credit
history Collateral
Insuf-
ficient
cash
Unveri-
fiable
infor-
mation
Credit
applica-
tion
incom-
plete
Mortgage
insurance
denied
Other
No
reason
given
A. Home purchase
Conventional and nonconventional1
All applicants 23.1 3.7 22.2 12.9 6.5 5.2 9.5 .6 10.5 25.2
Asian 28.3 4.7 13.5 12.0 7.6 8.7 13.5 .6 11.4 20.5
Black or African American 25.1 2.9 28.2 9.6 7.3 4.6 6.9 .6 10.0 27.3
Hispanic white 25.0 3.9 20.8 11.1 6.6 5.8 6.8 .5 12.0 28.4
Non-Hispanic white 21.9 3.8 21.8 14.1 6.2 4.9 9.8 .7 10.3 25.2
Other minority2
23.6 3.4 26.6 9.7 7.3 5.3 7.0 .7 11.3 26.6
Conventional only
All applicants 23.7 3.2 20.9 15.0 7.2 5.6 10.8 1.0 10.2 22.7
Asian 28.1 4.5 11.8 12.8 8.1 9.1 14.9 .7 11.3 19.4
Black or African American 24.5 2.2 32.2 12.1 8.5 4.3 6.9 1.4 10.1 23.4
Hispanic white 25.4 3.1 22.1 13.8 7.6 6.1 7.5 1.0 12.5 24.1
Non-Hispanic white 23.0 3.3 20.1 16.2 6.8 5.3 11.0 1.0 9.6 23.0
Other minority2
24.0 3.4 26.7 10.1 8.0 6.0 7.6 1.0 11.2 25.8
Nonconventional only1
All applicants 22.3 4.3 23.8 10.3 5.6 4.7 7.9 .1 11.0 28.5
Asian 29.0 5.2 20.0 9.2 5.8 7.3 7.9 .1 11.8 24.8
Black or African American 25.5 3.3 25.9 8.2 6.6 4.8 6.8 .1 10.0 29.5
Hispanic white 24.8 4.5 19.9 9.2 5.8 5.7 6.2 .2 11.6 31.5
Non-Hispanic white 20.4 4.6 24.2 11.1 5.3 4.4 8.1 .2 11.3 28.3
Other minority2
23.1 3.4 26.5 9.2 6.6 4.6 6.4 .4 11.3 27.4
B. Refinance
Conventional and nonconventional1
All applicants 15.8 1.0 18.4 15.3 2.9 3.0 10.4 .1 8.1 36.5
Asian 25.4 1.6 15.3 12.3 3.3 5.3 10.0 .2 9.7 31.3
Black or African American 11.5 .5 20.0 12.8 3.3 2.0 7.7 .1 7.6 44.9
Hispanic white 19.4 1.0 20.6 11.4 3.6 3.6 7.7 .2 9.5 36.2
Non-Hispanic white 15.9 1.0 17.8 16.3 2.8 3.0 10.4 .1 8.0 35.9
Other minority2
16.4 .7 18.9 12.2 3.0 2.9 7.7 .1 8.3 41.1
Conventional only
All applicants 18.7 1.1 19.8 15.7 2.8 3.4 10.3 .2 8.2 32.8
Asian 27.1 1.7 15.4 12.7 3.3 5.6 10.0 .2 9.8 29.3
Black or African American 14.6 .6 23.0 12.9 2.7 2.2 7.6 .2 7.1 41.0
Hispanic white 21.7 1.0 21.5 11.8 3.4 3.8 7.5 .2 9.0 34.4
Non-Hispanic white 18.5 1.1 19.1 16.7 2.7 3.3 10.3 .2 8.1 32.4
Other minority2
19.8 .8 21.2 12.5 2.9 3.2 7.8 .1 8.7 35.9
Nonconventional only1
All applicants 7.0 .7 14.0 14.1 3.3 2.0 10.7 .03 7.7 47.7
Asian 11.5 1.0 14.7 9.4 3.1 3.2 9.7 .05 9.3 47.5
Black or African American 6.2 .4 15.2 12.7 4.2 1.7 7.7 .01 8.3 51.3
Hispanic white 10.1 .9 17.1 9.7 4.8 2.7 8.6 .05 11.5 43.1
Non-Hispanic white 7.0 .7 13.4 15.0 3.1 2.0 10.7 .03 7.6 47.6
Other minority2
7.8 .4 13.3 11.6 3.4 2.1 7.6 .03 7.2 54.4
Note: Denied first-lien mortgage applications for one- to four-family, owner-occupied, site-built homes. Columns sum to more than 100 because
lenders may report up to three denial reasons. For a description of how borrowers are categorized by race and ethnicity, see table 2, note 1.
1
See table 5, note 1.
2
See table 2, note 2.
16 Federal Reserve Bulletin | November 2015
Denial reasons vary across racial and ethnic groups to some degree. For example, among
denied home-purchase loan applications in 2014, credit history was cited as a denial reason
for 28 percent of denied black applicants, 21 percent of denied Hispanic white applicants,
22 percent of denied non-Hispanic white applicants, and just 13 percent of denied Asian
applicants. The DTI ratio was cited most often as a denial reason for Asian home-purchase
applicants at 28 percent, compared with 22 percent for non-Hispanic white applicants at
the lower end. Finally, collateral was cited most often as a denial reason on home-purchase
applications for non-Hispanic white applicants at 14 percent, compared with 10 percent for
black applicants.
The Incidence of Higher-Priced Lending
Current price-reporting rules under HMDA, in effect since October 2009, define higher-
priced first-lien loans as those with an annual percentage rate (APR) of at least 1.5 percent-
age points above the average prime offer rate (APOR) for loans of a similar type (for
example, a 30-year fixed-rate mortgage).29
The spread for junior-lien loans must be at least
3.5 percentage points for such loans to be considered higher priced. The APOR, which is
published weekly by the Federal Financial Institutions Examination Council, is an estimate
of the APR on loans being offered to high-quality prime borrowers based on the contract
interest rates and discount points reported by Freddie Mac in its Primary Mortgage
Market Survey.30
In 2014, the fraction of home-purchase loans (again, first liens for one- to four-family,
owner-occupied, site-built properties) above the higher-priced threshold increased to
11.5 percent from 7.1 percent in 2013 (table 7.A). This increase stemmed from a rise in the
higher-priced share of nonconventional loans from 13.8 percent to 26 percent, while the
higher-priced share of conventional loans increased only slightly, from 2.9 percent to
3.1 percent.
The higher-priced fraction of FHA home-purchase loans spiked from about 5 percent in
early 2013 to about 40 percent after May 2013 and continued at monthly rates between 35
and 52 percent through 2014, for an annual average incidence of about 44 percent in 2014
(table 8). In contrast, less than 1 percent of VA and FSA/RHS home-purchase loans
were higher priced in 2014. Increases in the FHA’s MIP and the term length over which it
must be paid appear to have pushed many FHA home-purchase loans just over the report-
ing threshold; as shown in table 8, over 75 percent of higher-priced FHA home-purchase
loans were within 0.5 percentage point of the higher-priced threshold. With the FHA
reducing the MIP by 0.5 percentage point in January 2015, the fraction of FHA borrowers
above the reporting threshold may fall in next year’s data.
There was a smaller increase in the higher-priced fraction of refinance mortgages—to
3.3 percent from 1.9 percent in 2013 (as shown in table 7.A). This increase was also largely
driven by the higher-priced share of FHA refinance loans, which rose to 15.7 percent from
6.2 percent in 2013.
Table 7.A also shows that, in 2014 as well as earlier years, black and Hispanic white bor-
rowers had the highest incidences of higher-priced loans within both the conventional and
29
For more information about the rule changes related to higher-priced lending and the ways in which they affect
the incidence of reported higher-priced lending over time, see Avery and others, “The 2009 HMDA Data,” in
note 11.
30
See Freddie Mac, “Mortgage Rates Survey,” webpage, www.freddiemac.com/pmms; and Federal Financial
Institutions Examination Council, “FFIEC Rate Spread Calculator,” webpage, www.ffiec.gov/ratespread/
newcalc.aspx.
The 2014 Home Mortgage Disclosure Act Data 17
nonconventional loan types. The table provides the raw rates of higher-priced lending by
group from 2004 to 2014, but, as discussed in detail in previous Bulletin articles, the raw
rates reported in the public HMDA data can be difficult to compare over longer time hori-
zons for two main reasons. First, a different price-reporting rule was in place prior to Octo-
ber 2009, with the spread between a mortgage’s APR and the rate on a Treasury bond of
Table 7. Incidence of higher-priced lending, by purpose of loan, 2004–14
A. Unadjusted
Percent
Type of loan and
race and ethnicity
of borrower
2004 2005 2006 2007 2008 2009 2010 2011 2012 2013 2014
Home purchase
Conventional and nonconventional1
All borrowers 9.8 22.5 23.2 12.7 8.1 4.6 2.2 3.3 3.1 7.1 11.5
Asian 5.5 16.3 16.4 7.6 4.0 2.4 1.0 1.5 1.4 3.0 5.1
Black or African American 24.3 46.7 46.4 27.6 14.5 7.1 3.0 5.0 5.3 14.2 25.5
Hispanic white 17.5 42.0 43.3 25.9 15.8 8.1 3.9 6.1 5.9 16.8 28.3
Non-Hispanic white 7.8 15.5 16.0 9.6 7.2 4.3 2.2 3.1 2.9 6.1 9.4
Other minority2
14.4 30.3 30.7 16.1 9.1 5.3 2.3 3.5 3.4 8.7 13.5
Conventional only
All borrowers 11.0 24.5 25.3 14.0 7.3 4.6 3.3 3.8 3.2 2.9 3.1
Asian 5.6 16.6 16.7 7.7 3.3 1.9 1.0 1.3 1.2 1.1 1.5
Black or African American 30.6 54.1 53.4 34.0 17.4 8.7 6.1 8.0 6.7 6.1 7.7
Hispanic white 20.0 45.3 46.3 28.9 17.7 11.0 9.6 10.7 8.7 7.3 6.5
Non-Hispanic white 8.6 16.9 17.5 10.5 6.5 4.8 3.4 3.9 3.2 2.9 3.0
Other minority2
16.1 33.3 33.6 18.5 9.5 6.7 4.6 5.5 5.1 4.9 5.0
Nonconventional only1
All borrowers 1.2 .9 1.8 3.0 9.5 4.6 1.3 2.7 3.0 13.8 26.0
Asian 2.4 .6 .8 1.3 8.2 3.9 .8 2.0 1.9 13.1 26.0
Black or African American 1.4 1.6 2.5 4.5 12.8 6.8 2.4 4.3 4.9 17.6 33.8
Hispanic white 2.0 1.4 3.5 4.5 14.0 7.1 2.2 4.5 4.8 22.4 43.0
Non-Hispanic white 1.0 .7 1.5 2.5 8.4 3.9 1.0 2.3 2.6 12.0 22.2
Other minority2
4.4 .7 2.1 2.4 8.8 4.7 1.2 2.5 2.4 11.7 20.7
Refinance
Conventional and nonconventional1
All borrowers 14.5 25.0 30.3 21.0 10.9 3.8 1.8 2.1 1.5 1.9 3.3
Asian 5.8 15.1 19.5 12.5 3.1 .9 .4 .5 .4 .5 1.1
Black or African American 30.0 46.2 50.7 38.1 22.8 9.0 6.5 6.8 4.1 3.8 5.7
Hispanic white 18.2 32.6 36.9 26.5 15.1 7.0 4.4 4.4 2.6 3.1 4.8
Non-Hispanic white 12.3 20.4 25.0 17.6 10.2 3.7 1.8 2.2 1.5 2.0 3.3
Other minority2
17.6 26.9 32.3 23.8 13.9 4.7 2.6 2.6 2.0 2.2 3.0
Conventional only
All borrowers 15.2 25.7 31.0 21.8 10.4 3.1 1.3 1.5 1.2 1.5 2.2
Asian 5.8 15.2 19.6 12.5 2.9 .7 .2 .3 .3 .3 .7
Black or African American 33.7 49.0 52.8 41.5 27.6 9.9 4.0 4.2 2.9 3.3 4.1
Hispanic white 19.2 33.4 37.5 27.3 16.0 7.2 3.3 3.3 2.3 2.4 2.8
Non-Hispanic white 12.8 20.9 25.6 18.2 9.8 3.1 1.3 1.6 1.2 1.6 2.4
Other minority2
18.2 27.7 32.9 24.5 14.7 4.8 1.9 2.2 1.7 2.0 2.2
Nonconventional only1
All borrowers 1.5 .9 3.1 6.6 13.2 6.7 4.9 5.9 3.2 3.9 7.9
Asian 3.6 2.1 2.5 4.9 8.9 4.8 3.1 4.0 1.8 2.6 6.8
Black or African American 1.0 1.2 4.1 7.8 15.2 8.2 9.8 10.9 6.0 4.6 8.1
Hispanic white 2.0 .9 2.6 6.2 11.6 6.6 7.3 7.9 3.6 5.1 11.8
Non-Hispanic white 1.3 .7 2.8 6.0 12.1 6.5 4.6 5.9 3.3 4.2 8.3
Other minority2
8.1 3.9 9.6 9.9 10.5 4.5 4.6 4.3 2.9 2.9 5.2
Note: First-lien mortgages for one- to four-family, owner-occupied, site-built homes. For a description of how borrowers are categorized by race
and ethnicity, see table 2, note 1.
1
See table 5, note 1.
2
See table 2, note 2.
18 Federal Reserve Bulletin | November 2015
comparable term (rather than the APOR) reported if it rose above 3 percentage points.31
Second, the previous price-reporting rule created unintended distortions in reporting over
31
The reporting threshold for junior liens was 5 percentage points.
Table 7. Incidence of higher-priced lending, by purpose of loan, 2004–14
B. Adjusted
Percent
Type of loan and
race and ethnicity
of borrower
2004 2005 2006 2007 2008 2009 2010 2011 2012 2013 2014
Home purchase
Conventional and nonconventional1
All borrowers 7.4 18.3 17.1 6.3 1.3 1.3 .6 .8 .8 .7 .8
Asian 3.8 13.0 11.4 3.1 .5 .5 .3 .3 .3 .3 .4
Black or African American 19.3 40.3 38.5 16.7 1.9 1.3 .6 .7 .9 1.1 1.2
Hispanic white 12.3 34.5 32.8 13.0 2.1 1.4 1.0 1.3 1.6 1.6 1.6
Non-Hispanic white 5.8 12.1 10.9 4.3 1.3 1.4 .7 .8 .8 .7 .7
Other minority2
10.5 24.7 22.7 8.0 1.5 1.4 .8 .9 1.1 .9 .9
Conventional only
All borrowers 8.2 20.0 18.7 7.1 1.9 2.3 1.3 1.4 1.2 .9 .8
Asian 3.8 13.3 11.6 3.2 .5 .6 .3 .4 .4 .3 .4
Black or African American 24.4 46.9 44.5 21.2 4.7 4.0 2.6 2.6 2.7 1.8 1.4
Hispanic white 14.0 37.2 35.2 14.8 3.9 4.6 3.9 4.1 4.5 2.8 2.3
Non-Hispanic white 6.5 13.2 12.0 4.9 1.9 2.6 1.3 1.5 1.2 .8 .7
Other minority2
11.6 27.2 25.0 9.3 2.7 3.7 2.3 2.5 2.6 1.7 1.3
Nonconventional only1
All borrowers .9 .3 .2 .3 .4 .4 .1 .2 .3 .5 .7
Asian 2.2 .3 .1 .2 .2 .2 .1 .2 .2 .3 .4
Black or African American 1.0 .5 .3 .6 .4 .7 .2 .3 .3 .8 1.1
Hispanic white 1.6 .3 .3 .2 .5 .4 .1 .3 .3 .8 1.1
Non-Hispanic white .8 .2 .2 .2 .3 .3 .1 .2 .3 .5 .7
Other minority2
3.9 .3 .2 .2 .3 .3 .1 .1 .2 .3 .6
Refinance
Conventional and nonconventional1
All borrowers 11.3 20.1 21.3 12.7 4.3 1.4 .6 .8 .7 .7 1.0
Asian 4.1 12.2 12.1 5.4 .8 .2 .1 .2 .1 .1 .2
Black or African American 24.3 38.5 39.0 26.4 10.6 3.5 2.6 3.3 2.5 1.6 2.0
Hispanic white 13.4 27.0 25.8 14.8 5.6 2.5 1.8 1.8 1.1 .9 1.0
Non-Hispanic white 9.5 15.9 16.9 10.3 4.1 1.4 .6 .8 .7 .7 1.1
Other minority2
13.2 22.0 22.3 14.5 7.1 2.1 .9 1.1 1.1 .8 .9
Conventional only
All borrowers 11.8 20.7 21.9 13.3 5.1 1.5 .5 .6 .4 .4 .7
Asian 4.1 12.3 12.1 5.4 .9 .2 .1 .1 0 0 .1
Black or African American 27.3 40.8 40.7 29.4 17.1 6.3 2.0 1.8 1.0 1.0 1.4
Hispanic white 14.1 27.7 26.2 15.4 6.9 3.5 1.4 1.3 .8 .7 .8
Non-Hispanic white 9.9 16.3 17.3 10.9 4.8 1.6 .5 .6 .4 .5 .8
Other minority2
13.6 22.6 22.7 14.9 8.3 2.8 .9 .9 .7 .7 .7
Nonconventional only1
All borrowers 1.0 .6 .7 .5 .4 .5 1.2 2.5 2.4 1.8 2.1
Asian 2.9 1.8 1.3 1.4 .5 .3 .5 1.5 1.4 1.1 1.6
Black or African American .6 .8 1.2 .6 .5 1.1 3.5 5.9 4.9 2.6 2.8
Hispanic white 1.4 .4 .3 .6 .7 .8 2.8 3.5 1.9 1.3 1.7
Non-Hispanic white .8 .4 .4 .3 .4 .5 1.0 2.4 2.5 2.1 2.5
Other minority2
6.3 3.4 7.8 6.3 1.9 .4 1.1 2.0 2.2 1.3 1.5
Note: First-lien mortgages for one- to four-family, owner-occupied, site-built homes. For a description of how borrowers are categorized by race
and ethnicity, see table 2, note 1. See text for details on how adjusted incidences of higher-priced lending are calculated.
1
See table 5, note 1.
2
See table 2, note 2.
The 2014 Home Mortgage Disclosure Act Data 19
time (which is why the reporting rule was changed), so data from years prior to 2009 are
not even directly comparable from year to year.32
Table 7.B provides adjusted rates of higher-priced lending that are intended to be more
comparable over time. Using the dates of application and origination (which are not
released in the public HMDA data files) and assuming all loans are 30-year fixed-rate
mortgages, we can estimate the APR of loans that were originated under the old pricing
rule.33
This estimated APR can then be compared with the APOR, as is done under the
new price-reporting rule. Finally, because the implied threshold spread over the APOR dur-
ing the previous reporting regime got to as high as about 2.5 percentage points, table 7.B
reports the fraction of loans with an estimated APR spread over the APOR (or the actual
reported spread for loans made under the new rules) of at least 2.5 percentage points—
32
These distortions are related to the fact that changes in long-term Treasury rates do not always lead to parallel
changes in mortgage rates. For a discussion of how the old rule could produce misleading data about trends in
higher-priced lending, see Neil Bhutta and Daniel R. Ringo (2014), “The 2013 Home Mortgage Disclosure Act
Data,” Federal Reserve Bulletin, vol. 100 (November), pp. 1–32, www.federalreserve.gov/pubs/bulletin/2014/
default.htm.
33
The assumption that all mortgages were fixed rate likely understates the extent of higher-priced lending during
the early years of the housing boom. During this period, adjustable-rate mortgages were quite prevalent, and
the APRs on such loans are tied to even shorter-term Treasury rates than fixed-rate mortgages. Thus, when the
yield curve is relatively steep, as it was in 2004, the bar for adjustable-rate mortgages to be reported as higher
priced would have been even higher than for fixed-rate mortgages.
Table 8. Distribution of price spread, 2014
Percent except as noted
Purpose and type of loan Total number
Loans with APOR spread above 1.5 percentage points1
Number Percent
Distribution, by percentage points of APOR spread
1.5–1.99 2–2.49 2.5–2.99 3–3.99 4–4.99 5 or more
Site-built homes
Home purchase
Conventional 1,735,766 53,654 3.1 56.3 18.5 10.8 8.6 3.1 2.6
FHA2
583,539 258,647 44.3 76.2 21.0 2.1 .6 .03 .05
VA/RHS/FSA3
417,201 1,538 .4 79.5 12.9 1.4 .9 3.1 2.3
Refinance
Conventional 1,561,325 34,546 2.2 48.1 19.8 11.3 11.8 5.0 4.1
FHA2
170,306 26,675 15.7 58.0 13.8 6.0 19.6 1.5 1.1
VA/RHS/FSA3
189,626 1,745 .9 88.6 1.0 2.0 1.2 6.2 1.1
Manufactured homes
Home purchase
Conventional 50,957 39,193 76.9 6.1 4.7 6.8 13.7 12.9 55.8
FHA2
12,231 8,163 66.7 53.4 31.3 7.0 4.0 4.3 .01
VA/RHS/FSA3
4,012 46 1.2 87.0 10.9 0 2 0 .01
Refinance
Conventional 20,405 6,147 30.1 20.6 14.7 14.0 21.9 12.4 16.4
FHA2
5,009 1,034 20.6 60.1 21.3 6.3 11.5 .7 .2
VA/RHS/FSA3
3,162 25 .8 84.0 12 0 0 4 0
Note: First-lien mortgages for one- to four-family owner-occupied homes.
1
Average prime offer rate (APOR) spread is the difference between the annual percentage rate on the loan and the APOR for loans of a similar
type published weekly by the Federal Financial Institutions Examination Council. The threshold for first-lien loans is a spread of
1.5 percentage points.
2
Loans insured by the Federal Housing Administration.
3
Loans backed by guarantees from the U.S. Department of Veterans Affairs, the Rural Housing Service, or the Farm Service Agency.
20 Federal Reserve Bulletin | November 2015
rather than 1.5 percentage points, as in table 7.A.34
Higher-priced lending by this measure
virtually disappeared by 2008 and has not reemerged, likely reflecting the lack of subprime
mortgage lending.
Regulatory Changes
Several significant changes to the regulation of the mortgage market took place in 2014.
This section briefly discusses the new rules and analyzes some possible effects of these new
rules.
Ability-to-Repay and Qualified Mortgage Rules
On January 10, 2014, the CFPB’s final ATR and QM rules, pursuant to the Dodd-Frank
Wall Street Reform and Consumer Protection Act of 2010, went into effect. To help ensure
that lenders make a reasonable, good faith determination that borrowers will be able to
repay their mortgage loans, the new ATR rules require lenders to meet minimum under-
writing standards, such as considering and verifying a mortgage applicant’s assets or
income, debt load, and credit history for most closed-end residential mortgage loans. Bor-
rowers may allege a violation of the ATR requirement within three years of the date of
violation or use a violation of the ATR requirement as a defense to foreclosure for the life
of the loan. Lenders that are found to violate the ATR rules can be liable for monetary
damages.
Lenders are presumed to comply with the ATR requirement when they make a QM loan,
which must meet further underwriting and pricing standards.35
These requirements gener-
ally include a limit on points and fees to 3 percent of the loan amount and various
restrictions on loan terms and features (for example, no negative amortization or interest-
only payments and a loan term of 30 years or less).36
QM loans also generally require that
the borrower’s total DTI ratio does not exceed 43 percent. However, currently, the 43 per-
cent DTI cap does not apply to FHA, VA, FSA, and RHS loans, loans that are eligible for
purchase by the GSEs, and portfolio loans made by small creditors.
The HMDA data can provide some insight into whether these new rules had an effect on
credit availability, although they are an imperfect resource. For example, if the new rules
discouraged lending to riskier borrowers, they could have led to a significant reduction in
the share of loans to minority and LMI borrowers, who tend to have lower assets and
credit scores and higher DTI ratios.37
However, as discussed earlier, black and Hispanic
34
For a more detailed discussion of this adjustment technique, see Avery and others, “The 2009 HMDA Data,” in
note 11.
35
In fact, there are two levels of legal protection: a “safe harbor” (that is, a conclusive presumption of compli-
ance) for QM loans that are not higher priced (first liens with an APR that is less than 1.5 percentage points
above the APOR or junior liens with an APR that is less than 3.5 percentage points above the APOR) and
a “rebuttable presumption of compliance” for QM loans that are higher priced. For FHA loans, the safe har-
bor is given to loans with APRs that are equal to or less than 1.15 percentage points plus the ongoing MIP over
the APOR. Most VA loans have safe-harbor status regardless of the APR. The safe-harbor price threshold also
differs for small creditors.
36
For information on how the terms “points and fees” and “loan amount” are defined for the purposes of QMs
and other guidance on the rules, see Consumer Financial Protection Bureau (2014), Ability-to-Repay and Quali-
fied Mortgage Rule: Small Entity Compliance Guide (Washington: CFPB, November 3), http://files
.consumerfinance.gov/f/201411_cfpb_atr-qm_small-entity-compliance-guide.pdf.
37
For data on credit scores and DTI ratios by borrower race and income, see Neil Bhutta and Glenn B. Canner
(2013), “Mortgage Market Conditions and Borrower Outcomes: Evidence from the 2012 HMDA Data and
Matched HMDA–Credit Record Data,” Federal Reserve Bulletin, vol. 99 (November), pp. 1–58,
www.federalreserve.gov/pubs/bulletin/2013/default.htm.
The 2014 Home Mortgage Disclosure Act Data 21
white borrowers’ share of home-purchase loans increased in 2014 after having declined for
several years. In addition, if the QM cap on the DTI ratio for conventional non-GSE loans
was binding, there could have been a significant increase in the frequency at which lenders
cited the DTI ratio as a reason for denial. However, there was little change in this fre-
quency.38
Also, as will be discussed later, jumbo home-purchase loans, which are not eli-
gible for GSE purchase and would be subject to the DTI cap to qualify as QMs, grew much
more rapidly than other home-purchase loans.
To explore further, this section examines whether the rules may have curbed high-DTI
loans. The HMDA data do not provide all of the information necessary to calculate DTI
ratios, so we cannot directly measure how the frequency of loans with DTI ratios in excess
of 43 percent has changed with the introduction of the ATR and QM rules. Other debts,
such as auto loans and student loans, are added to monthly mortgage obligations in the
numerator of the DTI calculation. The term of the loan, which is not reported under
HMDA, can also affect the DTI ratio, as a shorter term increases monthly mortgage pay-
ments, holding all else equal.
With these caveats in mind, we may still be able to glean some useful information on the
extent of high-DTI lending. For each HMDA loan with a reported income, we estimate a
“front end” DTI ratio based on the loan amount, income, origination date, and reported
spread over the APOR. This approximate DTI ratio is the ratio of monthly mortgage pay-
ment (principal and interest only) to income, assuming that the loan follows a 30-year
fixed-rate structure, with all points and fees financed over the life of the loan. The interest
rate is assumed to be the reported spread over the APOR plus the APOR taken from two
weeks before the loan was originated. If the spread was below the reportable threshold, the
interest rate is assumed to be the APOR plus 0.25 percentage point for conventional
loans.39
For example, for a loan of $100,000 to a borrower with annual income of $50,000,
an unreported spread, and the relevant APOR equal to 4 percent, the approximate DTI
ratio would be 11.8 percent.
Figure 6 displays the distributions of these approximate DTI ratios by demographic group
in 2013 and 2014 (additional data are reported in table 9). The 2014 data are restricted to
loans with an application date on or after January 10, 2014, the date when the ATR rules
were implemented. Again, the estimated front-end DTI ratios are lower than the “back
end” DTI ratios lenders actually use to assess the ATR and QM eligibility, which include
other housing-related obligations, such as taxes and insurance, as well as nonmortgage debt
payments. That said, if the ATR and QM rules were a significant deterrent to loans with a
back-end DTI ratio above 43 percent, we might expect to see the upper percentiles of the
estimated front-end DTI ratio decrease noticeably between 2013 and 2014. In fact, the dis-
tributions look quite similar across the two years.40
Even for conventional jumbo loans,
which are not eligible for purchase by the GSEs and therefore must have a DTI below
38
The frequency with which the DTI ratio was cited as a denial reason edged up to 23.1 percent from 22.1 percent
in 2013 for denied home-purchase applications and dropped slightly to 15.8 percent from 16.6 percent for refi-
nance denials.
39
The lack of data on spreads below the reporting threshold could mask some small changes in the distribution
of DTI ratios between 2013 and 2014. In the absence of data on the true APRs, we assume a spread of
0.25 percentage point on conventional and VA loans to reflect the fact that interest rates near the prevailing
prime rate are more common than those far from it. For FHA loans without a reported spread, we assume a
spread of 1.35 percentage points for loans with an application date on or after April 1, 2013. For loans with an
application date before April 1, 2013, we assume a spread of 1.25 percentage points for FHA home-purchase
loans and a spread of 0.75 percentage point for FHA refinancings. These spreads reflect the typical MIP rates.
FSA and RHS loans are assumed to have a spread of 0.5 percentage point if no spread is reported to match the
guarantee fees. The approximate DTI ratios are capped at 51 percent, as extremely high values likely reflect
misreported data.
40
As seen in table 9, the 90th and 95th percentiles of the approximate DTI ratio for refinance loans to LMI bor-
22 Federal Reserve Bulletin | November 2015
43 percent in order to be a QM, the estimated DTI ratios largely held steady between 2013
and 2014.
A number of factors may help explain why the ATR and QM rules appear to have had little
bite in 2014 relative to 2013. Since the financial crisis and through 2013, lenders have tight-
ened standards, and most loans have been either GSE eligible or nonconventional; thus,
most lending in 2013 may have already met the new ATR, if not QM, standards. Moreover,
lenders may have adjusted to the new rules prior to the actual implementation date in 2014,
reducing the differences between 2013 and 2014. At the same time, lenders making loans in
2013 that would not have been QM loans under the new rules may have been willing to
continue doing so in 2014 despite some added legal risk.
Still, it is important to recognize that we do not know how the market would have evolved
in 2014 in the absence of the new rules. Perhaps in their absence, DTI ratios would have
risen significantly. In addition, borrowers may have reduced nonmortgage debt, which we
do not observe in the HMDA data, in response to the new rules. Thus, we cannot rule out
that there was an effect on DTI ratios in 2014 relative to 2013. Furthermore, the ATR and
QM rules could have affected other dimensions of the mortgage market that are not
observed in the HMDA data, such as the use of low-documentation and interest-only
loans. Finally, even if the rules had little effect in 2014, they may become more binding in
the future if mortgage lenders and investors regain their appetite for risk.
rowers did come down a little, but, for all home-purchase loans and most other groups in the refinance market,
the upper percentiles either stayed the same or increased.
Figure 6. Percentiles of approximate debt-to-income ratios for home-purchase mortgages, by borrower
race, ethnicity, and income, 2013 and 2014
0
10
20
30
Percent 90th percentile
0
10
20
30
Percent 90th percentile
0
10
20
30
40
Percent
2013 20142013 2014
2013 2014
0
10
20
30
40
Asian
Percent 99th percentile
2013 2014
99th percentile
A. Race and ethnicity
B. Income
Non-Hispanic
white
Hispanic
white
Asian Non-Hispanic
white
Hispanic
white
Black or
African
American
Black or
African
American
HigherMiddleLow or moderate HigherMiddleLow or moderate
40
40
Note: The data are annual. First-lien home-purchase mortgages for one- to four-family, owner-occupied, site-built homes. The data for 2014 are
restricted to loans with an application date on or after January 10, 2014. For definition of borrower race and ethnicity, see table 2, note 1. For
explanation of borrower income, see table 2, note 3.
The 2014 Home Mortgage Disclosure Act Data 23
Table 9. Percentiles of estimated front-end debt-to-income ratios, by purpose of loan, 2013–14
Percent
Characteristic of borrower and
of neighborhood
Percentile
2013 2014
50 75 90 95 99 50 75 90 95 99
A. Home purchase
Borrower race and ethnicity1
Asian 19 24 30 33 38 19 25 30 33 38
Black or African American 18 23 27 30 35 18 23 28 31 36
Hispanic white 19 25 30 32 37 20 26 31 33 38
Non-Hispanic white 16 20 25 28 34 16 21 26 29 34
Other minority2
18 24 29 32 37 19 24 29 32 38
Joint 15 20 25 28 34 16 20 25 28 34
Missing 16 21 27 30 35 17 22 27 30 35
Borrower income3
Low or moderate 20 25 29 32 38 20 25 30 33 38
Middle 17 22 27 30 35 18 22 27 30 35
High 14 18 22 25 31 14 18 23 26 32
Neighborhood income4
Low or moderate 17 22 28 31 36 18 23 29 32 37
Middle 16 21 26 29 35 17 22 27 30 35
High 16 21 26 29 35 16 21 26 29 35
Income not used or not applicable 15 20 25 28 35 14 19 24 27 35
Memo
Conventional jumbo loans5
17 23 28 31 38 18 23 28 31 37
All home-purchase loans 16 21 26 29 35 17 22 27 30 35
B. Refinance
Borrower race and ethnicity1
Asian 16 21 28 32 51 18 24 29 33 45
Black or African American 13 19 26 32 51 14 20 26 32 51
Hispanic white 15 22 29 35 51 17 23 30 34 51
Non-Hispanic white 12 17 23 28 42 13 19 25 29 42
Other minority2
15 21 29 36 51 16 23 30 34 51
Joint 12 17 23 27 39 14 19 25 29 39
Missing 13 18 25 30 48 14 20 26 30 43
Borrower income3
Low or moderate 18 25 33 42 51 18 25 32 39 51
Middle 14 19 24 27 34 15 20 26 29 36
High 10 14 19 22 29 12 17 22 25 31
Neighborhood income4
Low or moderate 13 19 26 32 51 14 20 27 32 51
Middle 12 18 24 29 46 14 19 26 30 44
High 13 18 24 28 42 14 20 26 30 41
Income not used or not applicable 11 16 22 26 35 12 17 23 27 36
Memo
Conventional jumbo loans5
17 23 29 33 43 18 24 29 33 41
All refinance loans 13 18 24 29 46 14 20 26 30 43
Note: First-lien mortgages for one- to four-family, owner-occupied, site-built homes. The data for 2014 are restricted to loans with an
application date on or after January 10, 2014. See text for details on how the front-end debt-to-income ratio is estimated.
1
See table 2, note 1.
2
See table 2, note 2.
3
See table 2, note 3.
4
See table 2, note 4.
5
Jumbo loans are loans with amounts in excess of the single-family conforming loan-size limits for eligibility for purchase by the
government-sponsored enterprises.
24 Federal Reserve Bulletin | November 2015
HOEPA Loans
Under HOEPA, certain types of mortgage loans that have interest rates or fees above speci-
fied levels are subject to additional consumer protections, such as special disclosures and
restrictions on loan features. New rules extending HOEPA’s protections from refinance and
home equity loans to also include home-purchase loans and home equity lines of credit
became effective on January 10, 2014. These rules also added new protections for high-cost
mortgages, such as a pre-loan counseling requirement for borrowers.
The new rules also changed the benchmark used to identify high-cost loans that are cov-
ered by HOEPA’s protections. Instead of using the yield on Treasury securities, high-cost
loans are identified by comparing a loan’s APR with the APOR. HOEPA coverage now
applies to first liens with an APR more than 6.5 percentage points above the APOR. If the
loan is a junior lien or the loan amount is less than $50,000 and is secured by personal
property (such as a manufactured home), then the high-cost threshold is 8.5 percentage
points above the APOR. Prior to 2014, HOEPA’s protections were triggered if the loan’s
APR exceeded 8 percentage points above the rate on a Treasury security of similar term for
first liens, and 10 percentage points for junior liens. Finally, under the new rules, HOEPA
coverage is also triggered if the points and fees exceed certain thresholds.41
While HOEPA loans were never a large fraction of the mortgage market, they have become
even rarer since the housing boom. In 2005, lenders reported nearly 36,000 HOEPA loans
(table 10). In 2014, the total was 1,262 loans, down from 1,873 in 2013 despite the addi-
tional coverage of home-purchase loans.
While HOEPA loans were quite rare in 2014, mortgages with an APR near to, but below,
the triggering threshold were somewhat more common. Figure 7 plots the frequency of
first-lien mortgages for owner-occupied properties against the spread over the APOR in a
41
Under the new rules, a loan is also considered high cost if the points and fees exceed 5 percent of the total loan
amount for a loan equal to or more than $20,000 and 8 percent of the total loan amount or $1,000 for a loan
less than $20,000, with the loan amounts adjusted annually for inflation.
Table 10. Distribution of HOEPA loans, by characteristic of loan, 2004–14
Percent except as noted
Loans by purpose,
lien status, property
type, and amount
2004 2005 2006 2007 2008 2009 2010 2011 2012 2013 2014
HOEPA loans
(total) 24,437 35,985 15,195 10,780 8,577 6,446 3,407 2,373 2,193 1,873 1,262
Loan purpose
Home purchase 0 0 0 0 0 0 0 0 0 0 31.8
Home improvement 37.7 26.1 42.4 45.4 30.5 31.1 32.6 32.3 31.5 30.1 18.0
Refinance 62.3 73.9 57.6 54.6 69.5 68.9 67.4 67.7 68.5 69.9 50.2
Lien status
First 55.5 60.5 53.6 52.8 78.5 84.1 83.9 82.8 84.6 84.0 91.6
Junior 44.5 39.5 46.4 47.2 21.5 15.9 16.1 17.2 15.4 16.0 8.4
Property type
Site built 88.0 91.8 83.7 81.0 72.7 67.8 68.3 65.7 65.7 69.1 75.2
Manufactured home 12.0 8.2 16.3 19.0 27.3 32.2 31.7 34.3 34.3 30.9 24.8
Loan amount
Less than $50,000 72.4 48.4 72.1 74.3 66.7 72.5 76.5 77.8 75.6 71.0 53.2
Greater than
$50,000 27.6 51.6 27.9 25.7 33.3 27.5 23.5 22.2 24.4 29.0 46.8
Note: Mortgages for one- to four-family owner-occupied homes. HOEPA loans are mortgages with terms that triggered the additional protections
provided by the Home Ownership and Equity Protection Act.
The 2014 Home Mortgage Disclosure Act Data 25
1 percentage point range around
the HOEPA triggering threshold.
The top panel combines loans of
$50,000 or more for manufactured
homes with all loans for site-built
homes, as these loans all have a
HOEPA threshold of 6.5 percent-
age points. The bottom panel pres-
ents the frequency of loans less
than $50,000 for manufactured
homes, which trigger HOEPA pro-
tections if the APR is more than
8.5 percentage points above the
APOR. In both panels, the values
from 2013 are plotted for compari-
son, as the APOR-based definition
of high-cost mortgages was not in
use then. In both panels, the 2014
plots are restricted to loans with an
application date on or after Janu-
ary 10, 2014, when the new rule
went into effect.
Both panels show a precipitous
drop in the number of loans
originated in 2014 at the HOEPA
price threshold, whereas for
2013—before the new threshold
rules took effect—no such disconti-
nuity was evident. This pattern
suggests that HOEPA discouraged
lending above the price thresholds,
but the mechanism by which the
market responds to HOEPA is unclear. One possibility is that lenders reduce the APR on
their offers to push the loan under the threshold, which would imply a benefit to consum-
ers in the form of a lower price. Another possibility is that, rather than adjusting prices,
lenders denied applications they would have accepted in the absence of HOEPA. In
this case, consumers may or may not benefit from the law. Finally, prospective borrowers
may have chosen to reject high-cost offers when presented with the additional HOEPA dis-
closures. Further research is needed to understand the relative importance of each of these
mechanisms.
Lending Institutions
In 2014, there were 7,062 reporting institutions (table 11). The total consisted of 4,118
banks and thrifts (hereafter, banks), of which 3,367 were small, defined as having assets of
less than $1 billion; 1,984 credit unions; 139 mortgage companies affiliated with deposito-
ries (banks and credit unions); and 821 independent mortgage companies.42
Banks collec-
42
Data on bank assets were drawn from the Federal Deposit Insurance Corporation Reports of Condition and
Income. The $1 billion threshold is based on the combined assets of all banks within a given banking organiza-
tion. Data available in the HMDA Reporter Panel can be used to help identify the various types of institutions.
Affiliate institutions include all mortgage companies known to be wholly or partially owned by a depository—
Figure 7. Number of originations near HOEPA spread
thresholds, 2013 and 2014
0
200
400
600
800
1,000
1,200
Number of loans
A. Manufactured and loan amount ≥ $50,000 or site built
0
100
200
300
400
500
600
700
Number of loans
Spread over the APOR (percentage points)
B. Manufactured and loan amount < $50,000
2013 2014
2013 2014
8.05 8.15 8.25 8.35 8.45 8.55 8.65 8.75 8.85 8.95
6.05 6.15 6.25 6.35 6.45 6.55 6.65 6.75 6.85 6.95
Note: The data are annual. First-lien mortgage originations for owner-occupied
properties clustered into bins of 0.05 percentage point. The data for 2014 are
restricted to loans with an application date on or after January 10, 2014. HOEPA
is Home Ownership and Equity Protection Act; APOR is average prime offer rate.
26 Federal Reserve Bulletin | November 2015
tively accounted for about 45 percent of all reported mortgage originations; independent
mortgage companies, about 40 percent; credit unions, over 9 percent; and affiliates, the
remainder.
Many institutions report little activity. About 48 percent of institutions (3,360 out of 7,062)
reported fewer than 100 mortgage originations in 2014, accounting for about 136,000 origi-
nations, or 2 percent of all originations. About 17 percent of institutions originated fewer
than 25 loans, in total accounting for about one-fourth of 1 percent of all originations.
that is, institutions for which the “other lender code” in the Reporter Panel equals 1, 2, or 5. All credit unions
report to the National Credit Union Administration except four large credit unions (Boeing Employees Credit
Union, Navy Federal Credit Union, Pentagon Federal Credit Union, and State Employees Credit Union),
which report to the CFPB.
Table 11. Lending activity, by type of institution, 2014
Percent except as noted
Institutions and type of activity
Type of institution1
Small bank Large bank Credit union
Affiliated
mortgage
company
Independent
mortgage
company
All
Number of institutions 3,367 751 1,984 139 821 7,062
Applications (thousands) 787 3,616 909 501 4,119 9,933
Originations (thousands) 558 2,161 545 313 2,403 5,980
Purchases (thousands) 26 1,061 12 172 481 1,752
Number of institutions with fewer than 100 loans 1,935 149 1,150 38 88 3,360
Originations (thousands) 79.3 6.7 44.5 1.6 3.4 135.5
Number of institutions with fewer than 25 loans 667 45 443 16 41 1,212
Originations (thousands) 8.2 .6 5.2 .2 .5 14.7
Home-purchase loans (thousands)2
220 869 172 189 1,288 2,737
Conventional 73.8 74.3 86.8 58.9 51.9 63.4
Higher-priced share of conventional loans 11.3 1.7 8.9 1.0 1.5 3.1
LMI borrower3
28.9 23.5 26.1 30.1 28.8 27.0
LMI neighborhood4
11.9 11.8 12.7 12.6 14.7 13.3
Non-Hispanic white5
81.3 69.9 70.7 71.0 65.9 69.1
Minority borrower5
11.8 17.8 14.4 16.8 22.6 19.3
Sold6
70.6 72.7 43.7 97.3 97.6 84.1
Refinance loans (thousands)2
119 723 177 86 816 1,921
Conventional 85.7 90.6 96.4 80.2 69.2 81.3
Higher-priced share of conventional loans 11.3 1.5 3.5 .8 1.2 2.2
LMI borrower3
22.5 23.5 24.6 21.1 20.6 22.2
LMI neighborhood4
11.3 12.8 13.9 12.0 13.6 13.1
Non-Hispanic white5
84.2 68.8 71.2 68.3 63.7 67.8
Minority borrower5
8.2 17.1 14.6 17.1 18.2 16.8
Sold6
58.0 72.6 29.8 96.4 98.4 79.4
1
Small banks consist of those banks with assets (including the assets of all other banks in the same banking organization) of less than
$1 billion at the end of 2013. Large banks are all other banks. Affiliated mortgage companies are nondepository mortgage companies owned
by or affiliated with a banking organization or credit union.
2
First-lien mortgages for one-to-four family, owner-occupied, site-built homes.
3
See table 2, note 3.
4
See table 2, note 4.
5
See table 2, note 1. “Minority borrower” refers to nonwhite (excluding joint or missing) or Hispanic white applicants.
6
Excludes originations made in the last quarter of the year because the incidence of loan sales tends to decline for loans originated toward the
end of the year, as lenders report a loan as sold only if the sale occurs within the same year as origination.
Source: FFIEC HMDA data; bank asset data drawn from Federal Deposit Insurance Corporation Reports of Condition and Income.
The 2014 Home Mortgage Disclosure Act Data 27
Table 11 provides several other statistics to help compare the lending patterns of different
types of institutions in 2014, and we discuss some highlights here. First, depositories tend
to originate a significantly higher fraction of conventional loans than nondepositories. As
will be seen in the next section, this difference holds historically as well.
Second, in 2014, small banks and credit unions accounted for a highly disproportionate
share of conventional higher-priced loans. Over 11 percent of conventional home-purchase
loans for one- to four-family, owner-occupied, site-built properties originated by small
banks were higher priced, as were nearly 9 percent of such loans originated by credit
unions. In contrast, less than 2 percent of such loans originated by other types of institu-
tions were higher priced. The numbers for both home-purchase and refinance lending
imply that, even though small banks and credit unions accounted for less than 18 percent
of conventional home-purchase and refinance loans, they originated over 55 percent of
conventional higher-priced loans. Interestingly, further analysis indicates that these differ-
ences in higher-priced lending hold, on average, even when comparing small banks and
credit unions to other lenders operating in the same county.
Notably, under the new QM rules, higher-priced conventional QM loans will have a rebut-
table presumption of compliance with the ATR rules, as opposed to a conclusive presump-
tion of compliance (that is, a safe harbor), unless the loan is originated by a small creditor,
in which case the safe-harbor APR threshold is 3.5 percentage points over the APOR
rather than 1.5 percentage points.43
Many small banks and credit unions may fit the small
creditor definition, and over 85 percent of the higher-priced loans originated by these insti-
tutions had APOR spreads of less than 3.5 percentage points. Thus, many of these higher-
priced loans may have safe-harbor status if they satisfy all of the other QM criteria.
Third, small banks and credit unions are significantly less likely to originate mortgages to
minority borrowers, compared with independent mortgage companies, but are more similar
to independent mortgage companies in terms of their share of lending to LMI borrowers
and neighborhoods. Patterns of lending over time by demographic group and lender type
are discussed in detail in a later section.
Fourth, the HMDA data provide information on whether originated loans were sold within
the same calendar year and the type of institution to which they were sold, such as one of
the GSEs or a banking institution (see appendix A for a full list of purchaser types).
Table 11 displays the fraction of loans sold within the calendar year, as opposed to being
held in portfolio.44
Nondepositories sold virtually all of their loans in 2014. In contrast,
credit unions sold less than one-half of the home-purchase loans they originated and less
than one-third of the refinance loans they originated. That said, as discussed later, portfo-
lio lending among depositories has declined significantly over time.
Table 12 lists the top 25 reporting institutions according to their total number of origina-
tions, along with the same set of lending characteristics as those listed in table 11.45
Wells
Fargo reported the most originations, with about 374,000. The next-highest total was for
Quicken Loans, followed by Bank of America and JPMorgan Chase. Overall, the top 25
lenders accounted for about 34 percent of all loan originations in 2014, down from 41 per-
43
Other criteria must also be met to achieve safe-harbor status, such as holding the loan in portfolio for at least
three years.
44
Because loan sales are recorded in the HMDA data only if the loans are originated and sold in the same calen-
dar year, loans originated toward the end of the year are less likely to be reported as sold. For that reason,
statistics on loan sales are computed using only loans originated during the first three quarters of the year.
45
Some institutions may be part of a larger organization; however, the data in table 12 are at the reporter level.
Because affiliate activity has declined markedly since the housing boom, a top 25 list at the organization level is
not likely to be significantly different.
28 Federal Reserve Bulletin | November 2015
2014_HMDA
2014_HMDA
2014_HMDA
2014_HMDA
2014_HMDA
2014_HMDA
2014_HMDA
2014_HMDA
2014_HMDA
2014_HMDA
2014_HMDA
2014_HMDA
2014_HMDA
2014_HMDA
2014_HMDA

Mais conteúdo relacionado

Mais procurados

Consumer Insight - Mortgages in Australia
Consumer Insight - Mortgages in AustraliaConsumer Insight - Mortgages in Australia
Consumer Insight - Mortgages in Australia
ReportLinker.com
 
This Month In Real Estate November 2009 Us
This Month In Real Estate   November  2009 UsThis Month In Real Estate   November  2009 Us
This Month In Real Estate November 2009 Us
Keller Williams Careers
 

Mais procurados (18)

Forecasting peer-to-peer lending risk
Forecasting peer-to-peer lending riskForecasting peer-to-peer lending risk
Forecasting peer-to-peer lending risk
 
Financial Services Enforcement Actions Tracker - Q1 2017
Financial Services Enforcement Actions Tracker - Q1 2017Financial Services Enforcement Actions Tracker - Q1 2017
Financial Services Enforcement Actions Tracker - Q1 2017
 
Is motor finance running out of road?
Is motor finance running out of road?Is motor finance running out of road?
Is motor finance running out of road?
 
Consumer Insight - Mortgages in Australia
Consumer Insight - Mortgages in AustraliaConsumer Insight - Mortgages in Australia
Consumer Insight - Mortgages in Australia
 
BRADENTON REAL ESTATE, REPORTS, STATISTICS
BRADENTON REAL ESTATE, REPORTS, STATISTICSBRADENTON REAL ESTATE, REPORTS, STATISTICS
BRADENTON REAL ESTATE, REPORTS, STATISTICS
 
Single-Family Rentals | Q2 2020 | Arbor Realty Trust, Inc.
Single-Family Rentals | Q2 2020 | Arbor Realty Trust, Inc. Single-Family Rentals | Q2 2020 | Arbor Realty Trust, Inc.
Single-Family Rentals | Q2 2020 | Arbor Realty Trust, Inc.
 
Oklahoma May Legalize Weed in 2022
Oklahoma May Legalize Weed in 2022Oklahoma May Legalize Weed in 2022
Oklahoma May Legalize Weed in 2022
 
This Month in Real Estate July 2010
This Month in Real Estate July 2010This Month in Real Estate July 2010
This Month in Real Estate July 2010
 
Will Cannabis Banking Pass with the Defense Spending Bill?
Will Cannabis Banking Pass with the Defense Spending Bill?Will Cannabis Banking Pass with the Defense Spending Bill?
Will Cannabis Banking Pass with the Defense Spending Bill?
 
This Month In Real Estate November 2009 Us
This Month In Real Estate   November  2009 UsThis Month In Real Estate   November  2009 Us
This Month In Real Estate November 2009 Us
 
This Month In Real Estate November Us
This Month In Real Estate   November   UsThis Month In Real Estate   November   Us
This Month In Real Estate November Us
 
HISIM2—The Health Insurance Simulation Model Used in Preparing CBO’s Spring 2...
HISIM2—The Health Insurance Simulation Model Used in Preparing CBO’s Spring 2...HISIM2—The Health Insurance Simulation Model Used in Preparing CBO’s Spring 2...
HISIM2—The Health Insurance Simulation Model Used in Preparing CBO’s Spring 2...
 
2018 Loan Originator Continuing Education
2018 Loan Originator Continuing Education2018 Loan Originator Continuing Education
2018 Loan Originator Continuing Education
 
Home Price Index - Q2 2015
Home Price Index - Q2 2015Home Price Index - Q2 2015
Home Price Index - Q2 2015
 
The Local Economic Impact of Participating Short-Term Rentals in Chicago
The Local Economic Impact of Participating Short-Term Rentals in ChicagoThe Local Economic Impact of Participating Short-Term Rentals in Chicago
The Local Economic Impact of Participating Short-Term Rentals in Chicago
 
The Local Economic Impact of Short-Term Rentals in the Myrtle Beach Area
The Local Economic Impact of Short-Term Rentals in the Myrtle Beach AreaThe Local Economic Impact of Short-Term Rentals in the Myrtle Beach Area
The Local Economic Impact of Short-Term Rentals in the Myrtle Beach Area
 
August 2010 market update
August 2010 market updateAugust 2010 market update
August 2010 market update
 
SrishtiMAGFall2014
SrishtiMAGFall2014SrishtiMAGFall2014
SrishtiMAGFall2014
 

Destaque

Internship Report
Internship Report Internship Report
Internship Report
Shanto Rahman
 
Business requirements documents
Business requirements documentsBusiness requirements documents
Business requirements documents
hapy
 
Sample Project Requirements Document – Library Blog
Sample Project Requirements Document – Library BlogSample Project Requirements Document – Library Blog
Sample Project Requirements Document – Library Blog
ALATechSource
 
Example requirements specification
Example requirements specificationExample requirements specification
Example requirements specification
indrisrozas
 
Sample Business Requirement Document
Sample Business Requirement DocumentSample Business Requirement Document
Sample Business Requirement Document
Isabel Elaine Leong
 

Destaque (13)

Automation of reporting process
Automation of reporting processAutomation of reporting process
Automation of reporting process
 
Reducing Time Spent On Requirements
Reducing Time Spent On RequirementsReducing Time Spent On Requirements
Reducing Time Spent On Requirements
 
Data analysis on bank data
Data analysis on bank dataData analysis on bank data
Data analysis on bank data
 
Internship Report
Internship Report Internship Report
Internship Report
 
How Eastern Bank Uses Big Data to Better Serve and Protect its Customers
How Eastern Bank Uses Big Data to Better Serve and Protect its CustomersHow Eastern Bank Uses Big Data to Better Serve and Protect its Customers
How Eastern Bank Uses Big Data to Better Serve and Protect its Customers
 
business requirements functional and non functional
business requirements functional and  non functionalbusiness requirements functional and  non functional
business requirements functional and non functional
 
Strategic Business Requirements for Master Data Management Systems
Strategic Business Requirements for Master Data Management SystemsStrategic Business Requirements for Master Data Management Systems
Strategic Business Requirements for Master Data Management Systems
 
Project Business Requirements Document
Project Business Requirements DocumentProject Business Requirements Document
Project Business Requirements Document
 
Business requirements documents
Business requirements documentsBusiness requirements documents
Business requirements documents
 
Sample Project Requirements Document – Library Blog
Sample Project Requirements Document – Library BlogSample Project Requirements Document – Library Blog
Sample Project Requirements Document – Library Blog
 
Example requirements specification
Example requirements specificationExample requirements specification
Example requirements specification
 
Sample Business Requirement Document
Sample Business Requirement DocumentSample Business Requirement Document
Sample Business Requirement Document
 
KPCB Design in Tech Report 2015: Simplified and Redesigned
KPCB Design in Tech Report 2015: Simplified and RedesignedKPCB Design in Tech Report 2015: Simplified and Redesigned
KPCB Design in Tech Report 2015: Simplified and Redesigned
 

Semelhante a 2014_HMDA

TILA-RESPA Short Essay
TILA-RESPA Short EssayTILA-RESPA Short Essay
TILA-RESPA Short Essay
Kristina Kivi
 
Improving Americans' Financial Security: The Importance of a CFPB Director
Improving Americans' Financial Security: The Importance of a CFPB DirectorImproving Americans' Financial Security: The Importance of a CFPB Director
Improving Americans' Financial Security: The Importance of a CFPB Director
Obama White House
 
DISSERTATION ON THE NATURE, CONSTRAINTS AND IMPLICATIONS OF MORTGAGE REPAYMEN...
DISSERTATION ON THE NATURE, CONSTRAINTS AND IMPLICATIONS OF MORTGAGE REPAYMEN...DISSERTATION ON THE NATURE, CONSTRAINTS AND IMPLICATIONS OF MORTGAGE REPAYMEN...
DISSERTATION ON THE NATURE, CONSTRAINTS AND IMPLICATIONS OF MORTGAGE REPAYMEN...
AMPOFO AGYEI JUSTICE
 
2015 V43 4 pp. 993–1034DOI 10.11111540-6229.12105RE.docx
2015 V43 4 pp. 993–1034DOI 10.11111540-6229.12105RE.docx2015 V43 4 pp. 993–1034DOI 10.11111540-6229.12105RE.docx
2015 V43 4 pp. 993–1034DOI 10.11111540-6229.12105RE.docx
jesusamckone
 
2015 V43 4 pp. 993–1034DOI 10.11111540-6229.12105RE.docx
2015 V43 4 pp. 993–1034DOI 10.11111540-6229.12105RE.docx2015 V43 4 pp. 993–1034DOI 10.11111540-6229.12105RE.docx
2015 V43 4 pp. 993–1034DOI 10.11111540-6229.12105RE.docx
lorainedeserre
 
CDFA Annual VC Report for 2014 20150821
CDFA Annual VC Report for 2014 20150821CDFA Annual VC Report for 2014 20150821
CDFA Annual VC Report for 2014 20150821
Pete Mathews
 
Whitepaper_E_Customer centricity the survival strategy for Japanese lenders
Whitepaper_E_Customer centricity the survival strategy for Japanese lendersWhitepaper_E_Customer centricity the survival strategy for Japanese lenders
Whitepaper_E_Customer centricity the survival strategy for Japanese lenders
Arup Das
 
Graebel_ReloTRENDS_ClosingCosts
Graebel_ReloTRENDS_ClosingCostsGraebel_ReloTRENDS_ClosingCosts
Graebel_ReloTRENDS_ClosingCosts
Pat Liberati
 
Ginnie Mae's Housing Finance Reform Overview
Ginnie Mae's Housing Finance Reform Overview Ginnie Mae's Housing Finance Reform Overview
Ginnie Mae's Housing Finance Reform Overview
Five Star Institute
 
CDFA Annual VC Report for 2013
CDFA Annual VC Report for 2013CDFA Annual VC Report for 2013
CDFA Annual VC Report for 2013
Logan Dawson
 
WFC Applied Equity Valuation Report
WFC Applied Equity Valuation ReportWFC Applied Equity Valuation Report
WFC Applied Equity Valuation Report
Qiaochu Geng
 

Semelhante a 2014_HMDA (20)

TILA-RESPA Short Essay
TILA-RESPA Short EssayTILA-RESPA Short Essay
TILA-RESPA Short Essay
 
Improving Americans' Financial Security: The Importance of a CFPB Director
Improving Americans' Financial Security: The Importance of a CFPB DirectorImproving Americans' Financial Security: The Importance of a CFPB Director
Improving Americans' Financial Security: The Importance of a CFPB Director
 
DISSERTATION ON THE NATURE, CONSTRAINTS AND IMPLICATIONS OF MORTGAGE REPAYMEN...
DISSERTATION ON THE NATURE, CONSTRAINTS AND IMPLICATIONS OF MORTGAGE REPAYMEN...DISSERTATION ON THE NATURE, CONSTRAINTS AND IMPLICATIONS OF MORTGAGE REPAYMEN...
DISSERTATION ON THE NATURE, CONSTRAINTS AND IMPLICATIONS OF MORTGAGE REPAYMEN...
 
Does less regulation equal more loan defaults
Does less regulation equal more loan defaultsDoes less regulation equal more loan defaults
Does less regulation equal more loan defaults
 
2015 V43 4 pp. 993–1034DOI 10.11111540-6229.12105RE.docx
2015 V43 4 pp. 993–1034DOI 10.11111540-6229.12105RE.docx2015 V43 4 pp. 993–1034DOI 10.11111540-6229.12105RE.docx
2015 V43 4 pp. 993–1034DOI 10.11111540-6229.12105RE.docx
 
2015 V43 4 pp. 993–1034DOI 10.11111540-6229.12105RE.docx
2015 V43 4 pp. 993–1034DOI 10.11111540-6229.12105RE.docx2015 V43 4 pp. 993–1034DOI 10.11111540-6229.12105RE.docx
2015 V43 4 pp. 993–1034DOI 10.11111540-6229.12105RE.docx
 
CDFA Annual VC Report for 2014 20150821
CDFA Annual VC Report for 2014 20150821CDFA Annual VC Report for 2014 20150821
CDFA Annual VC Report for 2014 20150821
 
Remaking IT for New U.S. Mortgage Rule Compliance
Remaking IT for New U.S. Mortgage Rule ComplianceRemaking IT for New U.S. Mortgage Rule Compliance
Remaking IT for New U.S. Mortgage Rule Compliance
 
Borrowing
BorrowingBorrowing
Borrowing
 
Ra law group
Ra law groupRa law group
Ra law group
 
Whitepaper_E_Customer centricity the survival strategy for Japanese lenders
Whitepaper_E_Customer centricity the survival strategy for Japanese lendersWhitepaper_E_Customer centricity the survival strategy for Japanese lenders
Whitepaper_E_Customer centricity the survival strategy for Japanese lenders
 
Graebel_ReloTRENDS_ClosingCosts
Graebel_ReloTRENDS_ClosingCostsGraebel_ReloTRENDS_ClosingCosts
Graebel_ReloTRENDS_ClosingCosts
 
Report Big Data
Report Big DataReport Big Data
Report Big Data
 
Ginnie Mae's Housing Finance Reform Overview
Ginnie Mae's Housing Finance Reform Overview Ginnie Mae's Housing Finance Reform Overview
Ginnie Mae's Housing Finance Reform Overview
 
Home Equity Lending - 2H 2014 Outlook
Home Equity Lending - 2H 2014 OutlookHome Equity Lending - 2H 2014 Outlook
Home Equity Lending - 2H 2014 Outlook
 
Module 2
Module 2Module 2
Module 2
 
Managing the Impact of CFPB Regulations
Managing the Impact of CFPB RegulationsManaging the Impact of CFPB Regulations
Managing the Impact of CFPB Regulations
 
CDFA Annual VC Report for 2013
CDFA Annual VC Report for 2013CDFA Annual VC Report for 2013
CDFA Annual VC Report for 2013
 
WFC Applied Equity Valuation Report
WFC Applied Equity Valuation ReportWFC Applied Equity Valuation Report
WFC Applied Equity Valuation Report
 
U.S. Lending Industry Meets Mortgage Process as a Service
U.S. Lending Industry Meets Mortgage Process as a ServiceU.S. Lending Industry Meets Mortgage Process as a Service
U.S. Lending Industry Meets Mortgage Process as a Service
 

2014_HMDA

  • 1. November 2015 Vol. 101, No. 4 The 2014 Home Mortgage Disclosure Act Data Neil Bhutta, Jack Popper, and Daniel R. Ringo, of the Division of Research and Statistics, prepared this article. Jimmy Kelliher provided research assistance. This article provides an overview of residential mortgage lending in 2014 and discusses a number of changes in mortgage market activity over time based on data reported under the Home Mortgage Disclosure Act of 1975 (HMDA). HMDA requires most mortgage lend- ing institutions with offices in metropolitan areas to disclose to the public detailed informa- tion about their home-lending activity each year. The HMDA data include the disposition of each application for mortgage credit; the type, purpose, and characteristics of each home mortgage that lenders originate or purchase during the calendar year; the census- tract designations of the properties related to those loans; loan pricing information; per- sonal demographic and other information about loan applicants, including their race or ethnicity and income; and information about loan sales (see appendix A for a full list of items reported under HMDA).1 HMDA was enacted to help members of the public determine whether financial institu- tions are serving the housing needs of their local communities and treating borrowers and loan applicants fairly, provide information that could facilitate the efforts of public entities to distribute funds to local communities for the purpose of attracting private investment, and help households decide where they may want to deposit their savings.2 The data have proven to be valuable for research and are often used in public policy deliberations related to the mortgage market.3 Mortgage debt is by far the largest component of household debt in the United States, and mortgage transactions can have important implications for households’ financial well- being. The HMDA data are the most comprehensive source of publicly available informa- tion on the U.S. mortgage market, providing unique details on how much mortgage credit gets extended each year, who obtains such credit, and which institutions provide such credit. 1 The 2014 HMDA data reflect property locations using the census-tract geographic boundaries created for the 2010 decennial census as well as recent updates to the list of metropolitan statistical areas (MSAs) published by the Office of Management and Budget. The first year for which the HMDA data use this most recent list of MSAs is 2014. For further information, see Federal Financial Institutions Examination Council (2013), “OMB Announcement—Revised Delineations of MSAs,” press release, February 28, www.ffiec.gov/hmda/OMB_MSA .htm. 2 A brief history of HMDA is available at Federal Financial Institutions Examination Council, “History of HMDA,” webpage, www.ffiec.gov/hmda/history2.htm. 3 On July 21, 2011, rulemaking responsibility for HMDA was transferred from the Federal Reserve Board to the newly established Consumer Financial Protection Bureau. The Federal Financial Institutions Examination Coun- cil (FFIEC; www.ffiec.gov/hmda/history2.htm) continues to be responsible for collecting the HMDA data from reporting institutions and facilitating public access to the information. In September of each year, the FFIEC releases to the public summary disclosure tables pertaining to lending activity from the previous calendar year for each reporting lender as well as aggregations of home-lending activity for each metropolitan statistical area and for the nation as a whole. The FFIEC also makes available to the public a data file containing virtually all of the reported information for each lending institution as well as a file that includes key demographic and housing- related data for each census tract drawn from census sources.
  • 2. In 2014, house prices continued their upward trend evident since 2012, and mortgage inter- est rates declined throughout the year, although rates remained slightly higher than the historical lows reached in late 2012 and early 2013. While mortgage credit stayed generally tight, conditions appeared to ease somewhat over the course of the year as the fraction of mortgage lending to lower-credit borrowers increased, and reports from the Senior Loan Officer Opinion Survey on Bank Lending Practices indicate that several large banks relaxed their credit requirements for prime loans. However, growth in new housing construction was slow throughout the year, suggesting some persistent softness in new housing demand.4 Significant regulatory changes occurred in 2014 that may have influenced lending patterns. In January 2014, the new ability-to-repay (ATR) and qualified mortgage (QM) rules, issued by the Consumer Financial Protection Bureau (CFPB), went into effect. As discussed in more detail in a later section, the new rules generally require lenders originating closed-end loans to make a reasonable, good faith determination of whether mortgage borrowers will be able to repay their loans. This ATR determination includes consideration and verifica- tion of mortgage applicants’ incomes, other debts, and credit histories. The rules also define categories of QM loans that are presumed to meet the ATR requirement and receive certain protections from liability. The QM requirements generally include a limit on the borrower’s ratio of total debt service payments to income (DTI), limits on points and fees, and various other restrictions on loan terms and features.5 Also in January 2014, revised rules implementing the Home Ownership and Equity Protec- tion Act (HOEPA), which provides special consumer protections (such as additional disclo- sures) for borrowers considering certain mortgage loans that are priced well above prime rates, went into effect. Most notably, the new rules extend HOEPA coverage from refinance and home equity loans to also include home-purchase loans and home equity lines of credit, as well as adding new borrower protections, including a requirement that consumers receive homeownership counseling before obtaining a high-cost mortgage.6 This article presents findings from the HMDA data describing mortgage market activity and lending patterns over time, including the incidence of higher-priced or nonprime lend- ing and rates of denial on mortgage applications, across different demographic groups and lender types.7 Some of the key findings are as follows: 1. The number of mortgage originations in 2014 declined 31 percent, to 6.0 million from 8.7 million in 2013. This decrease was due to a drop in refinance mortgages for one- to four-family properties, which fell by over 2.8 million, or 55 percent, from 2013, as mortgage interest rates in 2014 remained above the low levels experienced in early 2013. In contrast to refinancing, one- to four-family home-purchase originations increased by 123,000, or 4 percent, from 2013, continuing an upward trend since 2011. 2. The nonconventional share of first-lien home-purchase loans for one- to four-family, owner-occupied, site-built properties (that is, loans with mortgage insurance from the 4 For more information on credit and economic conditions during 2014, see Board of Governors of the Federal Reserve System (2015), Monetary Policy Report (Washington: Board of Governors, February 24), www .federalreserve.gov/monetarypolicy/mpr_default.htm. 5 For more information, see Consumer Financial Protection Bureau, “Ability to Repay and Qualified Mortgage Standards under the Truth in Lending Act (Regulation Z),” webpage, www.consumerfinance.gov/regulations/ ability-to-repay-and-qualified-mortgage-standards-under-the-truth-in-lending-act-regulation-z. 6 For more information, see Consumer Financial Protection Bureau (2014), 2013 Home Ownership and Equity Protection Act (HOEPA) Rule: Small Entity Compliance Guide (Washington: CFPB, January 9), http://files .consumerfinance.gov/f/201401_cfpb_hoepa-compliance-guide.pdf. 7 Some lenders file amended HMDA reports, which are not reflected in the initial public data release. A final HMDA data set reflecting these changes is created two years following the initial data release. The data used to prepare this article are drawn from the initial public release for 2013–14 and from the final HMDA data set for years prior to that. Consequently, numbers in this article for the years 2012 and earlier may differ somewhat from numbers calculated from the initial public release files. 2 Federal Reserve Bulletin | November 2015
  • 3. Federal Housing Administration (FHA) or guarantees from the Department of Veter- ans Affairs (VA), the Farm Service Agency (FSA), or the Rural Housing Service (RHS)) stood at about 36 percent in 2014, down from 38 percent in 2013 and from a peak of 54 percent in 2009. The decline since 2009 reflects a decrease in the FHA share of loans, possibly due to a series of increases, starting in 2010, in the mortgage insur- ance premium (MIP) that the FHA charges borrowers. 3. Black and Hispanic white borrowers increased their share of home-purchase loans for one- to four-family, owner-occupied, site-built properties in 2014. The HMDA data indicate that 5.2 percent of such loans went to black borrowers, up from 4.8 percent in 2013, while 7.9 percent went to Hispanic white borrowers, up from 7.3 percent in 2013, reversing a declining trend for both groups. The share of home-purchase loans to high- income borrowers increased to 46.1 percent from 44.8 percent in 2013. 4. The HMDA data provide little indication that the new ATR and QM rules signifi- cantly curtailed mortgage credit availability in 2014 relative to 2013. For example, despite the QM rule that caps borrowers’ DTI ratio for many loans, the fraction of high-DTI loans does not appear to have declined in 2014 from 2013. However, as dis- cussed in more detail later, there are significant challenges in determining the extent to which the new rules have influenced the mortgage market, and the results here do not necessarily rule out significant effects or the possibility that effects may arise in the future. 5. The HMDA loan pricing data indicate that, in 2014, lending activity dropped sharply at the pricing thresholds where HOEPA protections kick in. As discussed later, there are several potential interpretations and implications of this finding. 6. In 2014, only about 3 percent of conventional home-purchase loans and 2 percent of conventional refinance loans were higher priced. However, small banks and credit unions were much more likely to originate conventional higher-priced loans than large banks and mortgage companies and thus accounted for a highly disproportionate share of conventional higher-priced loans in 2014. For example, while small banks and credit unions originated about 18 percent of conventional home-purchase loans, they accounted for about 59 percent of higher-priced conventional home-purchase loans. 7. The share of mortgages originated by nondepository, independent mortgage compa- nies has increased sharply in recent years. In 2014, this group of lenders accounted for 47 percent of first-lien owner-occupant home-purchase loans and 42 percent of such refinance loans, higher levels than at any point since at least 1995. This recent rise has been widespread, occurring across a range of demographic groups and for both con- ventional and nonconventional lending. Small banks and credit unions have also increased their market shares over the past decade, while the fraction of originations attributable to large banks and their nonbank subsidiaries has diminished significantly. 8. Due to this shifting landscape, a historically high share of loans is now originated out- side the federally insured banking system by institutions—independent mortgage com- panies and credit unions—that are not subject to the Community Reinvestment Act (CRA). In addition, small banks have steadily increased the fraction of their lending done outside of their CRA assessment areas. However, assessment-area lending by large banks has held steady in recent years at levels well above those reached during the housing boom. Mortgage Applications and Originations In 2014, 7,062 institutions reported data on nearly 10 million home mortgage applications (including about 1.5 million applications that were closed by the lender for incompleteness or were withdrawn by the applicant before a decision was made) that resulted in about 6 million originations. The number of originations in 2014 was down from 8.7 million originations in 2013 (table 1). The 2014 Home Mortgage Disclosure Act Data 3
  • 4. Table 1. Applications and originations, 2004–14 Numbers of loans, in thousands, except as noted Characteristic of loan and of property 2004 2005 2006 2007 2008 2009 2010 2011 2012 2013 2014 1–4 Family Home purchase Applications 9,804 11,685 10,929 7,609 5,060 4,217 3,848 3,650 4,023 4,554 4,662 Originations 6,437 7,391 6,740 4,663 3,139 2,793 2,547 2,430 2,742 3,112 3,235 First lien, owner occupied 4,789 4,964 4,429 3,454 2,628 2,455 2,218 2,073 2,343 2,680 2,804 Site-built, conventional 4,107 4,425 3,912 2,937 1,581 1,089 1,005 999 1,251 1,622 1,736 Site-built, nonconventional 553 411 386 394 951 1,302 1,151 1,019 1,033 993 1,001 FHA share (percent) 74.6 68.6 66.0 65.8 78.9 77.0 77.4 70.9 68.0 62.7 58.3 VA share (percent) 21.6 26.7 29.0 27.1 15.2 13.9 15.2 18.2 19.9 24.3 28.4 FSA/RHS share (percent) 3.9 4.7 5.0 7.1 5.9 9.0 7.4 10.9 12.0 13.0 13.3 Manufactured, conventional 106 100 101 95 68 43 44 40 44 51 51 Manufactured, nonconventional 24 27 30 29 28 21 17 15 14 14 16 First lien, non-owner occupied 857 1,053 880 607 412 292 285 314 355 385 377 Junior lien, owner occupied 738 1,224 1,269 552 93 44 42 41 43 45 53 Junior lien, non-owner occupied 53 150 162 50 6 2 2 1 1 1 2 Refinance Applications 16,085 15,907 14,046 11,566 7,805 9,983 8,433 7,422 10,526 8,549 4,386 Originations 7,591 7,107 6,091 4,818 3,491 5,772 4,969 4,330 6,668 5,131 2,301 First lien, owner occupied 6,497 5,770 4,469 3,659 2,934 5,301 4,516 3,856 5,930 4,385 1,950 Site-built, conventional 6,115 5,541 4,287 3,407 2,363 4,264 3,835 3,315 4,971 3,628 1,561 Site-built, nonconventional 297 151 110 180 506 979 646 508 917 713 360 FHA share (percent) 68.3 77.3 87.5 91.5 92.2 83.7 79.3 63.2 61.2 61.1 47.3 VA share (percent) 31.4 22.4 12.3 8.3 7.6 15.9 20.3 35.9 37.8 37.7 52.2 FSA/RHS share (percent) .2 .3 .2 .1 .2 .4 .4 .9 .9 1.2 0.5 Manufactured, conventional 77 70 60 56 42 36 25 25 31 32 20 Manufactured, nonconventional 7 8 12 16 22 22 10 9 11 12 8 First lien, non-owner occupied 618 582 547 474 330 350 359 394 660 671 292 Junior lien, owner occupied 464 729 1,036 661 219 115 88 74 73 70 55 Junior lien, non-owner occupied 13 25 39 23 9 7 6 5 5 5 4 Home improvement Applications 2,200 2,544 2,481 2,218 1,413 832 670 675 779 833 840 Originations 964 1,096 1,140 958 573 390 341 335 382 425 408 Multifamily1 Applications 61 58 52 54 43 26 26 35 47 51 45 Originations 48 45 40 41 31 19 19 27 37 40 35 Total applications 28,151 30,193 27,508 21,448 14,320 15,057 12,977 11,782 15,375 13,987 9,933 Total originations 15,040 15,638 14,011 10,480 7,234 8,974 7,876 7,122 9,828 8,707 5,980 Memo Purchased loans 5,142 5,868 6,236 4,821 2,935 4,301 3,229 2,939 3,163 2,794 1,752 Requests for preapproval2 1,068 1,260 1,175 1,065 735 559 445 429 474 516 501 Requests for preapproval that were approved but not acted on 167 166 189 197 99 61 53 55 64 72 64 Requests for preapproval that were denied 171 231 222 235 177 155 117 130 149 163 126 Note: Components may not sum to totals because of rounding. Applications include those withdrawn and those closed for incompleteness. FHA is Federal Housing Administration; VA is U.S. Department of Veterans Affairs; FSA is Farm Service Agency; RHS is Rural Housing Service. 1 A multifamily property consists of five or more units. 2 Consists of all requests for preapproval. Preapprovals are not related to a specific property and thus are distinct from applications. Source: Here and in subsequent tables and figures, except as noted, Federal Financial Institutions Examination Council, data reported under the Home Mortgage Disclosure Act (www.ffiec.gov/hmda). 4 Federal Reserve Bulletin | November 2015
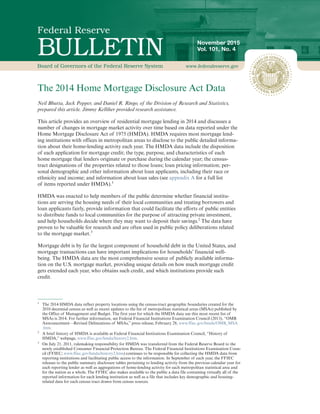
  • 5. Refinance mortgages for one- to four-family properties dropped by over 2.8 million, or 55 percent, from 2013 to 2014, as mortgage interest rates remained above the historic lows reached in the early months of 2013 (figure 1). While the number of refinancings fell for the second consecutive year, one- to four-family home-purchase originations grew by almost 123,000, or 4 percent, from 2013. Most one- to four-family home- purchase loans are first liens for owner-occupied properties. In the past three years, such loans have grown over 35 percent, from nearly 2.1 million in 2011 to over 2.8 mil- lion in 2014. However, the volume of such home-purchase origina- tions has not yet climbed back to the levels observed from 1994 to 2007 (figure 2).8 The number of first-lien home-purchase loans for non-owner-occupied properties— that is, purchases of rental proper- ties, vacation properties, and sec- ond homes—decreased slightly in 2014, from 385,000 in 2013 to 377,000 in 2014. The annual home-purchase loan volumes presented in figure 2 give the impression that the upward trend that began in 2011 slowed in 2014. This impression is mostly an artifact of a decline in lending in the second half of 2013. Figure 3 plots the monthly volume of first- lien home-purchase loans starting in 2011, with and without seasonal 8 The HMDA data prior to 2004 did not provide lien status for loans, and thus the number of loans prior to 2004 includes both first- and junior-lien loans. That said, including junior-lien home-purchase loans in 2014 does not change the conclusion that home-purchase lending in 2014 was below that in 1994. It should also be noted that, because HMDA coverage has expanded over time, in part as a result of significantly more counties being included in metropolitan statistical areas now than in the early 1990s, the lower loan volume in 2014 relative to 1994 is understated. Figure 1. Volume of refinance originations and prime rate, 2012–14 0 100 200 300 400 500 600 700 800 3.0 3.2 3.4 3.6 3.8 4.0 4.2 4.4 4.6 Thousands of loansPercentage points Prime rate (left scale) Refinance originations (right scale) 201420132012 Note: The data are monthly. Loans are first-lien mortgages excluding those for multifamily housing. The prime rate is the average interest rate on 30-year fixed- rate mortgages being offered to high-quality prime borrowers reported by Fred- die Mac in its Primary Mortgage Market Survey. Figure 2. Number of home-purchase and refinance mortgage originations reported under the Home Mortgage Disclosure Act, 1994–2014 1.0 2.0 3.0 4.0 5.0 6.0 Millions of loans A. Home purchase 0.0 3.0 6.0 9.0 12.0 15.0 Millions of loans B. Refinance 1994 1998 2002 2006 2010 2014 1994 1998 2002 2006 2010 2014 Note: The data are annual. Mortgage originations for one- to four-family owner- occupied properties, with junior-lien loans excluded in 2004 and later. The 2014 Home Mortgage Disclosure Act Data 5
  • 6. adjustment.9 The figure shows that, in fact, the seasonally adjusted growth rate of home-purchase originations during the course of 2014 was fairly similar to that seen from 2011 through the first half of 2013. In table 1, the volume of first-lien lending for owner-occupied proper- ties is further disaggregated by loan and property type. (A larger, supplementary version of table 1, with the data broken down by month, is available in the Excel file posted with this article, as are all of the other tables referenced in the article.) In addition to lien and occupancy status, the HMDA data provide details on the type of property securing the loan (site-built or manufactured home) and on the type of loan (conventional or not).10 As noted earlier, nonconventional lending involves loans with mortgage insurance or guaran- tees from federal government agencies, including the FHA, the VA, the RHS, and the FSA. Conventional lending encompasses all other loans, including those sold to the government- sponsored enterprises (GSEs) Fannie Mae and Freddie Mac. Nonconventional loans are more common for home purchases than refinancings and usu- ally involve high loan-to-value (LTV) ratios—that is, the borrowers provide relatively small down payments. For site-built properties, nonconventional home-purchase loans increased less than 1 percent in 2014, while conventional loans increased about 7 percent. The non- conventional share of first-lien home-purchase loans for one- to four-family, owner-occu- pied, site-built properties stood at about 36 percent in 2014, down slightly from 38 percent in 2013 and down significantly from its peak of 54 percent in 2009 in the wake of the finan- cial crisis.11 That said, last year, the nonconventional share remained above historical aver- ages (figure 4). Figure 4 shows that the marked decline in the nonconventional share since 2009 reflects a decrease in the FHA share of loans, while the VA and FSA/RHS shares have held steady over this period. One factor that may help explain the reduction in the FHA share is a series of increases in the annual MIP that the FHA charges to borrowers. Between Octo- 9 The data series was adjusted for seasonality using the Census Bureau’s X-12 package. For a description of X-12 and seasonal adjustment in general, see the Census Bureau’s “FAQs on Seasonal Adjustment” at www.census .gov/const/www/faq2.html. The date used to compile data at the monthly level is the “action date,” which is the date on which the lending institution took action on an application. For approved applications, this date is usu- ally the closing date or origination date of the loan. The action date is not released in the public HMDA data files. 10 Manufactured-home lending differs from lending on site-built homes, in part because most of the homes are sold without land and are treated as chattel-secured lending, which typically carries higher interest rates and shorter terms to maturity than those on loans to purchase site-built homes (for pricing information on manu- factured home loans, see table 8). This article focuses almost entirely on site-built mortgage originations, which constitute the vast majority of originations (as shown in table 1). That said, it is important to keep in mind that, because manufactured homes typically are less expensive than site-built homes, they provide a low-cost housing option for households with more moderate incomes. 11 For a more detailed discussion of the post-crisis rise in nonconventional lending, see Robert B. Avery, Neil Bhutta, Kenneth P. Brevoort, and Glenn B. Canner (2010), “The 2009 HMDA Data: The Mortgage Market in a Time of Low Interest Rates and Economic Distress,” Federal Reserve Bulletin, vol. 96 (December), pp. A39– A77, www.federalreserve.gov/pubs/bulletin/2010/default.htm. Figure 3. Volume of home-purchase originations, 2011–14 100 150 200 250 300 350 Thousands of loans Seasonally adjusted Not seasonally adjusted 2011 2012 2013 2014 Note: The data are monthly. Loans are first-lien home-purchase mortgage originations. 6 Federal Reserve Bulletin | November 2015
  • 7. ber 2010 and April 2013, the annual MIP for a typical home- purchase loan more than doubled, from 0.55 percent of the loan amount to 1.35 percent.12 Also in 2013, the FHA extended the period over which the annual MIP is required to be paid. For a typical home-purchase loan, the annual premium must now be paid over the life of the loan rather than until the LTV ratio falls below 78 per- cent. Although this extension has no effect on the initial cost of the mortgage, it would change the potential longer-term cost if bor- rowers continued to hold the mort- gage after the LTV ratio fell below 78 percent.13 The remainder of table 1 provides additional details on the break- down of one- to four-family home- purchase and refinance loans by lien and occupancy status and by property and loan type.14 Table 1 also provides the number of applications for and originations of home-im- provement loans for one- to four-family properties, many of which are junior liens or unse- cured, and loans for the purchase of multifamily properties (consisting of five or more units). Finally, the HMDA data include details about preapproval requests for home-pur- chase loans and loans purchased by reporting institutions during the reporting year, although the purchased loans may have been originated at any point in time. Lenders also reported roughly 501,000 preapproval requests; roughly 62 percent of these requests turned into an actual loan application for a specific property in 2014.15 Table 1 also shows that, for 2014, lenders purchased 1.8 million loans from other institutions. 12 Changes to the FHA’s upfront and annual MIPs over time have been documented in Urban Institute, Housing Finance Policy Center (2014), Housing Finance at a Glance: A Monthly Chartbook (Washington: Urban Insti- tute, March), www.urban.org/publications/413061.html. A typical FHA home-purchase loan has an LTV of over 95 percent and a loan term in excess of 15 years. The upfront premium, on net, was unchanged between 2010 and 2013; it was briefly increased from 1.75 percent to 2.25 percent and lowered back to 1.00 percent in 2010, and then it was raised back to 1.75 percent in 2012. 13 For 2015, the FHA reduced the annual premium by 50 basis points on new forward mortgages beginning on January 26. See U.S. Department of Housing and Urban Development (2015), “Reduction of Federal Housing Administration (FHA) Annual Mortgage Insurance Premium (MIP) Rates and Temporary Case Cancellation Authority,” Mortgagee Letter 2015-01 (January 9), https://portal.hud.gov/hudportal/documents/huddoc?id=15- 01ml.pdf. 14 Note that under the regulations that govern HMDA reporting, many standalone junior-lien loans are not reported because either the lender does not know the purpose of the loan or the reasons cited for the loan are not ones that trigger a reporting requirement. Unless a junior lien is used for home purchase or explicitly for home improvements, or to refinance an existing lien, it is not reported under HMDA. Further, home equity lines of credit, many of which are junior liens and could also be used to help purchase a home, do not have to be reported in the HMDA data regardless of the purpose of the loan. 15 Reporters can, but are not required to, report preapproval requests that they approve but are not acted on by the potential borrower. Figure 4. Nonconventional share of home-purchase mortgage originations, 1994–2014 0 20 40 60 80 100 Percent FSA/RHS VA FHA Conventional 1994 1998 2002 2006 2010 2014 Note: The data are annual. Home-purchase mortgage originations for one- to four-family owner-occupied properties, with junior-lien loans excluded in 2004 and later. Nonconventional loans are those insured by the Federal Housing Administration (FHA) or backed by guarantees from the U.S. Department of Veter- ans Affairs (VA), the Farm Service Agency (FSA), or the Rural Housing Service (RHS). The 2014 Home Mortgage Disclosure Act Data 7
  • 8. Mortgage Outcomes by Income and by Race and Ethnicity A key attribute of the HMDA data is that they help policymakers and the broader public better understand the distribution of mortgage credit across different demographic groups. The next set of tables provides information on loan shares, product usage, denial rates and reasons, and mortgage pricing for population groups defined by applicant income, neigh- borhood income, and applicant race and ethnicity (tables 2–8). With the exception of table 8, which includes loans for manufactured homes, these tables focus on first-lien home- purchase and refinance loans for one- to four-family, owner-occupied, site-built properties. As can be seen from table 1, such loans accounted for about 78 percent of all HMDA origi- nations in 2014. The Distribution of Home Loans across Demographic Groups Table 2 shows different groups’ shares of home-purchase and refinance loans and how these shares have changed over time. For example, black borrowers’ share of home-pur- chase loans (conventional and nonconventional loans combined) was 5.2 percent in 2014, up from 4.8 percent in 2013 but still lower than its peak of 8.7 percent in 2006. Similarly, the Hispanic white share of home-purchase loans was 7.9 percent in 2014, up from 7.3 per- cent in 2013, although well below the 11.7 percent share seen in 2006. Shares of refinance loans to minorities other than Asians have generally increased since 2010. The bottom of the table provides the total loan counts for each year, and thus the number of loans to a given group in a given year can be easily derived.16 In terms of borrower income, the share of home-purchase loans to low- or moderate- income (LMI) borrowers declined, from 28.4 percent in 2013 to 27.0 percent in 2014.17 Fol- lowing definitions used by the federal bank supervisory agencies in enforcement of the CRA, LMI borrowers are defined as those with incomes of less than 80 percent of esti- mated current area median family income (AMFI); AMFI is calculated based on the incomes of residents of the metropolitan area or nonmetropolitan portion of the state in which the loan-securing property is located.18 For 2014, the Office of Management and Budget published new metropolitan area delineations, so caution should be exercised in comparing relative income measures between 2013 and 2014.19 From 2013 to 2014, the home-purchase loan share directed to high-income neighborhoods (defined as census tracts) decreased from 43.2 percent to 41.8 percent.20 LMI and middle- income tracts both saw small gains. In addition to the difficulties in comparison induced by the changing metropolitan area definitions, it is important to note that shares by neighbor- hood income in 2012 and thereafter are not perfectly comparable with those in 2011 and earlier because census-tract definitions and census-tract median family income esti- mates were revised in 2012. The current tract demographic measures are based on 2010 16 For example, the number of home-purchase loans to Asians in 2014 was about 148,000, derived by multiplying 2.737 million loans by 5.4 and then dividing by 100. 17 Note that the sum of refinance shares across borrower-income groups is significantly less than 100 percent because income is not always relied on in underwriting decisions, particularly in recent years, which appears to reflect increased usage of nonconventional streamline refinance programs. Indeed, in 2014, about 75 percent of refinance loans for which borrower income was not reported were nonconventional. 18 Middle-income borrowers have incomes of at least 80 percent and less than 120 percent of AMFI, and high-in- come borrowers have incomes of at least 120 percent of AMFI. 19 A similar redefinition of metropolitan areas affects comparisons between the 2003 and 2004 HMDA data. 20 Definitions for LMI, middle-income, and high-income neighborhoods are identical to those for LMI, middle- income, and high-income borrowers but are based on the ratio of census-tract median family income to AMFI measured from the 2006–10 American Community Survey data. 8 Federal Reserve Bulletin | November 2015
  • 9. Table 2. Distribution of home loans, by purpose of loan, 2004–14 Percent except as noted Characteristic of borrower and of neighborhood 2004 2005 2006 2007 2008 2009 2010 2011 2012 2013 2014 A. Home purchase Borrower race and ethnicity1 Asian 4.8 5.0 4.5 4.5 4.9 5.3 5.5 5.2 5.3 5.7 5.4 Black or African American 7.1 7.7 8.7 7.6 6.3 5.7 6.0 5.5 5.1 4.8 5.2 Hispanic white 7.6 10.5 11.7 9.0 7.9 8.0 8.1 8.3 7.7 7.3 7.9 Non-Hispanic white 57.1 61.7 61.2 65.4 67.5 67.9 67.6 68.7 70.0 70.2 69.1 Other minority2 1.4 1.3 1.1 1.0 .9 .9 .9 .8 .8 .7 .8 Joint 2.3 2.3 2.3 2.5 2.8 2.8 2.7 2.8 2.9 3.1 3.3 Missing 19.8 11.5 10.5 10.1 9.6 9.3 9.1 8.6 8.2 8.2 8.3 All 100 100 100 100 100 100 100 100 100 100 100 Borrower income3 Low or moderate 27.7 24.6 23.6 24.7 28.1 36.7 35.5 34.4 33.3 28.4 27.0 Middle 26.9 25.7 24.7 25.2 27.1 26.7 25.6 25.2 25.2 25.2 25.6 High 41.4 45.5 46.7 47.0 43.1 34.7 37.4 38.8 40.0 44.8 46.1 Income not used or not applicable 4.0 4.2 5.0 3.1 1.7 1.9 1.5 1.6 1.5 1.6 1.3 All 100 100 100 100 100 100 100 100 100 100 100 Neighborhood income4 Low or moderate 14.5 15.1 15.7 14.4 13.1 12.6 12.1 11.0 12.8 12.7 13.3 Middle 48.7 49.2 49.5 49.6 49.8 50.2 49.4 49.4 43.6 43.7 44.6 High 35.8 34.7 33.7 35.1 35.9 35.8 37.7 39.1 43.2 43.2 41.8 All 100 100 100 100 100 100 100 100 100 100 100 B. Refinance Borrower race and ethnicity1 Asian 3.5 2.9 3.0 3.1 3.1 4.1 5.2 5.4 5.5 4.7 4.4 Black or African American 7.4 8.3 9.6 8.4 6.0 3.5 2.9 3.1 3.3 4.4 5.3 Hispanic white 6.2 8.6 10.1 8.7 5.3 3.2 3.0 3.3 3.9 5.0 6.2 Non-Hispanic white 57.2 60.9 59.6 62.7 70.7 74.6 74.3 73.5 72.5 70.5 67.8 Other minority2 1.4 1.4 1.3 1.1 .8 .6 .5 .6 .6 .7 .9 Joint 2.1 2.1 1.9 2.0 2.2 2.6 2.7 2.8 3.1 3.1 3.3 Missing 22.1 15.7 14.6 14.1 11.9 11.4 11.4 11.3 11.1 11.6 12.2 All 100 100 100 100 100 100 100 100 100 100 100 Borrower income3 Low or moderate 26.2 25.5 24.7 23.3 23.5 19.6 19.0 19.2 19.6 21.1 22.2 Middle 26.3 26.8 26.1 25.6 25.5 22.5 22.5 21.3 21.8 21.7 22.2 High 38.8 40.8 43.7 46.1 44.8 45.8 49.6 48.1 47.7 46.3 45.6 Income not used or not applicable 8.7 6.9 5.5 5.0 6.2 12.1 8.9 11.4 10.9 10.9 10.0 All 100 100 100 100 100 100 100 100 100 100 100 Neighborhood income4 Low or moderate 15.3 16.5 17.9 16.1 11.9 7.7 7.2 7.4 10.1 12.1 13.1 Middle 50.0 51.3 52.0 52.2 51.9 47.5 46.1 46.1 41.9 43.8 45.2 High 33.9 31.6 29.4 31.0 35.2 43.5 46.0 46.0 47.6 43.9 41.4 All 100 100 100 100 100 100 100 100 100 100 100 Memo Number of home-purchase loans (thousands) 4,660 4,836 4,298 3,331 2,533 2,391 2,157 2,018 2,284 2,615 2,737 Number of refinance loans (thousands) 6,412 5,692 4,397 3,588 2,869 5,243 4,481 3,823 5,888 4,341 1,921 Note: First-lien mortgages for one- to four-family family, owner-occupied, site-built homes. Rows may not sum to 100 because of rounding or, for the distribution by neighborhood income, because property location is missing. 1 Applications are placed in one category for race and ethnicity. The application is designated as joint if one applicant was reported as white and the other was reported as one or more minority races or if the application is designated as white with one Hispanic applicant and one non-Hispanic applicant. If there are two applicants and each reports a different minority race, the application is designated as two or more minority races. If an applicant reports two races and one is white, that applicant is categorized under the minority race. Otherwise, the applicant is categorized under the first race reported. “Missing” refers to applications in which the race of the applicant(s) has not been reported or is not applicable or the application is categorized as white but ethnicity has not been reported. 2 Consists of applications by American Indians or Alaska Natives, Native Hawaiians or other Pacific Islanders, and borrowers reporting two or more minority races. 3 The categories for the borrower-income group are as follows: Low- or moderate-income (or LMI) borrowers have income that is less than 80 percent of estimated current area median family income (AMFI), middle-income borrowers have income that is at least 80 percent and less than 120 percent of AMFI, and high-income borrowers have income that is at least 120 percent of AMFI. 4 The categories for the neighborhood-income group are based on the ratio of census-tract median family income to area median family income from the 2006–10 American Community Survey data for 2012 and 2013 and from the 2000 census for 2004–11, and the three categories have the same cutoffs as the borrower-income groups (see note 3). The 2014 Home Mortgage Disclosure Act Data 9
  • 10. census data and 2006–10 American Community Survey data, whereas the 2004–11 data relied on 2000 census income and population data.21 One way to examine how lending to LMI borrowers and neighborhoods changed between 2013 and 2014 in the absence of changes to metropolitan statistical area (MSA) definitions is to focus exclusively on lending in MSAs whose boundaries remained the same across the two years. There are 282 such MSAs, and they accounted for about half of all HMDA-re- ported mortgage originations in 2013 and 2014 combined. In these MSAs, changes in the share of loans to different income groups largely mirror the nationwide patterns shown in table 2 (numbers for the 282 MSAs not shown in tables). Table 3 shows the average dollar value of home-purchase and refinance loans by different groups and how these averages have changed over time. All dollar amounts are reported in nominal terms. Overall, home-purchase dollar values follow the historical trend of home prices, rising during the mid-2000s, falling sharply through 2008 and 2009, then beginning to recover in the past few years. The trends differ substantially by race and ethnicity, how- ever. The average home-purchase loan to a Hispanic white borrower in 2014 was for $198,000, up from $190,000 in 2013 but well below the peak of $238,000 in 2006. In con- trast, the average home-purchase loan amount for a non-Hispanic white borrower was about $231,000 in 2014, higher than the pre-crisis peak in 2007 of about $222,000. Asian borrowers took out the largest loans, averaging $344,000 for home purchases and $343,000 for refinancings in 2014, whereas loans to black borrowers averaged $199,000 for home purchases and $175,000 for refinancings.22 In terms of borrower income, for LMI borrowers, the average home-purchase loan edged down from $133,000 in 2013 to $132,000 in 2014; it also edged down for middle-income borrowers. High-income borrowers saw their average home-purchase loan value rise to $328,000 in 2014 from $323,000 in 2013. The average refinance loan value declined for LMI borrowers but rose for middle- and high-income borrowers, while the average loan value for both home-purchase and refinance loans rose in LMI, middle-income, and high-income neighborhoods. Refinance loans in high-income neighborhoods increased the most in aver- age value, to $293,000 in 2014 from $270,000 in 2013. Variation across Demographic Groups in Nonconventional Loan Use Table 4 shows that black and Hispanic white borrowers are much more likely to use non- conventional loans (FHA, VA, RHS, and FSA loans) than conventional loans compared with other racial and ethnic groups. In 2014, 68 percent of black home-purchase borrowers and 60 percent of Hispanic white home-purchase borrowers took out a nonconventional loan, compared with about 33 percent of non-Hispanic white home-purchase borrowers and just 15 percent of Asian home-purchase borrowers. These numbers have declined from their peaks in 2009 and 2010, when over three-fourths of black and Hispanic white home- purchase borrowers, and over one-half of non-Hispanic white home-purchase borrowers, took out nonconventional loans. Nonconventional usage is also more prevalent for borrowers with lower incomes and in neighborhoods with lower incomes. In 2014, about one-half of LMI home-purchase bor- rowers and 48 percent of those borrowing to purchase homes in LMI neighborhoods used 21 For more information on the transition to the new census-tract data, see Robert B. Avery, Neil Bhutta, Kenneth P. Brevoort, and Glenn B. Canner (2012), “The Mortgage Market in 2011: Highlights from the Data Reported under the Home Mortgage Disclosure Act,” Federal Reserve Bulletin, vol. 98 (December), pp. 1–46, www .federalreserve.gov/pubs/bulletin/2012/default.htm. 22 Median loan amounts (not shown in tables) followed similar trends as average loan amounts. 10 Federal Reserve Bulletin | November 2015
  • 11. nonconventional loans, compared with 24 percent of high-income borrowers and 26 per- cent of borrowers in high-income neighborhoods. With respect to refinance loans, minority and lower-income borrowers are again more likely to use nonconventional than conven- tional loans. In general, however, nonconventional loans are less prevalent in refinance lending.23 23 The reported nonconventional share of refinance loans is lower than the true share for the groups categorized Table 3. Average value of home loans, by purpose of loan, 2004–14 Thousands of dollars, nominal Characteristic of borrower and of neighborhood 2004 2005 2006 2007 2008 2009 2010 2011 2012 2013 2014 A. Home purchase Borrower race and ethnicity1 Asian 280 316 326 334 299 276 293 291 304 328 344 Black or African American 166 183 197 197 184 172 174 174 179 193 199 Hispanic white 189 224 238 220 186 168 168 168 176 190 198 Non-Hispanic white 193 211 216 222 209 195 204 204 213 226 231 Other minority2 206 240 257 245 216 196 201 198 206 219 229 Joint 233 255 261 269 255 248 263 261 274 289 293 Missing 216 248 261 280 265 242 256 262 279 298 293 Borrower income3 Low or moderate 114 116 117 123 128 129 128 125 131 133 132 Middle 165 170 170 176 182 187 189 184 192 194 193 High 281 306 313 317 297 291 303 302 313 323 328 Income not used or not applicable 208 235 254 266 218 195 214 225 233 262 272 Neighborhood income4 Low or moderate 159 180 189 188 175 160 164 163 158 171 178 Middle 172 190 197 196 186 174 177 173 178 191 196 High 258 284 294 301 277 257 270 271 282 300 307 Memo: All home-purchase loans 201 221 228 232 217 202 210 210 221 235 240 B. Refinance Borrower race and ethnicity1 Asian 274 325 370 368 321 298 313 309 308 304 343 Black or African American 151 180 199 192 173 184 180 174 181 171 175 Hispanic white 178 219 252 244 193 190 191 183 190 180 190 Non-Hispanic white 180 205 221 222 205 209 210 208 212 205 217 Other minority2 190 229 269 258 211 217 218 207 213 201 215 Joint 210 246 265 262 243 247 254 249 254 248 267 Missing 194 226 246 250 242 243 248 253 253 244 247 Borrower income3 Low or moderate 114 124 124 126 129 138 133 128 135 128 124 Middle 162 181 183 181 180 185 179 174 182 171 175 High 256 294 320 311 275 268 274 280 277 276 302 Income not used or not applicable 150 178 240 240 194 204 203 185 212 192 202 Neighborhood income4 Low or moderate 142 169 188 185 164 172 172 167 163 153 158 Middle 158 184 201 198 182 184 182 175 181 173 181 High 245 282 313 311 272 259 265 269 269 270 293 Memo: All refinance loans 185 212 232 231 212 216 220 218 221 213 224 Note: First-lien mortgages for one- to four-family, owner-occupied, site-built homes. 1 See table 2, note 1. 2 See table 2, note 2. 3 See table 2, note 3. 4 See table 2, note 4. The 2014 Home Mortgage Disclosure Act Data 11
  • 12. Black and Hispanic white borrowers tend to have lower incomes, on average, than non-His- panic white borrowers. Still, racial and ethnic differences in nonconventional loan use per- sist within income groups. Figure 5 displays the nonconventional share of home-purchase and refinance loans for Asian, black, Hispanic white, and non-Hispanic white borrowers split into LMI, middle-income, and high-income groups. For home-purchase loans, black by borrower income because, in most nonconventional refinance loans, income is not reported. Thus, when income is reported on a refinance loan, the loan is likely to be conventional. Table 4. Nonconventional share of home loans, by purpose of loan, 2004–14 Percent except as noted Characteristic of borrower and of neighborhood of borrower 2004 2005 2006 2007 2008 2009 2010 2011 2012 2013 2014 A. Home purchase Borrower race and ethnicity1 Asian 2.9 1.8 2.1 2.6 13.4 26.1 26.6 25.8 21.9 16.0 14.7 Black or African American 21.7 14.3 13.6 21.7 64.1 82.0 82.9 80.3 77.2 70.6 68.0 Hispanic white 13.7 7.5 7.0 12.4 51.4 75.4 77.0 74.1 70.7 62.8 59.5 Non-Hispanic white 11.1 8.9 9.5 11.5 35.4 52.0 50.3 47.4 42.2 35.3 33.4 Other minority2 14.0 9.3 9.4 14.8 48.4 67.6 68.8 65.9 62.2 55.3 53.9 Joint 16.9 12.8 14.4 17.2 46.4 59.4 56.3 53.6 48.9 41.8 41.3 Missing 11.3 5.1 5.7 8.8 32.7 50.6 49.4 45.9 39.4 31.9 32.2 Borrower income3 Low or moderate 20.3 15.2 14.9 16.0 46.1 65.3 66.6 64.5 59.7 52.3 50.2 Middle 14.3 11.0 12.6 16.8 46.1 60.4 59.3 57.0 51.5 45.5 44.7 High 5.3 3.9 4.9 7.5 26.7 38.5 37.2 34.3 29.5 25.0 24.2 Neighborhood income4 Low or moderate 15.8 9.7 9.6 13.8 45.5 64.4 65.1 61.2 57.9 49.6 48.0 Middle 14.1 10.2 10.8 14.2 42.7 59.8 59.4 56.9 52.0 44.5 43.0 High 7.1 5.4 6.1 7.6 27.4 43.4 42.0 39.5 34.6 28.0 26.1 Memo: All borrowers 11.9 8.5 9.0 11.8 37.6 54.4 53.4 50.5 45.2 38.0 36.6 B. Refinance Borrower race and ethnicity1 Asian 1.2 .7 .6 1.0 4.6 5.7 4.7 4.3 5.9 6.7 6.9 Black or African American 11.1 5.8 4.4 10.2 39.2 53.8 42.0 37.8 38.6 37.0 40.3 Hispanic white 5.6 2.6 1.9 3.9 20.5 36.2 28.1 22.9 26.9 25.7 21.4 Non-Hispanic white 4.0 2.4 2.6 4.9 15.9 16.8 13.6 12.2 14.2 14.8 16.5 Other minority2 5.5 3.4 2.4 4.9 20.0 28.3 23.3 21.9 25.5 24.9 25.7 Joint 7.5 3.7 3.4 6.2 19.5 21.1 16.6 16.3 20.1 20.4 26.6 Missing 4.2 1.9 1.7 4.1 18.7 19.0 12.5 13.6 16.5 16.8 21.8 Borrower income3 Low or moderate 2.3 1.6 2.9 5.7 18.3 16.6 14.0 11.5 9.3 9.4 13.0 Middle 1.7 1.3 2.7 6.2 19.6 13.2 12.2 10.9 8.9 9.6 13.3 High .8 .6 1.1 2.7 10.5 7.2 6.7 6.3 5.5 6.2 8.8 Neighborhood income4 Low or moderate 5.9 3.2 2.9 6.3 24.6 31.3 23.1 19.7 22.2 22.1 23.0 Middle 5.2 3.0 2.9 5.8 20.2 22.3 17.5 16.1 18.4 18.9 21.3 High 2.9 1.7 1.6 3.0 11.3 12.1 10.0 9.3 11.7 12.4 14.6 Memo: All borrowers 4.6 2.6 2.5 5.0 17.6 18.7 14.4 13.3 15.6 16.4 18.7 Note: First-lien mortgages for one- to four-family, owner-occupied, site-built homes. Nonconventional loans are those insured by the Federal Housing Administration or backed by guarantees from the U.S. Department of Veterans Affairs, the Farm Service Agency, or the Rural Housing Service. 1 See table 2, note 1. 2 See table 2, note 2. 3 See table 2, note 3. 4 See table 2, note 4. 12 Federal Reserve Bulletin | November 2015
  • 13. and Hispanic white borrowers were much more likely than non-Hispanic white borrowers to get nonconventional loans within each income grouping. For refinance loans, a substan- tial black–white gap persists across income groups, but LMI and middle-income Hispanic white borrowers use nonconventional loans at approximately the same rate as their non- Hispanic white counterparts. Greater reliance on nonconventional loans may reflect the relatively low down-payment requirements of the FHA and VA lending programs, which serve the needs of borrowers who have few assets to meet down-payment and closing-cost requirements.24 The patterns of product incidence could also reflect the behavior of lenders to some extent; for example, concerns have been raised about the possibility that lenders steer borrowers in certain neighborhoods toward nonconventional loans.25 24 Findings of the Federal Reserve Board’s Survey of Consumer Finances for 2010 indicate that liquid asset levels and financial wealth holdings for minorities and lower-income groups are substantially smaller than they are for non-Hispanic white borrowers or higher-income populations. See Board of Governors of the Federal Reserve System, “2010 Survey of Consumer Finances,” webpage, www.federalreserve.gov/econresdata/scf/scf_2010.htm. 25 See, for example, Glenn B. Canner, Stuart A. Gabriel, and J. Michael Woolley (1991), “Race, Default Risk and Figure 5. Nonconventional share of originations, by borrower race, ethnicity, and income, 2014 A. Home purchase 0 20 40 60 80 0 10 20 30 Percent of originations Percent of originations B. Refinance Low or moderate income Middle income High income Low or moderate income Middle income High income Asian Black or African American Hispanic white Non-Hispanic white Asian Black or African American Hispanic white Non-Hispanic white Note: The data are annual. Mortgage originations for first-lien, one- to four-family, owner-occupied properties. For definition of borrower race and ethnicity, see table 2, note 1. For explanation of borrower income, see table 2, note 3. For definition of nonconventional loans, see table 5, note 1. The 2014 Home Mortgage Disclosure Act Data 13
  • 14. Denial Rates and Denial Reasons In 2014, the overall denial rate on applications for home-purchase loans of 13.2 percent was somewhat lower than in 2013, while the denial rate for refinance loan applications of 30.6 percent was substantially higher than in 2013 (table 5).26 Over longer horizons, denial rates have exhibited significant variation, and these changes differ by type of loan. For example, for conventional home-purchase loan applications, the denial rate of 11.7 percent in 2014 was 6.8 percentage points lower than in 2006, while for nonconventional home-pur- chase loan applications, the denial rate of 15.6 percent in 2014 was 3.5 percentage points higher than in 2006. Changes in raw denial rates over time reflect not only changes in credit standards, but also changes in the demand for credit and in the composition of borrowers applying for mortgages. For example, the denial rate on applications for conventional home-purchase loans was lower in 2014 than during the housing boom years, even though most measures of credit availability suggest that credit standards are tighter today.27 This result may stem from a relatively large drop in applications from riskier applicants. As in past years, black, Hispanic white, and “other minority” borrowers had notably higher denial rates in 2014 than non-Hispanic white borrowers, while denial rates for Asian bor- rowers were more similar to those for non-Hispanic white borrowers. For example, the denial rates for conventional home-purchase loans were about 25 percent for black borrow- ers, 19 percent for Hispanic white borrowers, 20 percent for other minority borrowers, 12 percent for Asian borrowers, and 10 percent for non-Hispanic white borrowers. Previous research and experience gained in the fair lending enforcement process show that differences in denial rates and in the incidence of higher-priced lending (the topic of the next subsection) among racial or ethnic groups stem, at least in part, from factors related to credit risk that are not available in the HMDA data, such as credit history (including credit scores) and LTV ratios. Differential costs of loan origination and the competitive environ- ment also may bear on the differences in pricing, as may differences across populations in credit-shopping activities. Despite these limitations, the HMDA data play an important role in fair lending enforce- ment. The data are regularly used by bank examiners to facilitate the fair lending examina- tion and enforcement processes. When examiners for the federal banking agencies evaluate an institution’s fair lending risk, they analyze HMDA price data and loan application outcomes in conjunction with other information and risk factors that can be drawn directly from loan files or electronic records maintained by lenders, as directed by the Interagency Fair Lending Examination Procedures.28 The availability of broader information allows the examiners to draw stronger conclusions about institution compliance with the fair lending laws. Lenders can, but are not required to, report up to three reasons for denying a mortgage application, selecting from nine potential denial reasons (table 6). Among denied first-lien applications for one- to four-family, owner-occupied, site-built properties in 2014, about Mortgage Lending: A Study of the FHA and Conventional Loan Markets,” Southern Economic Journal, vol. 58 (July), pp. 249–62. 26 Denial rates are calculated as the number of denied loan applications divided by the total number of applica- tions, excluding withdrawn applications and application files closed for incompleteness. 27 Both the Mortgage Bankers Association and the Urban Institute publish indexes of mortgage credit availability suggesting that standards have been much tighter since the crisis. See Wei Li, Laurie Goodman, Ellen Seidman, Jim Parrott, Jun Zhu, and Bing Bai (2014), “Measuring Mortgage Credit Accessibility,” working paper (Wash- ington: Urban Institute, November), www.urban.org/research/publication/measuring-mortgage-credit- accessibility. 28 The Interagency Fair Lending Examination Procedures are available at www.ffiec.gov/PDF/fairlend.pdf. 14 Federal Reserve Bulletin | November 2015
  • 15. 75 percent of denied home-purchase applications and about 63 percent of denied refinance applications had at least one reported denial reason. The two most frequently cited denial reasons for both home-purchase and refinance loans were the applicant’s credit history and DTI ratio (note that the columns in table 6 can add up to more than 100 percent because lenders can cite more than one denial reason). For both home-purchase and refinance Table 5. Denial rates, by purpose of loan, 2004–14 Percent Type of loan and race and ethnicity of borrower 2004 2005 2006 2007 2008 2009 2010 2011 2012 2013 2014 A. Home purchase Conventional and nonconventional1 All applicants 14.4 16.0 18.0 18.7 18.0 15.5 15.6 15.8 14.9 14.5 13.2 Asian 13.7 15.9 16.9 17.5 19.2 16.3 15.8 16.5 15.8 15.1 13.9 Black or African American 23.6 26.5 30.3 33.5 30.6 25.5 24.8 26.0 26.0 25.5 22.7 Hispanic white 18.3 21.1 25.1 29.5 28.3 22.2 21.8 21.1 20.2 20.5 18.1 Non-Hispanic white 11.1 12.2 12.9 13.3 14.0 12.8 12.9 13.1 12.5 12.2 11.0 Other minority2 19.4 20.8 24.0 26.7 25.5 21.2 21.9 20.9 20.8 21.5 18.8 Conventional only All applicants 14.6 16.3 18.5 19.0 18.3 15.8 15.2 15.1 13.6 12.9 11.7 Asian 13.7 16.0 17.1 17.5 19.1 15.8 14.8 15.5 14.4 13.9 13.0 Black or African American 25.0 27.8 31.9 35.7 37.6 35.8 33.6 33.2 32.0 28.5 24.6 Hispanic white 18.6 21.4 25.7 30.5 32.5 26.9 24.9 24.2 22.4 21.5 18.7 Non-Hispanic white 11.2 12.3 13.2 13.3 14.1 13.3 12.9 12.7 11.6 10.9 9.8 Other minority2 19.7 21.2 24.8 27.8 29.0 25.9 28.0 24.6 23.6 22.6 20.1 Nonconventional only1 All applicants 13.3 12.5 12.1 16.2 17.4 15.3 16.0 16.5 16.3 17.0 15.6 Asian 12.6 11.6 10.6 15.5 20.2 17.7 18.6 19.3 20.2 20.7 18.6 Black or African American 17.7 16.8 16.2 22.8 25.3 22.6 22.7 23.9 24.0 24.2 21.7 Hispanic white 16.3 17.2 15.7 20.5 23.1 20.4 20.7 19.9 19.3 20.0 17.7 Non-Hispanic white 10.7 10.2 10.0 13.1 13.9 12.5 13.0 13.6 13.7 14.4 13.2 Other minority2 16.8 16.3 15.2 18.6 20.9 18.7 18.7 18.8 18.9 20.5 17.7 B. Refinance Conventional and nonconventional1 All applicants 29.5 32.6 35.4 39.6 37.7 24.0 23.3 23.8 19.9 22.7 30.6 Asian 18.8 23.5 27.5 32.6 32.5 21.4 19.5 20.1 17.3 20.5 27.5 Black or African American 39.9 42.2 44.1 52.0 56.0 42.2 41.7 40.0 32.8 33.9 45.4 Hispanic white 28.7 30.1 33.2 43.0 49.1 36.4 33.4 33.2 27.5 28.7 36.0 Non-Hispanic white 24.1 26.9 30.1 33.7 32.2 20.7 20.6 21.3 17.8 20.0 27.1 Other minority2 33.7 35.5 40.6 52.0 57.4 37.3 35.3 34.4 30.0 30.5 41.3 Conventional only All applicants 30.1 32.9 35.6 39.9 37.0 22.1 21.3 22.3 19.4 22.0 29.0 Asian 18.8 23.5 27.5 32.5 31.5 20.2 18.5 19.4 17.0 20.0 26.6 Black or African American 41.7 43.0 44.7 53.3 60.9 48.6 41.4 40.6 34.8 35.1 46.5 Hispanic white 29.3 30.2 33.3 43.2 50.2 38.9 33.6 33.5 28.9 29.8 36.5 Non-Hispanic white 24.6 27.1 30.4 33.9 31.5 19.1 18.9 20.1 17.4 19.4 25.7 Other minority2 34.5 35.7 40.9 52.6 59.4 38.4 34.8 34.4 31.1 31.0 40.3 Nonconventional only1 All applicants 15.0 20.1 21.9 31.6 40.9 31.1 33.3 32.2 22.2 25.9 36.5 Asian 15.0 20.0 22.0 38.5 48.9 37.2 34.2 32.7 22.2 26.1 37.5 Black or African American 17.5 23.6 24.6 33.7 43.5 35.1 42.2 39.1 29.5 31.6 43.8 Hispanic white 15.7 23.6 26.3 34.6 43.4 31.4 33.0 32.3 23.3 25.4 34.4 Non-Hispanic white 12.0 17.6 19.7 28.3 36.1 27.4 29.3 29.0 19.7 23.0 33.7 Other minority2 15.2 25.8 22.2 34.8 45.4 34.1 37.0 34.4 26.6 28.9 43.9 Note: First-lien mortgages for one- to four-family, owner-occupied, site-built homes. Excludes applications where no credit decision was made. For a description of how borrowers are categorized by race and ethnicity, see table 2, note 1. 1 Nonconventional loans are those insured by the Federal Housing Administration or backed by guarantees from the U.S. Department of Veterans Affairs, the Farm Service Agency, or the Rural Housing Service. 2 See table 2, note 2. The 2014 Home Mortgage Disclosure Act Data 15
  • 16. applications, collateral is more likely to be cited as a denial reason on conventional than nonconventional applications. For refinance applications, the DTI ratio is more likely to be cited as a denial reason on conventional than nonconventional applications. Table 6. Reasons for denial, by purpose of loan, 2014 Percent Type of loan and race and ethnicity of borrower Debt-to- income ratio Employ- ment history Credit history Collateral Insuf- ficient cash Unveri- fiable infor- mation Credit applica- tion incom- plete Mortgage insurance denied Other No reason given A. Home purchase Conventional and nonconventional1 All applicants 23.1 3.7 22.2 12.9 6.5 5.2 9.5 .6 10.5 25.2 Asian 28.3 4.7 13.5 12.0 7.6 8.7 13.5 .6 11.4 20.5 Black or African American 25.1 2.9 28.2 9.6 7.3 4.6 6.9 .6 10.0 27.3 Hispanic white 25.0 3.9 20.8 11.1 6.6 5.8 6.8 .5 12.0 28.4 Non-Hispanic white 21.9 3.8 21.8 14.1 6.2 4.9 9.8 .7 10.3 25.2 Other minority2 23.6 3.4 26.6 9.7 7.3 5.3 7.0 .7 11.3 26.6 Conventional only All applicants 23.7 3.2 20.9 15.0 7.2 5.6 10.8 1.0 10.2 22.7 Asian 28.1 4.5 11.8 12.8 8.1 9.1 14.9 .7 11.3 19.4 Black or African American 24.5 2.2 32.2 12.1 8.5 4.3 6.9 1.4 10.1 23.4 Hispanic white 25.4 3.1 22.1 13.8 7.6 6.1 7.5 1.0 12.5 24.1 Non-Hispanic white 23.0 3.3 20.1 16.2 6.8 5.3 11.0 1.0 9.6 23.0 Other minority2 24.0 3.4 26.7 10.1 8.0 6.0 7.6 1.0 11.2 25.8 Nonconventional only1 All applicants 22.3 4.3 23.8 10.3 5.6 4.7 7.9 .1 11.0 28.5 Asian 29.0 5.2 20.0 9.2 5.8 7.3 7.9 .1 11.8 24.8 Black or African American 25.5 3.3 25.9 8.2 6.6 4.8 6.8 .1 10.0 29.5 Hispanic white 24.8 4.5 19.9 9.2 5.8 5.7 6.2 .2 11.6 31.5 Non-Hispanic white 20.4 4.6 24.2 11.1 5.3 4.4 8.1 .2 11.3 28.3 Other minority2 23.1 3.4 26.5 9.2 6.6 4.6 6.4 .4 11.3 27.4 B. Refinance Conventional and nonconventional1 All applicants 15.8 1.0 18.4 15.3 2.9 3.0 10.4 .1 8.1 36.5 Asian 25.4 1.6 15.3 12.3 3.3 5.3 10.0 .2 9.7 31.3 Black or African American 11.5 .5 20.0 12.8 3.3 2.0 7.7 .1 7.6 44.9 Hispanic white 19.4 1.0 20.6 11.4 3.6 3.6 7.7 .2 9.5 36.2 Non-Hispanic white 15.9 1.0 17.8 16.3 2.8 3.0 10.4 .1 8.0 35.9 Other minority2 16.4 .7 18.9 12.2 3.0 2.9 7.7 .1 8.3 41.1 Conventional only All applicants 18.7 1.1 19.8 15.7 2.8 3.4 10.3 .2 8.2 32.8 Asian 27.1 1.7 15.4 12.7 3.3 5.6 10.0 .2 9.8 29.3 Black or African American 14.6 .6 23.0 12.9 2.7 2.2 7.6 .2 7.1 41.0 Hispanic white 21.7 1.0 21.5 11.8 3.4 3.8 7.5 .2 9.0 34.4 Non-Hispanic white 18.5 1.1 19.1 16.7 2.7 3.3 10.3 .2 8.1 32.4 Other minority2 19.8 .8 21.2 12.5 2.9 3.2 7.8 .1 8.7 35.9 Nonconventional only1 All applicants 7.0 .7 14.0 14.1 3.3 2.0 10.7 .03 7.7 47.7 Asian 11.5 1.0 14.7 9.4 3.1 3.2 9.7 .05 9.3 47.5 Black or African American 6.2 .4 15.2 12.7 4.2 1.7 7.7 .01 8.3 51.3 Hispanic white 10.1 .9 17.1 9.7 4.8 2.7 8.6 .05 11.5 43.1 Non-Hispanic white 7.0 .7 13.4 15.0 3.1 2.0 10.7 .03 7.6 47.6 Other minority2 7.8 .4 13.3 11.6 3.4 2.1 7.6 .03 7.2 54.4 Note: Denied first-lien mortgage applications for one- to four-family, owner-occupied, site-built homes. Columns sum to more than 100 because lenders may report up to three denial reasons. For a description of how borrowers are categorized by race and ethnicity, see table 2, note 1. 1 See table 5, note 1. 2 See table 2, note 2. 16 Federal Reserve Bulletin | November 2015
  • 17. Denial reasons vary across racial and ethnic groups to some degree. For example, among denied home-purchase loan applications in 2014, credit history was cited as a denial reason for 28 percent of denied black applicants, 21 percent of denied Hispanic white applicants, 22 percent of denied non-Hispanic white applicants, and just 13 percent of denied Asian applicants. The DTI ratio was cited most often as a denial reason for Asian home-purchase applicants at 28 percent, compared with 22 percent for non-Hispanic white applicants at the lower end. Finally, collateral was cited most often as a denial reason on home-purchase applications for non-Hispanic white applicants at 14 percent, compared with 10 percent for black applicants. The Incidence of Higher-Priced Lending Current price-reporting rules under HMDA, in effect since October 2009, define higher- priced first-lien loans as those with an annual percentage rate (APR) of at least 1.5 percent- age points above the average prime offer rate (APOR) for loans of a similar type (for example, a 30-year fixed-rate mortgage).29 The spread for junior-lien loans must be at least 3.5 percentage points for such loans to be considered higher priced. The APOR, which is published weekly by the Federal Financial Institutions Examination Council, is an estimate of the APR on loans being offered to high-quality prime borrowers based on the contract interest rates and discount points reported by Freddie Mac in its Primary Mortgage Market Survey.30 In 2014, the fraction of home-purchase loans (again, first liens for one- to four-family, owner-occupied, site-built properties) above the higher-priced threshold increased to 11.5 percent from 7.1 percent in 2013 (table 7.A). This increase stemmed from a rise in the higher-priced share of nonconventional loans from 13.8 percent to 26 percent, while the higher-priced share of conventional loans increased only slightly, from 2.9 percent to 3.1 percent. The higher-priced fraction of FHA home-purchase loans spiked from about 5 percent in early 2013 to about 40 percent after May 2013 and continued at monthly rates between 35 and 52 percent through 2014, for an annual average incidence of about 44 percent in 2014 (table 8). In contrast, less than 1 percent of VA and FSA/RHS home-purchase loans were higher priced in 2014. Increases in the FHA’s MIP and the term length over which it must be paid appear to have pushed many FHA home-purchase loans just over the report- ing threshold; as shown in table 8, over 75 percent of higher-priced FHA home-purchase loans were within 0.5 percentage point of the higher-priced threshold. With the FHA reducing the MIP by 0.5 percentage point in January 2015, the fraction of FHA borrowers above the reporting threshold may fall in next year’s data. There was a smaller increase in the higher-priced fraction of refinance mortgages—to 3.3 percent from 1.9 percent in 2013 (as shown in table 7.A). This increase was also largely driven by the higher-priced share of FHA refinance loans, which rose to 15.7 percent from 6.2 percent in 2013. Table 7.A also shows that, in 2014 as well as earlier years, black and Hispanic white bor- rowers had the highest incidences of higher-priced loans within both the conventional and 29 For more information about the rule changes related to higher-priced lending and the ways in which they affect the incidence of reported higher-priced lending over time, see Avery and others, “The 2009 HMDA Data,” in note 11. 30 See Freddie Mac, “Mortgage Rates Survey,” webpage, www.freddiemac.com/pmms; and Federal Financial Institutions Examination Council, “FFIEC Rate Spread Calculator,” webpage, www.ffiec.gov/ratespread/ newcalc.aspx. The 2014 Home Mortgage Disclosure Act Data 17
  • 18. nonconventional loan types. The table provides the raw rates of higher-priced lending by group from 2004 to 2014, but, as discussed in detail in previous Bulletin articles, the raw rates reported in the public HMDA data can be difficult to compare over longer time hori- zons for two main reasons. First, a different price-reporting rule was in place prior to Octo- ber 2009, with the spread between a mortgage’s APR and the rate on a Treasury bond of Table 7. Incidence of higher-priced lending, by purpose of loan, 2004–14 A. Unadjusted Percent Type of loan and race and ethnicity of borrower 2004 2005 2006 2007 2008 2009 2010 2011 2012 2013 2014 Home purchase Conventional and nonconventional1 All borrowers 9.8 22.5 23.2 12.7 8.1 4.6 2.2 3.3 3.1 7.1 11.5 Asian 5.5 16.3 16.4 7.6 4.0 2.4 1.0 1.5 1.4 3.0 5.1 Black or African American 24.3 46.7 46.4 27.6 14.5 7.1 3.0 5.0 5.3 14.2 25.5 Hispanic white 17.5 42.0 43.3 25.9 15.8 8.1 3.9 6.1 5.9 16.8 28.3 Non-Hispanic white 7.8 15.5 16.0 9.6 7.2 4.3 2.2 3.1 2.9 6.1 9.4 Other minority2 14.4 30.3 30.7 16.1 9.1 5.3 2.3 3.5 3.4 8.7 13.5 Conventional only All borrowers 11.0 24.5 25.3 14.0 7.3 4.6 3.3 3.8 3.2 2.9 3.1 Asian 5.6 16.6 16.7 7.7 3.3 1.9 1.0 1.3 1.2 1.1 1.5 Black or African American 30.6 54.1 53.4 34.0 17.4 8.7 6.1 8.0 6.7 6.1 7.7 Hispanic white 20.0 45.3 46.3 28.9 17.7 11.0 9.6 10.7 8.7 7.3 6.5 Non-Hispanic white 8.6 16.9 17.5 10.5 6.5 4.8 3.4 3.9 3.2 2.9 3.0 Other minority2 16.1 33.3 33.6 18.5 9.5 6.7 4.6 5.5 5.1 4.9 5.0 Nonconventional only1 All borrowers 1.2 .9 1.8 3.0 9.5 4.6 1.3 2.7 3.0 13.8 26.0 Asian 2.4 .6 .8 1.3 8.2 3.9 .8 2.0 1.9 13.1 26.0 Black or African American 1.4 1.6 2.5 4.5 12.8 6.8 2.4 4.3 4.9 17.6 33.8 Hispanic white 2.0 1.4 3.5 4.5 14.0 7.1 2.2 4.5 4.8 22.4 43.0 Non-Hispanic white 1.0 .7 1.5 2.5 8.4 3.9 1.0 2.3 2.6 12.0 22.2 Other minority2 4.4 .7 2.1 2.4 8.8 4.7 1.2 2.5 2.4 11.7 20.7 Refinance Conventional and nonconventional1 All borrowers 14.5 25.0 30.3 21.0 10.9 3.8 1.8 2.1 1.5 1.9 3.3 Asian 5.8 15.1 19.5 12.5 3.1 .9 .4 .5 .4 .5 1.1 Black or African American 30.0 46.2 50.7 38.1 22.8 9.0 6.5 6.8 4.1 3.8 5.7 Hispanic white 18.2 32.6 36.9 26.5 15.1 7.0 4.4 4.4 2.6 3.1 4.8 Non-Hispanic white 12.3 20.4 25.0 17.6 10.2 3.7 1.8 2.2 1.5 2.0 3.3 Other minority2 17.6 26.9 32.3 23.8 13.9 4.7 2.6 2.6 2.0 2.2 3.0 Conventional only All borrowers 15.2 25.7 31.0 21.8 10.4 3.1 1.3 1.5 1.2 1.5 2.2 Asian 5.8 15.2 19.6 12.5 2.9 .7 .2 .3 .3 .3 .7 Black or African American 33.7 49.0 52.8 41.5 27.6 9.9 4.0 4.2 2.9 3.3 4.1 Hispanic white 19.2 33.4 37.5 27.3 16.0 7.2 3.3 3.3 2.3 2.4 2.8 Non-Hispanic white 12.8 20.9 25.6 18.2 9.8 3.1 1.3 1.6 1.2 1.6 2.4 Other minority2 18.2 27.7 32.9 24.5 14.7 4.8 1.9 2.2 1.7 2.0 2.2 Nonconventional only1 All borrowers 1.5 .9 3.1 6.6 13.2 6.7 4.9 5.9 3.2 3.9 7.9 Asian 3.6 2.1 2.5 4.9 8.9 4.8 3.1 4.0 1.8 2.6 6.8 Black or African American 1.0 1.2 4.1 7.8 15.2 8.2 9.8 10.9 6.0 4.6 8.1 Hispanic white 2.0 .9 2.6 6.2 11.6 6.6 7.3 7.9 3.6 5.1 11.8 Non-Hispanic white 1.3 .7 2.8 6.0 12.1 6.5 4.6 5.9 3.3 4.2 8.3 Other minority2 8.1 3.9 9.6 9.9 10.5 4.5 4.6 4.3 2.9 2.9 5.2 Note: First-lien mortgages for one- to four-family, owner-occupied, site-built homes. For a description of how borrowers are categorized by race and ethnicity, see table 2, note 1. 1 See table 5, note 1. 2 See table 2, note 2. 18 Federal Reserve Bulletin | November 2015
  • 19. comparable term (rather than the APOR) reported if it rose above 3 percentage points.31 Second, the previous price-reporting rule created unintended distortions in reporting over 31 The reporting threshold for junior liens was 5 percentage points. Table 7. Incidence of higher-priced lending, by purpose of loan, 2004–14 B. Adjusted Percent Type of loan and race and ethnicity of borrower 2004 2005 2006 2007 2008 2009 2010 2011 2012 2013 2014 Home purchase Conventional and nonconventional1 All borrowers 7.4 18.3 17.1 6.3 1.3 1.3 .6 .8 .8 .7 .8 Asian 3.8 13.0 11.4 3.1 .5 .5 .3 .3 .3 .3 .4 Black or African American 19.3 40.3 38.5 16.7 1.9 1.3 .6 .7 .9 1.1 1.2 Hispanic white 12.3 34.5 32.8 13.0 2.1 1.4 1.0 1.3 1.6 1.6 1.6 Non-Hispanic white 5.8 12.1 10.9 4.3 1.3 1.4 .7 .8 .8 .7 .7 Other minority2 10.5 24.7 22.7 8.0 1.5 1.4 .8 .9 1.1 .9 .9 Conventional only All borrowers 8.2 20.0 18.7 7.1 1.9 2.3 1.3 1.4 1.2 .9 .8 Asian 3.8 13.3 11.6 3.2 .5 .6 .3 .4 .4 .3 .4 Black or African American 24.4 46.9 44.5 21.2 4.7 4.0 2.6 2.6 2.7 1.8 1.4 Hispanic white 14.0 37.2 35.2 14.8 3.9 4.6 3.9 4.1 4.5 2.8 2.3 Non-Hispanic white 6.5 13.2 12.0 4.9 1.9 2.6 1.3 1.5 1.2 .8 .7 Other minority2 11.6 27.2 25.0 9.3 2.7 3.7 2.3 2.5 2.6 1.7 1.3 Nonconventional only1 All borrowers .9 .3 .2 .3 .4 .4 .1 .2 .3 .5 .7 Asian 2.2 .3 .1 .2 .2 .2 .1 .2 .2 .3 .4 Black or African American 1.0 .5 .3 .6 .4 .7 .2 .3 .3 .8 1.1 Hispanic white 1.6 .3 .3 .2 .5 .4 .1 .3 .3 .8 1.1 Non-Hispanic white .8 .2 .2 .2 .3 .3 .1 .2 .3 .5 .7 Other minority2 3.9 .3 .2 .2 .3 .3 .1 .1 .2 .3 .6 Refinance Conventional and nonconventional1 All borrowers 11.3 20.1 21.3 12.7 4.3 1.4 .6 .8 .7 .7 1.0 Asian 4.1 12.2 12.1 5.4 .8 .2 .1 .2 .1 .1 .2 Black or African American 24.3 38.5 39.0 26.4 10.6 3.5 2.6 3.3 2.5 1.6 2.0 Hispanic white 13.4 27.0 25.8 14.8 5.6 2.5 1.8 1.8 1.1 .9 1.0 Non-Hispanic white 9.5 15.9 16.9 10.3 4.1 1.4 .6 .8 .7 .7 1.1 Other minority2 13.2 22.0 22.3 14.5 7.1 2.1 .9 1.1 1.1 .8 .9 Conventional only All borrowers 11.8 20.7 21.9 13.3 5.1 1.5 .5 .6 .4 .4 .7 Asian 4.1 12.3 12.1 5.4 .9 .2 .1 .1 0 0 .1 Black or African American 27.3 40.8 40.7 29.4 17.1 6.3 2.0 1.8 1.0 1.0 1.4 Hispanic white 14.1 27.7 26.2 15.4 6.9 3.5 1.4 1.3 .8 .7 .8 Non-Hispanic white 9.9 16.3 17.3 10.9 4.8 1.6 .5 .6 .4 .5 .8 Other minority2 13.6 22.6 22.7 14.9 8.3 2.8 .9 .9 .7 .7 .7 Nonconventional only1 All borrowers 1.0 .6 .7 .5 .4 .5 1.2 2.5 2.4 1.8 2.1 Asian 2.9 1.8 1.3 1.4 .5 .3 .5 1.5 1.4 1.1 1.6 Black or African American .6 .8 1.2 .6 .5 1.1 3.5 5.9 4.9 2.6 2.8 Hispanic white 1.4 .4 .3 .6 .7 .8 2.8 3.5 1.9 1.3 1.7 Non-Hispanic white .8 .4 .4 .3 .4 .5 1.0 2.4 2.5 2.1 2.5 Other minority2 6.3 3.4 7.8 6.3 1.9 .4 1.1 2.0 2.2 1.3 1.5 Note: First-lien mortgages for one- to four-family, owner-occupied, site-built homes. For a description of how borrowers are categorized by race and ethnicity, see table 2, note 1. See text for details on how adjusted incidences of higher-priced lending are calculated. 1 See table 5, note 1. 2 See table 2, note 2. The 2014 Home Mortgage Disclosure Act Data 19
  • 20. time (which is why the reporting rule was changed), so data from years prior to 2009 are not even directly comparable from year to year.32 Table 7.B provides adjusted rates of higher-priced lending that are intended to be more comparable over time. Using the dates of application and origination (which are not released in the public HMDA data files) and assuming all loans are 30-year fixed-rate mortgages, we can estimate the APR of loans that were originated under the old pricing rule.33 This estimated APR can then be compared with the APOR, as is done under the new price-reporting rule. Finally, because the implied threshold spread over the APOR dur- ing the previous reporting regime got to as high as about 2.5 percentage points, table 7.B reports the fraction of loans with an estimated APR spread over the APOR (or the actual reported spread for loans made under the new rules) of at least 2.5 percentage points— 32 These distortions are related to the fact that changes in long-term Treasury rates do not always lead to parallel changes in mortgage rates. For a discussion of how the old rule could produce misleading data about trends in higher-priced lending, see Neil Bhutta and Daniel R. Ringo (2014), “The 2013 Home Mortgage Disclosure Act Data,” Federal Reserve Bulletin, vol. 100 (November), pp. 1–32, www.federalreserve.gov/pubs/bulletin/2014/ default.htm. 33 The assumption that all mortgages were fixed rate likely understates the extent of higher-priced lending during the early years of the housing boom. During this period, adjustable-rate mortgages were quite prevalent, and the APRs on such loans are tied to even shorter-term Treasury rates than fixed-rate mortgages. Thus, when the yield curve is relatively steep, as it was in 2004, the bar for adjustable-rate mortgages to be reported as higher priced would have been even higher than for fixed-rate mortgages. Table 8. Distribution of price spread, 2014 Percent except as noted Purpose and type of loan Total number Loans with APOR spread above 1.5 percentage points1 Number Percent Distribution, by percentage points of APOR spread 1.5–1.99 2–2.49 2.5–2.99 3–3.99 4–4.99 5 or more Site-built homes Home purchase Conventional 1,735,766 53,654 3.1 56.3 18.5 10.8 8.6 3.1 2.6 FHA2 583,539 258,647 44.3 76.2 21.0 2.1 .6 .03 .05 VA/RHS/FSA3 417,201 1,538 .4 79.5 12.9 1.4 .9 3.1 2.3 Refinance Conventional 1,561,325 34,546 2.2 48.1 19.8 11.3 11.8 5.0 4.1 FHA2 170,306 26,675 15.7 58.0 13.8 6.0 19.6 1.5 1.1 VA/RHS/FSA3 189,626 1,745 .9 88.6 1.0 2.0 1.2 6.2 1.1 Manufactured homes Home purchase Conventional 50,957 39,193 76.9 6.1 4.7 6.8 13.7 12.9 55.8 FHA2 12,231 8,163 66.7 53.4 31.3 7.0 4.0 4.3 .01 VA/RHS/FSA3 4,012 46 1.2 87.0 10.9 0 2 0 .01 Refinance Conventional 20,405 6,147 30.1 20.6 14.7 14.0 21.9 12.4 16.4 FHA2 5,009 1,034 20.6 60.1 21.3 6.3 11.5 .7 .2 VA/RHS/FSA3 3,162 25 .8 84.0 12 0 0 4 0 Note: First-lien mortgages for one- to four-family owner-occupied homes. 1 Average prime offer rate (APOR) spread is the difference between the annual percentage rate on the loan and the APOR for loans of a similar type published weekly by the Federal Financial Institutions Examination Council. The threshold for first-lien loans is a spread of 1.5 percentage points. 2 Loans insured by the Federal Housing Administration. 3 Loans backed by guarantees from the U.S. Department of Veterans Affairs, the Rural Housing Service, or the Farm Service Agency. 20 Federal Reserve Bulletin | November 2015
  • 21. rather than 1.5 percentage points, as in table 7.A.34 Higher-priced lending by this measure virtually disappeared by 2008 and has not reemerged, likely reflecting the lack of subprime mortgage lending. Regulatory Changes Several significant changes to the regulation of the mortgage market took place in 2014. This section briefly discusses the new rules and analyzes some possible effects of these new rules. Ability-to-Repay and Qualified Mortgage Rules On January 10, 2014, the CFPB’s final ATR and QM rules, pursuant to the Dodd-Frank Wall Street Reform and Consumer Protection Act of 2010, went into effect. To help ensure that lenders make a reasonable, good faith determination that borrowers will be able to repay their mortgage loans, the new ATR rules require lenders to meet minimum under- writing standards, such as considering and verifying a mortgage applicant’s assets or income, debt load, and credit history for most closed-end residential mortgage loans. Bor- rowers may allege a violation of the ATR requirement within three years of the date of violation or use a violation of the ATR requirement as a defense to foreclosure for the life of the loan. Lenders that are found to violate the ATR rules can be liable for monetary damages. Lenders are presumed to comply with the ATR requirement when they make a QM loan, which must meet further underwriting and pricing standards.35 These requirements gener- ally include a limit on points and fees to 3 percent of the loan amount and various restrictions on loan terms and features (for example, no negative amortization or interest- only payments and a loan term of 30 years or less).36 QM loans also generally require that the borrower’s total DTI ratio does not exceed 43 percent. However, currently, the 43 per- cent DTI cap does not apply to FHA, VA, FSA, and RHS loans, loans that are eligible for purchase by the GSEs, and portfolio loans made by small creditors. The HMDA data can provide some insight into whether these new rules had an effect on credit availability, although they are an imperfect resource. For example, if the new rules discouraged lending to riskier borrowers, they could have led to a significant reduction in the share of loans to minority and LMI borrowers, who tend to have lower assets and credit scores and higher DTI ratios.37 However, as discussed earlier, black and Hispanic 34 For a more detailed discussion of this adjustment technique, see Avery and others, “The 2009 HMDA Data,” in note 11. 35 In fact, there are two levels of legal protection: a “safe harbor” (that is, a conclusive presumption of compli- ance) for QM loans that are not higher priced (first liens with an APR that is less than 1.5 percentage points above the APOR or junior liens with an APR that is less than 3.5 percentage points above the APOR) and a “rebuttable presumption of compliance” for QM loans that are higher priced. For FHA loans, the safe har- bor is given to loans with APRs that are equal to or less than 1.15 percentage points plus the ongoing MIP over the APOR. Most VA loans have safe-harbor status regardless of the APR. The safe-harbor price threshold also differs for small creditors. 36 For information on how the terms “points and fees” and “loan amount” are defined for the purposes of QMs and other guidance on the rules, see Consumer Financial Protection Bureau (2014), Ability-to-Repay and Quali- fied Mortgage Rule: Small Entity Compliance Guide (Washington: CFPB, November 3), http://files .consumerfinance.gov/f/201411_cfpb_atr-qm_small-entity-compliance-guide.pdf. 37 For data on credit scores and DTI ratios by borrower race and income, see Neil Bhutta and Glenn B. Canner (2013), “Mortgage Market Conditions and Borrower Outcomes: Evidence from the 2012 HMDA Data and Matched HMDA–Credit Record Data,” Federal Reserve Bulletin, vol. 99 (November), pp. 1–58, www.federalreserve.gov/pubs/bulletin/2013/default.htm. The 2014 Home Mortgage Disclosure Act Data 21
  • 22. white borrowers’ share of home-purchase loans increased in 2014 after having declined for several years. In addition, if the QM cap on the DTI ratio for conventional non-GSE loans was binding, there could have been a significant increase in the frequency at which lenders cited the DTI ratio as a reason for denial. However, there was little change in this fre- quency.38 Also, as will be discussed later, jumbo home-purchase loans, which are not eli- gible for GSE purchase and would be subject to the DTI cap to qualify as QMs, grew much more rapidly than other home-purchase loans. To explore further, this section examines whether the rules may have curbed high-DTI loans. The HMDA data do not provide all of the information necessary to calculate DTI ratios, so we cannot directly measure how the frequency of loans with DTI ratios in excess of 43 percent has changed with the introduction of the ATR and QM rules. Other debts, such as auto loans and student loans, are added to monthly mortgage obligations in the numerator of the DTI calculation. The term of the loan, which is not reported under HMDA, can also affect the DTI ratio, as a shorter term increases monthly mortgage pay- ments, holding all else equal. With these caveats in mind, we may still be able to glean some useful information on the extent of high-DTI lending. For each HMDA loan with a reported income, we estimate a “front end” DTI ratio based on the loan amount, income, origination date, and reported spread over the APOR. This approximate DTI ratio is the ratio of monthly mortgage pay- ment (principal and interest only) to income, assuming that the loan follows a 30-year fixed-rate structure, with all points and fees financed over the life of the loan. The interest rate is assumed to be the reported spread over the APOR plus the APOR taken from two weeks before the loan was originated. If the spread was below the reportable threshold, the interest rate is assumed to be the APOR plus 0.25 percentage point for conventional loans.39 For example, for a loan of $100,000 to a borrower with annual income of $50,000, an unreported spread, and the relevant APOR equal to 4 percent, the approximate DTI ratio would be 11.8 percent. Figure 6 displays the distributions of these approximate DTI ratios by demographic group in 2013 and 2014 (additional data are reported in table 9). The 2014 data are restricted to loans with an application date on or after January 10, 2014, the date when the ATR rules were implemented. Again, the estimated front-end DTI ratios are lower than the “back end” DTI ratios lenders actually use to assess the ATR and QM eligibility, which include other housing-related obligations, such as taxes and insurance, as well as nonmortgage debt payments. That said, if the ATR and QM rules were a significant deterrent to loans with a back-end DTI ratio above 43 percent, we might expect to see the upper percentiles of the estimated front-end DTI ratio decrease noticeably between 2013 and 2014. In fact, the dis- tributions look quite similar across the two years.40 Even for conventional jumbo loans, which are not eligible for purchase by the GSEs and therefore must have a DTI below 38 The frequency with which the DTI ratio was cited as a denial reason edged up to 23.1 percent from 22.1 percent in 2013 for denied home-purchase applications and dropped slightly to 15.8 percent from 16.6 percent for refi- nance denials. 39 The lack of data on spreads below the reporting threshold could mask some small changes in the distribution of DTI ratios between 2013 and 2014. In the absence of data on the true APRs, we assume a spread of 0.25 percentage point on conventional and VA loans to reflect the fact that interest rates near the prevailing prime rate are more common than those far from it. For FHA loans without a reported spread, we assume a spread of 1.35 percentage points for loans with an application date on or after April 1, 2013. For loans with an application date before April 1, 2013, we assume a spread of 1.25 percentage points for FHA home-purchase loans and a spread of 0.75 percentage point for FHA refinancings. These spreads reflect the typical MIP rates. FSA and RHS loans are assumed to have a spread of 0.5 percentage point if no spread is reported to match the guarantee fees. The approximate DTI ratios are capped at 51 percent, as extremely high values likely reflect misreported data. 40 As seen in table 9, the 90th and 95th percentiles of the approximate DTI ratio for refinance loans to LMI bor- 22 Federal Reserve Bulletin | November 2015
  • 23. 43 percent in order to be a QM, the estimated DTI ratios largely held steady between 2013 and 2014. A number of factors may help explain why the ATR and QM rules appear to have had little bite in 2014 relative to 2013. Since the financial crisis and through 2013, lenders have tight- ened standards, and most loans have been either GSE eligible or nonconventional; thus, most lending in 2013 may have already met the new ATR, if not QM, standards. Moreover, lenders may have adjusted to the new rules prior to the actual implementation date in 2014, reducing the differences between 2013 and 2014. At the same time, lenders making loans in 2013 that would not have been QM loans under the new rules may have been willing to continue doing so in 2014 despite some added legal risk. Still, it is important to recognize that we do not know how the market would have evolved in 2014 in the absence of the new rules. Perhaps in their absence, DTI ratios would have risen significantly. In addition, borrowers may have reduced nonmortgage debt, which we do not observe in the HMDA data, in response to the new rules. Thus, we cannot rule out that there was an effect on DTI ratios in 2014 relative to 2013. Furthermore, the ATR and QM rules could have affected other dimensions of the mortgage market that are not observed in the HMDA data, such as the use of low-documentation and interest-only loans. Finally, even if the rules had little effect in 2014, they may become more binding in the future if mortgage lenders and investors regain their appetite for risk. rowers did come down a little, but, for all home-purchase loans and most other groups in the refinance market, the upper percentiles either stayed the same or increased. Figure 6. Percentiles of approximate debt-to-income ratios for home-purchase mortgages, by borrower race, ethnicity, and income, 2013 and 2014 0 10 20 30 Percent 90th percentile 0 10 20 30 Percent 90th percentile 0 10 20 30 40 Percent 2013 20142013 2014 2013 2014 0 10 20 30 40 Asian Percent 99th percentile 2013 2014 99th percentile A. Race and ethnicity B. Income Non-Hispanic white Hispanic white Asian Non-Hispanic white Hispanic white Black or African American Black or African American HigherMiddleLow or moderate HigherMiddleLow or moderate 40 40 Note: The data are annual. First-lien home-purchase mortgages for one- to four-family, owner-occupied, site-built homes. The data for 2014 are restricted to loans with an application date on or after January 10, 2014. For definition of borrower race and ethnicity, see table 2, note 1. For explanation of borrower income, see table 2, note 3. The 2014 Home Mortgage Disclosure Act Data 23
  • 24. Table 9. Percentiles of estimated front-end debt-to-income ratios, by purpose of loan, 2013–14 Percent Characteristic of borrower and of neighborhood Percentile 2013 2014 50 75 90 95 99 50 75 90 95 99 A. Home purchase Borrower race and ethnicity1 Asian 19 24 30 33 38 19 25 30 33 38 Black or African American 18 23 27 30 35 18 23 28 31 36 Hispanic white 19 25 30 32 37 20 26 31 33 38 Non-Hispanic white 16 20 25 28 34 16 21 26 29 34 Other minority2 18 24 29 32 37 19 24 29 32 38 Joint 15 20 25 28 34 16 20 25 28 34 Missing 16 21 27 30 35 17 22 27 30 35 Borrower income3 Low or moderate 20 25 29 32 38 20 25 30 33 38 Middle 17 22 27 30 35 18 22 27 30 35 High 14 18 22 25 31 14 18 23 26 32 Neighborhood income4 Low or moderate 17 22 28 31 36 18 23 29 32 37 Middle 16 21 26 29 35 17 22 27 30 35 High 16 21 26 29 35 16 21 26 29 35 Income not used or not applicable 15 20 25 28 35 14 19 24 27 35 Memo Conventional jumbo loans5 17 23 28 31 38 18 23 28 31 37 All home-purchase loans 16 21 26 29 35 17 22 27 30 35 B. Refinance Borrower race and ethnicity1 Asian 16 21 28 32 51 18 24 29 33 45 Black or African American 13 19 26 32 51 14 20 26 32 51 Hispanic white 15 22 29 35 51 17 23 30 34 51 Non-Hispanic white 12 17 23 28 42 13 19 25 29 42 Other minority2 15 21 29 36 51 16 23 30 34 51 Joint 12 17 23 27 39 14 19 25 29 39 Missing 13 18 25 30 48 14 20 26 30 43 Borrower income3 Low or moderate 18 25 33 42 51 18 25 32 39 51 Middle 14 19 24 27 34 15 20 26 29 36 High 10 14 19 22 29 12 17 22 25 31 Neighborhood income4 Low or moderate 13 19 26 32 51 14 20 27 32 51 Middle 12 18 24 29 46 14 19 26 30 44 High 13 18 24 28 42 14 20 26 30 41 Income not used or not applicable 11 16 22 26 35 12 17 23 27 36 Memo Conventional jumbo loans5 17 23 29 33 43 18 24 29 33 41 All refinance loans 13 18 24 29 46 14 20 26 30 43 Note: First-lien mortgages for one- to four-family, owner-occupied, site-built homes. The data for 2014 are restricted to loans with an application date on or after January 10, 2014. See text for details on how the front-end debt-to-income ratio is estimated. 1 See table 2, note 1. 2 See table 2, note 2. 3 See table 2, note 3. 4 See table 2, note 4. 5 Jumbo loans are loans with amounts in excess of the single-family conforming loan-size limits for eligibility for purchase by the government-sponsored enterprises. 24 Federal Reserve Bulletin | November 2015
  • 25. HOEPA Loans Under HOEPA, certain types of mortgage loans that have interest rates or fees above speci- fied levels are subject to additional consumer protections, such as special disclosures and restrictions on loan features. New rules extending HOEPA’s protections from refinance and home equity loans to also include home-purchase loans and home equity lines of credit became effective on January 10, 2014. These rules also added new protections for high-cost mortgages, such as a pre-loan counseling requirement for borrowers. The new rules also changed the benchmark used to identify high-cost loans that are cov- ered by HOEPA’s protections. Instead of using the yield on Treasury securities, high-cost loans are identified by comparing a loan’s APR with the APOR. HOEPA coverage now applies to first liens with an APR more than 6.5 percentage points above the APOR. If the loan is a junior lien or the loan amount is less than $50,000 and is secured by personal property (such as a manufactured home), then the high-cost threshold is 8.5 percentage points above the APOR. Prior to 2014, HOEPA’s protections were triggered if the loan’s APR exceeded 8 percentage points above the rate on a Treasury security of similar term for first liens, and 10 percentage points for junior liens. Finally, under the new rules, HOEPA coverage is also triggered if the points and fees exceed certain thresholds.41 While HOEPA loans were never a large fraction of the mortgage market, they have become even rarer since the housing boom. In 2005, lenders reported nearly 36,000 HOEPA loans (table 10). In 2014, the total was 1,262 loans, down from 1,873 in 2013 despite the addi- tional coverage of home-purchase loans. While HOEPA loans were quite rare in 2014, mortgages with an APR near to, but below, the triggering threshold were somewhat more common. Figure 7 plots the frequency of first-lien mortgages for owner-occupied properties against the spread over the APOR in a 41 Under the new rules, a loan is also considered high cost if the points and fees exceed 5 percent of the total loan amount for a loan equal to or more than $20,000 and 8 percent of the total loan amount or $1,000 for a loan less than $20,000, with the loan amounts adjusted annually for inflation. Table 10. Distribution of HOEPA loans, by characteristic of loan, 2004–14 Percent except as noted Loans by purpose, lien status, property type, and amount 2004 2005 2006 2007 2008 2009 2010 2011 2012 2013 2014 HOEPA loans (total) 24,437 35,985 15,195 10,780 8,577 6,446 3,407 2,373 2,193 1,873 1,262 Loan purpose Home purchase 0 0 0 0 0 0 0 0 0 0 31.8 Home improvement 37.7 26.1 42.4 45.4 30.5 31.1 32.6 32.3 31.5 30.1 18.0 Refinance 62.3 73.9 57.6 54.6 69.5 68.9 67.4 67.7 68.5 69.9 50.2 Lien status First 55.5 60.5 53.6 52.8 78.5 84.1 83.9 82.8 84.6 84.0 91.6 Junior 44.5 39.5 46.4 47.2 21.5 15.9 16.1 17.2 15.4 16.0 8.4 Property type Site built 88.0 91.8 83.7 81.0 72.7 67.8 68.3 65.7 65.7 69.1 75.2 Manufactured home 12.0 8.2 16.3 19.0 27.3 32.2 31.7 34.3 34.3 30.9 24.8 Loan amount Less than $50,000 72.4 48.4 72.1 74.3 66.7 72.5 76.5 77.8 75.6 71.0 53.2 Greater than $50,000 27.6 51.6 27.9 25.7 33.3 27.5 23.5 22.2 24.4 29.0 46.8 Note: Mortgages for one- to four-family owner-occupied homes. HOEPA loans are mortgages with terms that triggered the additional protections provided by the Home Ownership and Equity Protection Act. The 2014 Home Mortgage Disclosure Act Data 25
  • 26. 1 percentage point range around the HOEPA triggering threshold. The top panel combines loans of $50,000 or more for manufactured homes with all loans for site-built homes, as these loans all have a HOEPA threshold of 6.5 percent- age points. The bottom panel pres- ents the frequency of loans less than $50,000 for manufactured homes, which trigger HOEPA pro- tections if the APR is more than 8.5 percentage points above the APOR. In both panels, the values from 2013 are plotted for compari- son, as the APOR-based definition of high-cost mortgages was not in use then. In both panels, the 2014 plots are restricted to loans with an application date on or after Janu- ary 10, 2014, when the new rule went into effect. Both panels show a precipitous drop in the number of loans originated in 2014 at the HOEPA price threshold, whereas for 2013—before the new threshold rules took effect—no such disconti- nuity was evident. This pattern suggests that HOEPA discouraged lending above the price thresholds, but the mechanism by which the market responds to HOEPA is unclear. One possibility is that lenders reduce the APR on their offers to push the loan under the threshold, which would imply a benefit to consum- ers in the form of a lower price. Another possibility is that, rather than adjusting prices, lenders denied applications they would have accepted in the absence of HOEPA. In this case, consumers may or may not benefit from the law. Finally, prospective borrowers may have chosen to reject high-cost offers when presented with the additional HOEPA dis- closures. Further research is needed to understand the relative importance of each of these mechanisms. Lending Institutions In 2014, there were 7,062 reporting institutions (table 11). The total consisted of 4,118 banks and thrifts (hereafter, banks), of which 3,367 were small, defined as having assets of less than $1 billion; 1,984 credit unions; 139 mortgage companies affiliated with deposito- ries (banks and credit unions); and 821 independent mortgage companies.42 Banks collec- 42 Data on bank assets were drawn from the Federal Deposit Insurance Corporation Reports of Condition and Income. The $1 billion threshold is based on the combined assets of all banks within a given banking organiza- tion. Data available in the HMDA Reporter Panel can be used to help identify the various types of institutions. Affiliate institutions include all mortgage companies known to be wholly or partially owned by a depository— Figure 7. Number of originations near HOEPA spread thresholds, 2013 and 2014 0 200 400 600 800 1,000 1,200 Number of loans A. Manufactured and loan amount ≥ $50,000 or site built 0 100 200 300 400 500 600 700 Number of loans Spread over the APOR (percentage points) Spread over the APOR (percentage points) B. Manufactured and loan amount < $50,000 2013 2014 2013 2014 8.05 8.15 8.25 8.35 8.45 8.55 8.65 8.75 8.85 8.95 6.05 6.15 6.25 6.35 6.45 6.55 6.65 6.75 6.85 6.95 Note: The data are annual. First-lien mortgage originations for owner-occupied properties clustered into bins of 0.05 percentage point. The data for 2014 are restricted to loans with an application date on or after January 10, 2014. HOEPA is Home Ownership and Equity Protection Act; APOR is average prime offer rate. 26 Federal Reserve Bulletin | November 2015
  • 27. tively accounted for about 45 percent of all reported mortgage originations; independent mortgage companies, about 40 percent; credit unions, over 9 percent; and affiliates, the remainder. Many institutions report little activity. About 48 percent of institutions (3,360 out of 7,062) reported fewer than 100 mortgage originations in 2014, accounting for about 136,000 origi- nations, or 2 percent of all originations. About 17 percent of institutions originated fewer than 25 loans, in total accounting for about one-fourth of 1 percent of all originations. that is, institutions for which the “other lender code” in the Reporter Panel equals 1, 2, or 5. All credit unions report to the National Credit Union Administration except four large credit unions (Boeing Employees Credit Union, Navy Federal Credit Union, Pentagon Federal Credit Union, and State Employees Credit Union), which report to the CFPB. Table 11. Lending activity, by type of institution, 2014 Percent except as noted Institutions and type of activity Type of institution1 Small bank Large bank Credit union Affiliated mortgage company Independent mortgage company All Number of institutions 3,367 751 1,984 139 821 7,062 Applications (thousands) 787 3,616 909 501 4,119 9,933 Originations (thousands) 558 2,161 545 313 2,403 5,980 Purchases (thousands) 26 1,061 12 172 481 1,752 Number of institutions with fewer than 100 loans 1,935 149 1,150 38 88 3,360 Originations (thousands) 79.3 6.7 44.5 1.6 3.4 135.5 Number of institutions with fewer than 25 loans 667 45 443 16 41 1,212 Originations (thousands) 8.2 .6 5.2 .2 .5 14.7 Home-purchase loans (thousands)2 220 869 172 189 1,288 2,737 Conventional 73.8 74.3 86.8 58.9 51.9 63.4 Higher-priced share of conventional loans 11.3 1.7 8.9 1.0 1.5 3.1 LMI borrower3 28.9 23.5 26.1 30.1 28.8 27.0 LMI neighborhood4 11.9 11.8 12.7 12.6 14.7 13.3 Non-Hispanic white5 81.3 69.9 70.7 71.0 65.9 69.1 Minority borrower5 11.8 17.8 14.4 16.8 22.6 19.3 Sold6 70.6 72.7 43.7 97.3 97.6 84.1 Refinance loans (thousands)2 119 723 177 86 816 1,921 Conventional 85.7 90.6 96.4 80.2 69.2 81.3 Higher-priced share of conventional loans 11.3 1.5 3.5 .8 1.2 2.2 LMI borrower3 22.5 23.5 24.6 21.1 20.6 22.2 LMI neighborhood4 11.3 12.8 13.9 12.0 13.6 13.1 Non-Hispanic white5 84.2 68.8 71.2 68.3 63.7 67.8 Minority borrower5 8.2 17.1 14.6 17.1 18.2 16.8 Sold6 58.0 72.6 29.8 96.4 98.4 79.4 1 Small banks consist of those banks with assets (including the assets of all other banks in the same banking organization) of less than $1 billion at the end of 2013. Large banks are all other banks. Affiliated mortgage companies are nondepository mortgage companies owned by or affiliated with a banking organization or credit union. 2 First-lien mortgages for one-to-four family, owner-occupied, site-built homes. 3 See table 2, note 3. 4 See table 2, note 4. 5 See table 2, note 1. “Minority borrower” refers to nonwhite (excluding joint or missing) or Hispanic white applicants. 6 Excludes originations made in the last quarter of the year because the incidence of loan sales tends to decline for loans originated toward the end of the year, as lenders report a loan as sold only if the sale occurs within the same year as origination. Source: FFIEC HMDA data; bank asset data drawn from Federal Deposit Insurance Corporation Reports of Condition and Income. The 2014 Home Mortgage Disclosure Act Data 27
  • 28. Table 11 provides several other statistics to help compare the lending patterns of different types of institutions in 2014, and we discuss some highlights here. First, depositories tend to originate a significantly higher fraction of conventional loans than nondepositories. As will be seen in the next section, this difference holds historically as well. Second, in 2014, small banks and credit unions accounted for a highly disproportionate share of conventional higher-priced loans. Over 11 percent of conventional home-purchase loans for one- to four-family, owner-occupied, site-built properties originated by small banks were higher priced, as were nearly 9 percent of such loans originated by credit unions. In contrast, less than 2 percent of such loans originated by other types of institu- tions were higher priced. The numbers for both home-purchase and refinance lending imply that, even though small banks and credit unions accounted for less than 18 percent of conventional home-purchase and refinance loans, they originated over 55 percent of conventional higher-priced loans. Interestingly, further analysis indicates that these differ- ences in higher-priced lending hold, on average, even when comparing small banks and credit unions to other lenders operating in the same county. Notably, under the new QM rules, higher-priced conventional QM loans will have a rebut- table presumption of compliance with the ATR rules, as opposed to a conclusive presump- tion of compliance (that is, a safe harbor), unless the loan is originated by a small creditor, in which case the safe-harbor APR threshold is 3.5 percentage points over the APOR rather than 1.5 percentage points.43 Many small banks and credit unions may fit the small creditor definition, and over 85 percent of the higher-priced loans originated by these insti- tutions had APOR spreads of less than 3.5 percentage points. Thus, many of these higher- priced loans may have safe-harbor status if they satisfy all of the other QM criteria. Third, small banks and credit unions are significantly less likely to originate mortgages to minority borrowers, compared with independent mortgage companies, but are more similar to independent mortgage companies in terms of their share of lending to LMI borrowers and neighborhoods. Patterns of lending over time by demographic group and lender type are discussed in detail in a later section. Fourth, the HMDA data provide information on whether originated loans were sold within the same calendar year and the type of institution to which they were sold, such as one of the GSEs or a banking institution (see appendix A for a full list of purchaser types). Table 11 displays the fraction of loans sold within the calendar year, as opposed to being held in portfolio.44 Nondepositories sold virtually all of their loans in 2014. In contrast, credit unions sold less than one-half of the home-purchase loans they originated and less than one-third of the refinance loans they originated. That said, as discussed later, portfo- lio lending among depositories has declined significantly over time. Table 12 lists the top 25 reporting institutions according to their total number of origina- tions, along with the same set of lending characteristics as those listed in table 11.45 Wells Fargo reported the most originations, with about 374,000. The next-highest total was for Quicken Loans, followed by Bank of America and JPMorgan Chase. Overall, the top 25 lenders accounted for about 34 percent of all loan originations in 2014, down from 41 per- 43 Other criteria must also be met to achieve safe-harbor status, such as holding the loan in portfolio for at least three years. 44 Because loan sales are recorded in the HMDA data only if the loans are originated and sold in the same calen- dar year, loans originated toward the end of the year are less likely to be reported as sold. For that reason, statistics on loan sales are computed using only loans originated during the first three quarters of the year. 45 Some institutions may be part of a larger organization; however, the data in table 12 are at the reporter level. Because affiliate activity has declined markedly since the housing boom, a top 25 list at the organization level is not likely to be significantly different. 28 Federal Reserve Bulletin | November 2015