Banks operating in Switzerland continue to grow. However, it is regional banks , not the leaders who drive the market.

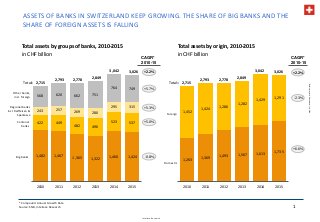
Banks operating in Switzerland continue to grow. However, there are structural changes taking place in the Swiss financial sector. As largest banks slowly lose market share, the position of regional and cantonal banks is improving. The share of domestic assets is growing while the share of foreign assets decreases, which could be attributed to increasing regulatory and compliance requirements. It could be also a warning sign that the role of Switzerland among global banking centers is eroding. The profitability of banks in Switzerland improved significantly in 2015. However, the key driver was extraordinary result and not the ordinary business. By contrast, the cost-to-income ratio, reflecting the core banking activity has deteriorated to above 70%. Banks look for solutions to improve productivity by a range of measures including higher automation and alternative distribution channels. In the same time the physical distribution network and the number of employees are being gradually reduced. Raiffeisen Group and cantonal banks from Luzern and St. Gallen were the fastest growing banks among TOP 12 institutions, in terms of assets in 2015. For more visit: http://www.inteliace.com/en/00147_Swiss_banks.html

Recomendados
Recomendados
Mais conteúdo relacionado
Último
Último (20)
Destaque
Destaque (20)
Banks operating in Switzerland continue to grow. However, it is regional banks , not the leaders who drive the market.
- 1. Inteliace Research BankingsectorinSwitzerland,July2016 1,263 1,369 1,493 1,567 1,613 1,735 1,452 1,424 1,286 1,282 1,429 1,291 2010 2011 2012 2013 2014 2015 ASSETS OF BANKS IN SWITZERLAND KEEP GROWING. THE SHARE OF BIG BANKS AND THE SHARE OF FOREIGN ASSETS IS FALLING 1 Total assets by groups of banks, 2010-2015 in CHF billion * Compound Annual Growth Rate Source: SNB, Inteliace Research Total assets by origin, 2010-2015 in CHF billion -0.8% +5.0% +5.3% +5.7% +2.2% -2.3% +6.6% CAGR* 2010-15 2,715 2,793 2,778 2,849 3,042 3,026 Foreign Domestic 1,482 1,467 1,365 1,322 1,460 1,424 422 449 482 496 523 537 243 257 269 280 295 315 568 620 662 751 764 749 2010 2011 2012 2013 2014 2015 +2.2% Total= 2,715 2,793 2,778 2,849 3,042 3,026 Total= Big banks Cantonal banks Regional banks incl. Raiffeisen & Sparkasse Other banks, incl. foreign CAGR* 2010-15
- 2. Inteliace Research BankingsectorinSwitzerland,July2016 AS THE NUMBER OF BANK OUTLETS AND EMPLOYEES SHRINKS, THE PRODUCTIVITY IS INCREASING 2 Outlets and employment in Swiss banks, 2010-2015 in CHF billion * Excluding HQ Source: SNB, Inteliace Research Total assets per employee, in CHF million 3,405 3,338 3,294 3,240 3,188 3,124 2010 2011 2012 2013 2014 2015 Bank Outlets* Employment (in `000) 132.0 132.5 128.9 127.1 125.3 123.9 2010 2011 2012 2013 2014 2015 -1.3% CAGR 2010-15 24.2 25.0 20.2 20.6 13.2 Cantonal banks Big banks Regional banks incl. Raiffeisen, Sparkasse Average Other banks, incl. foreign 31.0 26.9 25.0 24.4 18.3 2010 2015 +28% Change 2010-15 +8% +24% +19% +39% Type of bank-1.7% CAGR 2010-15 An average productivity improvement of 19% (assets per employee) could be observed during 2010-2015.
- 3. Inteliace Research BankingsectorinSwitzerland,July2016 ROAE** 0.1 6.6 4.4 8.7 2012 2013 2014 2015* 3 THE PROFITABILITY OF SWISS BANKS IMPROVED IN 2015. HOWEVER, IT COULD BE ATTRIBUTED MOSTLY TO ONE-OFF EVENTS. THE C/I RATIO DETERIORATED TO OVER 70. Profit before tax and extraordinary items Extraordinary items + taxes Profit after tax Net interest revenue Net fee & commission revenue Net banking revenue Wages & social security Net reserves Other banking revenue Profitability tree for Swiss banks, 2012-2015 Percent of average assets, (May not always sum to 100% due to rounding) * A change in methodology can partially affect 2015 figures – in particular, interest revenue and net reserves could not be fully comparable with earlier datapoints ** Return on equity - based on average annual equity Source: SNB, Inteliace Research Revenues stagnate Costs & charges & other Depreciation Other operating costsCost to income ratio Personnel costs are well under control 0.01 0.37 0.25 0.52 2012 2013 2014 2015* 0.14 0.27 0.15 0.23 2012 2013 2014 2015* -0.13 0.10 0.10 0.29 2012 2013 2014 2015* 1.98 1.89 1.94 1.87 2012 2013 2014 2015* 0.99 0.95 0.84 0.86 2012 2013 2014 2015* 0.13 0.15 0.30 0.08 2012 2013 2014 2015* 0.35 0.27 0.26 0.31 2012 2013 2014 2015* 0.50 0.52 0.53 0.62 2012 2013 2014 2015* 0.75 0.79 0.80 0.79 2012 2013 2014 2015* 0.84 0.87 0.81 0.74 2012 2013 2014 2015* 0.53 0.50 0.47 0.57 2012 2013 2014 2015* 2.12 2.16 2.09 2.10 2012 2013 2014 2015* 70.4 67.9 65.8 70.3 2012 2013 2014 2015* Net profit margin improved Equity profitability surged in 2015 Extraordinary profit booked in 2015 F&C margin is falling Other costs increase C/I ratio increased in 2015
- 4. Inteliace Research BankingsectorinSwitzerland,July2016 -2 -3 9 -2 -4 2 3 3 -1 11 6 -5 762 662 202 153 116 80 43 42 34 33 31 28 UBS & UBS CH ** Credit Suisse Raiffeisen Group Zürcher Kantonalbank PostFinance Bank Julius Bär & Co. Banque Cantonale Vaudoise Migros Bank Banque Pictet & Cie SA Luzerner Kantonalbank St.Galler Kantonalbank Berner Kantonalbank AG LARGEST BANKS LOSE SHARE IN FAVOUR OF MID-SIZE PLAYERS 4* Excluding the central bank - Schweizerische Nationalbank and other institutions with special field of business, e.g. Pfandbriefbank schweizerischer and Pfandbriefzentrale der schweizerischen Kantonalbanken Hypothekarinstitute; ** Combined figure for two separate UBS banks Source: Banks, SNB, Inteliace Research Assets growth rate 2015/2014, percentBankRank Top 12 banks* in Switzerland by total assets, 2015 Total assets as of 2015, CHF billion Total TOP 122186 -0.9 Assets of mid-size players are growing while assets of top banks are shrinking Category Big bank Big bank Raiffeisen bank Cantonal bank Other bank Other bank, focus on: stock market, securities, asset managrement Cantonal bank Other bank Other bank, focus on: stock market, securities, asset managrement Cantonal bank Cantonal bank Cantonal bank 1 2 3 4 5 6 7 8 9 10 11 12