
Recomendados
Mais conteúdo relacionado
Mais procurados
Mais procurados (20)
Destaque
Destaque (20)
Semelhante a Jyothirgamaya2
Semelhante a Jyothirgamaya2 (20)
Mais de Citizens for Accountable Governance
Mais de Citizens for Accountable Governance (20)
Último
Último (20)
Jyothirgamaya2
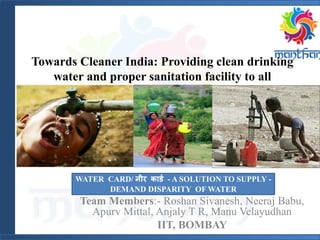
- 1. Towards Cleaner India: Providing clean drinking water and proper sanitation facility to all Team Members:- Roshan Sivanesh, Neeraj Babu, Apurv Mittal, Anjaly T R, Manu Velayudhan IIT, BOMBAY WATER CARD/ नीर कार्ड - A SOLUTION TO SUPPLY - DEMAND DISPARITY OF WATER
- 3. • Drinking water supply and sanitation in India continue to be a serious issue, despite never ending efforts from the govt. • India largest consumer of Groundwater. In some parts of the nation , we are currently extracting FOSSIL WATER(non-replenishable) • India Rural – Urban Population having clean drinking water and sanitation, as (in 2008) PROBLEMSTATEMENT 96% 4% Urban Sanitation Has improved sanitation facility No sanitation facility 54%46% Urban Drinking water Has drinking water facility No drinking water facility 21% 79% Rural sanitation Has improved sanitation facility No sanitation facility 84% 16% Rural Drinking water Has drinking water facility No drinking water facility
- 4. • As per NRDWP data upto date, of % coverage in rural india is 90%.(approx). • Who/what are the major culprit for this crisis? – Lower Avg. Rainfall across the nation – Geophysical Strata – Poor engineering strategies – Poor post implementation and policy strategies related to the water sanitation projects. – Social Apathy • Thousands of Crores of Rs. spent on various schemes implementation, so far in various states of India. (It varies from about Rs.8000cr.-Rs.9000 cr. in An annual action plan) • But has these scheme actually covered successfully the targeted population the scheme was designed for? 90% 10% % Coverage of population with drinking water facility Population Fully covered Population Partially Covered PROBLEMSTATEMENT Solvable
- 6. • NRDWP has done a great deal by covering about 90% of the complete rural population in the nation. And also making a very transparent and detailed database regarding the water schemes present , scaling to even the habitations of a village. • But the coverage claim, do not confirm the fact that all the beneficiaries has access to safe quality of drinking water with the benchmarked quantity of 40lpcd. • Thousands of Crores of Rs. spent every FYP for the purpose of implementing new schemes with a new target population, but there has to be a transparent and accountable mechanism to analyze the well being of the covered beneficiaries. • Thus there is a potential need to analyze the extent to which the people are benefitted or affected by conducting questionnaire survey in all the Households of a village and calculating a score that would be graded against a pre-calculated benchmark, called “WATER LINE”, (just like poverty line). PROPOSEDSOLUTION
- 7. • Households scoring lower than the “WATER LINE”, are in the Below Water line(BWL), and Households scoring higher than the “WATER LINE”, are in the Above Water line(AWL). • This concept should be incorporated using a “WATER CARD” / ” नीर कार्ड” and a Water book, with unique identification number, which will be given to each Household after data collection. • On a larger perspective this indirectly would give a beneficiary feedback and retrospection of the already implemented schemes. • Depending on the criticality of the situation, better and faster rectification methods should be followed with the community support. Households are expected to fill their remarks in the water book on weekly basis and giving to the GramPanchayath office for monthly updation of their water score. • Since water and sanitation go hand in hand, solving water issue would solve the sanitation issue by building Public toilets @ community level in a village, with a BioGas plant input with the sewage waste, thereby producing cooking gas. This needs campaigning and formation of Water-Sanitation committee to ensure social participation and ownership. PROPOSEDSOLUTION Note:- Calc. of the water line and respective score is included in the annexure
- 8. PHOTO Ministry of Drinking Water & Sanitation Government of India भारत सरकारपेयजऱ और स्वच्छता मंत्राऱय Name: - _______________ S/D/W of: - ______________ Reg. No.: - 20.13.03.06.09.12.0000 WATER CARD/ नीर कार्ड Address : - ______________ ______________ PROPOSEDSOLUTION
- 10. Scheme Analysis Scheme Functionality Source Sustainability Economical Viability Technical Feasibility Institution Capability Social Participation Beneficiary issues Quality issues of water Number of sources Affordability Drudgery Sanitation problems Quantity issues Volunteers Gram Panchayth office Analysis 1) Data collection from beneficiaries by questionnaire conducted by volunteers. 2) Scheme Analysis by Technical dept.. 3) Water Card generated 4) Analysis completed for the overall village. 5) Rectification of failed scheme. 6) Improvement of the water scarcity situation in the village, then step1 1 2 3 4 5 1 2 3 4 5 6 6 IMPLEMENTATIONOFSOLUTION • Govt. officials • NGO Volunteers • Consulting Volunteers
- 11. Pre Implementation Phase A Guidelines and requirements framed and conveyed Questionnaire prepared for the volunteers Training for volunteers. Conducting surveys with the questionnaire Pre Implementation phase B CAMPAIGNING in all panchayaths across the nation Application form for the WATER CARD distributed to volunteers. Help desks to help fill the application form in the Panchayath. Implementation Phase Maintaining an internet portal back ended with a database by the WATER CARD dept.. Generation of WATER CARD (AWL/BWL) along with Card Number. Water Book handed over to the beneficiary Household. Feed Back Phase Weekly entry of data in the book. Monthly Data updating, in the GP, to observe changes in their situation of water problem. DATA ENTRY into the Database. Scheme Phase Every 6months, ANALYSIS of the situation is done in the village. Firstly from the direct visits made to the sources as reported by the villagers. Secondly from the actual reports of the villagers.(To note the improvement in the situation ) Conceiving a solution for the community. IMPLEMENTATIONOFSOLUTION FLOW OF EXECUTION
- 12. IMPLEMENTATIONOFSOLUTION FLOW OF ORGANISATION Asst.Senior ProjectOfficer Admin & Finance Dept. IT Dept. Technical Dept. Logistics Dept. Field Volunteers Evaluation and monitoring dept. SeniorProject Officer Admin & Finance Dept. IT Dept. Technical Dept. Logistics Dept. Field Volunteers Evaluation and monitoring dept. JuniorProject Officer Admin & Finance Dept. IT Dept. Technical Dept. Logistics Dept. Field Volunteers Evaluation and monitoring dept. Ministry of Drinking Water & Sanitation Joint Secy (Water). Water Quality. Mgt.Dept Asst. Director & Project Directors Joint Secy (Sanitation). Evaluation & Monitoring Dept. Asst. Directo & Project Directors STATE LEVEL DISTRICT & SUB- DISCTRICT LEVEL GRAM PANCHAYATH LEVEL CENTRALLEVEL
- 13. IMPLEMENTATIONOFSOLUTION PROJECT IMPLEMENTATION COST(@ State level) No.of employees Salary Paid/mo nth Avg. salary Per annum (Rs.) Other Investments Total Fund required(Rs.) Project Head 3 42000 1512000 0 1512000 Admin. & Finance Dept. 11 28000 3696000 10000000 13696000 IT Dept 20 22000 5280000 8000000 13280000 Technical Dept. 150 35000 63000000********** 63000000 Logistics Dept. 70 18000 15120000 200000000 215120000 Field Volunteers 5000 12000 720000000 0 720000000 Evaluation & monitoring dept. 40 30000 14400000 8000000 22400000 Media Dept. 7 18000 1512000 15000000 16512000 Total 1065520000 Total Cost for the implementation of the project comes upto Rs.107 crores Note:- *******- Expenses incurred only once the project is running.
- 15. MERITS • Requires well committed volunteers to conduct questionnaires. • Demands a genuine participation from the villagers and the officials. • It may take up long time to get a perfect result. • Campaigning must take place across all the villages in the Gram Panchayath. • Data updating may be time consuming and tedious. • Algorithm for the calculation of “Water line”, may require changes. • Caste wise scoring has not been considered. IMPACTSOFTHESOLUTION CHALLENGES • National Level Water line alleviation is done. • Priorities set for the critically affected society of the nation, depending on the slots/ slabs allotted. • Provides a feedback system as it invites a review mechanism to understand the situation of older schemes already implemented in the village and the reasons for criticality. • Gram Panchayath now holds a better position to tackle the issue technically. • Designing a model for the best suitable situation depending on the number of sources and also considering the monsoon and non-monsoon transitions. • Improvements made can be thus easily analyzed. • Provides a platform to conceive a new scheme. • Central/Regional level data can be easily integrated. • This solution embalms the existing NRDWP objectives. • If the issue of water distribution is solved the sanitation gets solved subsequently. FUTURE SCOPE • It can be easily associated with the AADHAR card • NREGS works/employment may also be associated. • Payments made for the scheme can be included.
- 17. Reg. No.: - 20.13.03.06.09.12.0000 State No. District No. Sub District/ Taluk No. Block No. Gram Panchayath No. Village/ Hamlet No. House No. ANNEXURE
- 18. WATER SCORE Calculation • Q Score – Weighted sum of colour with corresponding quantity : Q1 Ex: - The example shows a sample data of a Household depending on 4 sources for water. S1 means source 1. The quantity of water taken on an avg. per day/person for the Household from the corresponding sources are hereby: Weighted Sum will be product of 𝑖 = 1: 𝑛 (Si_color * Si*Quantity consumed)= Q1 Here „n‟ is the number of sources, this may include both Groundwater and surface water sources. – Weighted sum of smell with corresponding quantity : Q2 – Weighted sum of taste with corresponding quantity : Q3 Colour S1 S2 S3 S4 S5 . . . . Sn Monsoon 2 0 1 0NA NA NA NA NA NA Non-Monsoon 2 1 2 0NA NA NA NA NA NA Score Remark 3 Good 2 Satisfactory 1 Poor Quantity S1 S2 S3 S4 S5 . . . . Sn Monsoon 4 lt. 3 lt. 2 lt. 2 lt.NA NA NA NA NA NA Non-Monsoon 2 lt. 0 lt. 2 lt. 2 lt.NA NA NA NA NA NA ANNEXURE
- 19. WATER SCORE Calculation • D Score(Drudgery) – Distance Score (D1) • Greater the dist. Travelled more the score. The example shows a sample data of a Household depending on 4 sources for water. S1 means source 1. Distance Score can be calculated from the table depending on the distance. Here the S2(2nd source) is 18km away from the beneficiary, so it is give score 5. – Time Taken Score (D2) • Greater the time taken more the score. The score are made differentially. Example: - – Delivery method Score (D3) • High Score if Bucket used and there was no pipe water connection, compared to availability of pipe connection. (i.e. delivery mode could be using mechanical or electrical energies(using motors)). • If there is an electric pump controlled water extraction, then D3 is taken as 1 else 3, if they use bucket/pots only. • Sanitation Facilities(SS) • Score found out using the table S1 S2 S3 S4 S5 . . . . Sn Distance(Score) 2 5 1 0NA NA NA NA NA NA Distance Score Remark 5 >15km 4 10-15 km 3 5-10 km 2 3-5 km 1 1-2 km 0 <1 km Time Score Remark 5 >3hrs 4 2-3 hrs 3 1hr- 2hrs 2 30mins- 1hour 1 15-30 mins 0 <15 mints S1 S2 S3 S4 S5 . . . . Sn Time(Score) 2 4 0 0NA NA NA NA NA NA Sanitation Facility(SS) S score No Toilets 5 Toilets Dysfunct(no water) 3 Toilets working 0 ANNEXURE
- 20. • Affordability (A) – Depending on the ratio of the money spent for water to savings on a month basis. Deficits would incur a very high score. If the expense is more than the savings then it is given 10 as the score. TOTAL WATER SCORE CALCULATIONS: - • From the earlier score tables, we calculate the following as: - – Total Quality-Quantity score, Q= Q1+Q2+Q3 – Total Drudgery Score, D=D1+D2+D3 Carrying out the same process for both drinking water and household water score calculation. Total Drinking Water Score, Td= Qd-(Dd+Ad) Total Household Water Score, Th= Qh-(Dh+Ah+SS) Total WATER score, T= Td+Th – If T ≥ 81, then Slot F, – If 61 ≤ T ≤ 81 , then Slot E – If 41 ≤ T ≤ 61, then Slot D – If 21 ≤ T ≤ 41 , then Slot C – If 2 ≤ T ≤ 20, then Slot B – If T ≤ 1.9, then Slot A Affordability Score Ratio(expense/savings) 10 >1.0 5 0.75-1.0 3 0.5-0.75 2 0.25-0.5 1 0-0.25 Water Line Above Water Line(AWL) Below Water Line(BWL) ANNEXURE
- 21. Scheme Score • For the officials to understand and analyze the schemes that has been existent so far in a certain village. • Each of the performance factors play a weighted contribution to the total score calculation. • Scores for each factor is actually found out using a score for a certain range of values. • Ex: - Weightage Factor(*__) s1 s2 s3 s4 s5 . . . . sn Functioning Years 2 2 4 1 2 2 Current Status 1.5 1 2 1 0 1 No. of Faults 1 5 4 5 2 4 Avg. Time taken to rectify 1 3 3 2 5 1 Post Scheme Maintaining Body 0.5 1 0 0 1 1 Social inclusion 0.5 1 1 0 0 1 Targeted Population 3 4 5 2 3 4 Population served 3 4 4 3 4 1 Color of water 1.5 2 3 1 2 1 Taste of water 1.5 1 3 1 2 1 Smell of water 1.5 2 1 3 1 2 36 41.5 33 38 33 Schemes Performance Factors Total Score 3*1 = 3 𝑊𝑖 ∗ 𝑆(1: 𝑛) 11 𝑖=1 n stands for the number of schemes in the village so far. ANNEXURE
- 22. Procedure :- • Application filled for Water Book / नीर बुक by the volunteer. • Verified by the water authority. • Depending on the verified matrix formulated by the water authority, the Household is put into a certain “water slot”, depending on the water scores. • Slots:- – Slot A – Slot B – Slot C – Slot D – Slot E – Slot F • Water Card produced along with the Water Book / नीर बुक. • Regular Entries to be made in the Water book / नीर बुक. • Monthly updating of data to the Gram Panchayath office. Critically affected(BWL) Semi Critically affected(APL/ BWL) Safe (AWL) ANNEXURE
- 23. Details for calc. • No. of sources dependent on (S#) • Quality (Q) of corresponding sources • Quantity(q) of corresponding sources • Drudgery(D) Factor (based on 3 primary source they depend) – Dist. Travelled to bring water – Time Taken – Delivery method – Health Issues – Affordability – Social issues(Ex: -Caste issues) • Scheme Performance(S*)(For officials) – Functioning Years – Current Status – Reasons of Failure – No. of Faults – Avg. Time taken to rectify – Post Scheme Maintaining Body – Social inclusion – Targeted Population – Population served ANNEXURE
- 24. THANK YOU